Molecular vibrations undergoing a transition from the ground state to the first excited state absorb radiation in the mid-infrared region of the spectrum, which extends from a wavelength of 2.5 μm (4000 cm-1) to 25 μm (400 cm-1). Historically mid-infrared spectroscopy was used in the pharmaceutical industry to identify the molecular structure of small molecules (typically with a molecular weight of less than 500 Daltons). Samples were either measured in solution or finely ground and prepared either as a KBr disk or a mineral oil mull and transmission spectra were measured on a grating spectrophotometer. The time required to measure a routine spectrum was typically about five minutes; if a high-resolution reference spectrum of the sample was required, measurements could take in excess of half an hour.
This situation changed around 1970 with the commercial introduction of the first Fourier transform infrared (FT-IR) spectrometer. These instruments could measure high-quality mid-infrared spectra in a few seconds. Sample preparation techniques also changed. In particular, the measurement of attenuated total reflection (ATR) spectra became routine. In ATR spectrometry, the infrared beam enters a shaped material with a high refractive index, n2, known as an “internal reflection element” (IRE). Any time the beam is incident on a surface inside the IRE at an angle above the critical angle (equal to sin-1n1/n2, where n1 is the refractive index of the medium immediately outside the IRE), the beam is totally internally reflected. The reflected radiation sets up a standing wave, known as the evanescent wave, that penetrates outside to the IRE. The intensity of the evanescent wave decays exponentially with the distance from the surface; the distance at which the intensity of the evanescent wave has decayed to 1/e of its value at the surface is known as the depth of penetration, dp. All that is required for the operator to measure an ATR spectrum is to press the sample against the IRE so that it is within the penetration depth of the evanescent wave. The most common IREs are are made from zinc selenide (n2 = 2.4) or germanium (n2 = 4.0). Most organic chemicals have a refractive index, n1 equal to about 1.5. In this case, dp is equal to about 0.2λ for ZnSe and 0.066λ for Ge when the angle of incidence at the surface is equal to 45°. More recently, the use of diamond IREs (n2 = 2.4) has become popular in light of diamond’s scratch resistance and durability. Diamond and ZnSe IREs have the advantage of a higher depth of penetration than Ge IRE with the same geometry, which leads to increased band intensities. This advantage is offset by the fact that ATR spectra measured with diamond or ZnSe are more distorted than the corresponding transmission spectrum compared to spectra measured with a high-index material like Ge. The cause of this distortion is the variation of n1 with wavelength in the region of strong absorption bands, an effect known as anomalous dispersion.
Since the depth of penetration is directly proportional to the wavelength of the infrared radiation, the bands in an ATR spectrum are weaker at the short-wavelength (high-wavenumber) end of the spectrum than at the long-wavelength end, but this is readily corrected by dividing the spectrum (after converting from transmittance to absorbance) at each point by the wavelength. It is a common misconception that after this “ATR correction” has been carried out, an ATR spectrum is essentially identical to the corresponding transmission spectrum. This is not so, however, because of the effect of anomalous dispersion (AD). Software to correct for the effect of AD is now available from several instrument manufacturers but is not in common use. Because many papers and patents describing the synthesis of new molecules require the wavenumbers of the stronger bands in the spectrum to be reported, there is a significant probability that if these numbers are taken from an uncorrected ATR spectrum (especially one measured with a ZnSe or diamond ATR accessory), they will be different from those taken from transmission spectra. Similarly, if compounds are to be identified by searching their ATR spectra against a database of reference spectra, users should be sure that the library spectra were measured by ATR using the same IRE as the sample spectra.
Despite these concerns, the measurement of ATR spectra is proving to be of great importance in the pharmaceutical industry. Instruments have been developed by which the ATR spectra of reacting mixtures can be acquired at time intervals of a few seconds. With these instruments, the intermediates and products being formed can be identified and the rate of the reactions that are occurring can be measured. In the past five years, hand-held ATR/FT-IR spectrometers have become commercially available. Among other applications, these devices can be used to confirm the identity of incoming raw materials used in the pharmaceutical industry, a procedure sometimes known as loading-dock analyses. The analysis of powdered samples can also be carried out by diffuse reflection (DR) infrared spectrometry. However the high intensity of the fundamental transitions that occur in the midinfrared region of the spectrum leads to distortions and artifacts and loading-dock analyses by DR spectrometry are better carried out by near-infrared spectrometry.
Because dp is usually only of the order of 1 μm, it was common practice to design IREs with multiple (typically 10) reflections so that the peak absorbance of strong bands would be about 1. In light of the high signal-to-noise ratio (SNR) of contemporary FT-IR spectrometers, the use of single-reflection IREs for ATR spectrometry has become popular despite the weakness of the absorption bands. Many of these IREs have a hemispherical geometry which makes them particularly suitable for microspectroscopy, as will be discussed below.
The typical diameter of the beam in the sample compartment of an FT-IR spectrometer is between 4 and 12 mm. Let us take 5 mm as an example. If a sample is only 0.5 mm in diameter and the sample is mounted behind a pin-hole of this diameter, its area is 1% of the beam diameter and only 1% of the incident light will be transmitted to the detector unless the beam diameter is reduced in some fashion. Measurements of such small samples used to be done with a simple beam condenser but are more commonly accomplished using a microscope with reflecting optics. The smallest sample that can be measured with a typical microscope is determined by the diffraction limit, which, for most FT-IR microscopes is approximately equal to the wavelength of the radiation. Microscopes have the great advantage of eliminating the need to mount the sample behind an appropriate pin-hole and are now in common use in laboratories equipped with FT-IR spectrometers. Because a sensitive mercury cadmium telluride (MCT) detector is mounted in the microscope, excellent spectra of microsamples can be measured in a few seconds.
One way of improving the spatial resolution is through the use of ATR microspectroscopy. When a hemispherical IRE is located at the focus of the microscope, the diffraction-limited beam diameter is reduced by the refractive index of the IRE, n2. Thus, with a Ge IRE, rather than being limited to a spatial resolution of about 10 μm, the achievable resolution is improved to about 3 μm.
When IR microscopes were first introduced, maps of the composition of heterogeneous samples were made by mounting the sample on a translation stage and incrementing the position of the sample stepwise. To measure a map of the composition of a 1 x 1 mm sample with a spatial resolution of 10 μm required 10,000 spectra to be measured. This situation changed when focal-plane array detectors were interfaced to FT-IR spectrometers. These devices typically incorporated 64 x 64 MCT array detectors, although larger arrays are commercially available at a price. Interferograms are measured simultaneously from each of these detectors so that 4096 interferograms could be measured from a 64 x 64 pixel detector in about the same time as it took to measure a single interferogram using a single-element detector.
When FT-IR spectrometers were first equipped with array detectors, it was necessary to stop the moving mirror of the interferometer at each sampling point so that the signal from each detector could be digitized. With the increased data acquisition speed of contemporary electronics, the use of a step-scanning interferometer is no longer mandated and continuous-scanning instruments are now used. It is now possible to obtain high-resolution images by either transmission or ATR spectroscopy with these instruments.
The limitation of spatial resolution by diffraction has fairly recently been circumvented in several innovative ways that are based on the interface of an atomic force microscope (AFM) with several different types of infrared spectrometers. Once such device was originally developed by Dazzi in France and has since been commercialized by Anasys Instruments. In the Anasys approach, a thin sample is mounted on a triangular IRE as shown in Figure 1A. An AFM tip is located immediately above the sample. Pulsed radiation from an optical parametric oscillator (OPO) which converts monochromatic laser pump radiation into a tunable output by a three-wave mixing process is passed through an IRE so that the sample is instantaneously heated by the evanescent wave at wavelengths where the sample absorbs. The region immediately adjacent to the AFM cantilever tip causes it to vibrate at its resonant frequency and this motion leads to a deflection of the laser mounted in the AFM. This deflection is sensed by a quadrant photodiode. The magnitude of the Fourier transform of the photodiode signal at the resonant frequency of the AFM cantilever is proportional to the signal at the wavenumber of the OPO, as shown in Figure 1B. By tuning the OPO, the spectrum can be measured from about 2000 to 600 cm-1. The spatial resolution that has been demonstrated using this technique is better than 50 nm. The main disadvantage of this approach is that the thickness of the sample should not exceed dp. Recently Anasys have demonstrated the feasibility of using an analogous approach in which the laser beam is incident on the upper surface of the sample, see Figure 2.
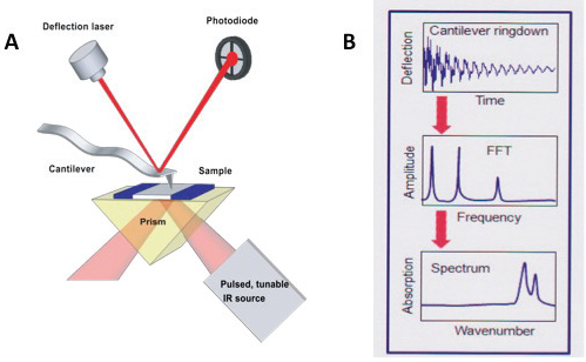 Figure 1. (A) Schematic of the technique used by Anasys Corporation in which the evanescent wave heats the cantilever tip of an atomic force microscope. (B) Above: cantilever ringdown signal measured by the photodiode of the AFM. Middle: Fourier transform of this signal. Below: spectrum resulting from scanning the OPO. (Courtesy of Craig Prater, Anasys Corporation.)
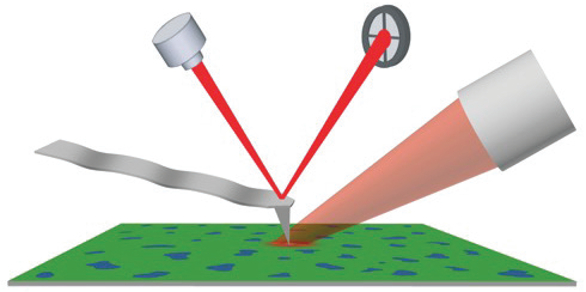 Figure 2. Schematic of AFM/FT-IR device in which the laser beam is focused on the top surface of the sample. (Courtesy of Craig Prater, Anasys Corporation.)
Although FT-IR spectrometers dominate the market for mid-infrared spectrometry, instruments based on other techniques have been reported in the past decade. The system described above is one example of a tunable mid-infrared laser. Another example is the quantum cascade laser (QCL). QCLs can be tuned over a range of about 200 cm-1. The high power of a QCL can sometimes allow measurements that only require a limited spectral range to be made that are limited by the sensitivity of an FT-IR spectrometer. One manufacturer of QCLs (Daylight Solutions) has mounted together four lasers that operate over adjacent ranges to give a total tuning range of about 800 cm-1. Thus a QCL may be used instead of the OPO for nanospectroscopy at the cost of decrease wavelength coverage. This author expects to see several pharmaceutical applications of QCLs in the next five years. At this point, however, FT-IR spectrometers dominate the market for midinfrared instruments.
The last mid-infrared spectrometer that I will mention in this brief summary of mid-infrared instruments used in the pharmaceutical industry is one that is designed to measure vibrational circular dichroism (VCD) spectra. VCD spectra result from the very small difference between the absorption spectrum of molecules with one or more chiral centers to left and right circularly polarized radiation. These difference are usually on the order of 104 times less than the absorbance of bands in the spectrum. Since it is usually found that the SNR of spectra measured with conventional FT-IR spectrometers in times of less than 1 minute is between 104 and 105, VCD cannot be measured by simply subtracting spectra measured with left and right circularly polarized radiation. Instead, a high-frequency photoelastic modulator is used to rapidly switch plane polarized input radiation between the left and right circularly polarized states. The difference signal is passed into a lock-in amplifier the output of which is proportional to the VCD signal. Nafie and his coworkers have shown how such spectra can be measured on a FT-IR spectrometer and his company (BioTools) has sold over 50 of these instruments to pharmaceutical laboratories. By comparing experimentally measured and theoretically calculated VCD spectra, the configuration at each chiral center of optical isomers can be deduced. An example of this process is shown in Figure 3.
 Figure 3. Observed (red) and calculated (green) VCD and absorbance spectrum of (S)-5-allyl-2-oxabicyclo[3.3.0]oct-8-ene. (Courtesy of Bo Wang, BioTools Corporation.)
Clearly mid-infrared spectrometry is no longer just a technique for characterizing molecules that have been prepared in synthetic organic labs. They now play an important role in every aspect of pharmaceutical chemistry from research and development to manufacture.
Recommended Reading
- Fourier Transform Infrared Spectrometry, 2nd Edition, P. R. Griffiths and J. A. de Haseth, Wiley-Interscience, Hoboken, NJ (2007). [Contains relevant chapters on ATR, diffuse reflection, microscopy and imaging.]
- Applications of Vibrational Spectroscopy in Pharmaceutical Research and Development, D. E. Pivonka, J. M. Chalmers and P. R. Griffiths, eds., John Wiley and Sons, Chichester, UK (2007). [Contains applications of vibrational spectroscopy in drug discovery, combinatorial chemistry, structure-activity relationships, reaction monitoring, process development, solid state characterization, VCD and pharmaceutical mapping and imaging.]
- Infrared and Raman Spectroscopic Imaging, 2nd Edition, R. Salzer and H. W. Siesler. Eds., Wiley-VCH, Weinheim, Germany, (2014). [Contains detailed discussions of infrared mapping and imaging.]
- “AFM–IR: Combining Atomic Force Microscopy and Infrared Spectroscopy for Nanoscale Chemical Characterization”, A. Dazzi, C. B. Prater, Q. Hu, D. B. Chase, J. F. Rabolt and C. Marcott, Appl. Spectroc., 66, 1365-1384 (2012). [Describes many different applications of nanospectroscopy.]
- “Applications of Attenuated Total Reflection Infrared Spectroscopic Imaging to Pharmaceutical Formulations”, K. L. A. Chan, S. V. Hammond and S. G. Kazarian, Anal. Chem., 75, 2140-2146 (2003).
- “Pharmaceutical applications of Mid-IR and Raman spectroscopy”, S. Wartewig and R. H. Neubert, Adv. Drug Deliv. Rev., 57, 1144-1170 (2005).
- "Determination of absolute configuration of chiral molecules using vibrational optical activity: A review", Y. He, B. Wang, R. K. Dukor and L. A. Nafie, Appl. Spectrosc. 65, 699-723 (2011).