Martin M. Kimani, Ph.D.; Adam Lanzarotta, Ph.D.; Michael D. Thatcher.; JaCinta S. Batson, M.S.
US Food and Drug Administration, Office of Regulatory Affairs, Office of Regulatory Sciences, Forensic Chemistry Center, Cincinnati, Ohio, 45237, USA
The use of injectable materials for soft-tissue augmentation has been increasing globally (1). The US FDA has approved materials such as calcium hydroxylapatite, poly-L-lactic acid (PLLA), polymethylmethacrylate beads (PMMA microspheres) and cross-linked hyaluronic acid (HA) as injectable dermal fillers. Cross-linked HA, calcium hydroxylapatite and PLLA are absorbable temporary materials that last in the body for approximately 6 to 24 months, whereas PMMA microspheres are comprised of a non-biodegradable man-made polymer (2, 3).
The increased demand for dermal fillers has resulted in the emergence of unapproved products that are flooding the US supply chain and could result in adverse and/or irreversible effects in consumers (4). The US FDA’s Forensic Chemistry Center (FCC) has received hundreds of unapproved injectable dermal fillers through the course of criminal investigations over the last 10 years. Although this laboratory has encountered products that contain each of the compounds listed above, the most frequently received unapproved products are labeled to contain HA, some of which made their way through US ports of entry such as international mail facilities (IMFs) and express courier hubs (ECHs) (5). Lidocaine may be present in both approved HA-containing dermal fillers as an allowed anesthetic to decrease pain or discomfort during the procedure (2). Dermal fillers labeled to contain or found to contain polydimethylsiloxane/silicone (PDMS) are not FDA-approved (2) for any aesthetic procedures due to risk of long-term pain, infection, permanent disfigurement, embolism, stroke and death (3, 6–8). Injectable silicone is currently only approved by the FDA for intraocular ophthalmic use (6). Consequently, there is a need for rapid detection of HA, PMMA, PLLA, calcium hydroxylapatite, lidocaine and adulterants (such as PDMS in unapproved dermal fillers). There is a need to conduct these analyses at remote sampling sites such as IMFs and ECHs so that suspect products can be examined on-site without requiring off-site laboratory analysis for regulatory action to be taken.
The presented work describes the analysis of unapproved dermal fillers gel labeled to contain HA and lidocaine obtained from an adjudicated criminal case using Fourier transform infrared spectroscopy (FT-IR) and surface enhanced Raman scattering spectroscopy (SERS). Results from the FT-IR analysis of neat and oven-dried gels to detect HA, lidocaine and PDMS will be presented. The development and implementation of simple SERS and FT-IR micro-extraction methods for identification of lidocaine and other adulterants in these products will also be discussed.
Materials and Methods
The following reference standards, reagents and materials were used: lidocaine HCl, lidocaine free base, sodium hyaluronate, methanol (HPLC grade) and potassium bromide (Sigma-Aldrich Chem Co.; St. Louis, MO); poly-L-lactic acid, poly(methyl methacrylate), polydimethylsiloxane (PDMS), nylon plus glass 30-mm diameter, PTFE 0.20-μm and 0.45-μm pore size filters (Thermo Fisher Scientific Corp.; Waltham, MA); calcium hydroxylapatite (Merz Aesthetics, Raleigh, NC), silver colloids (Real-Time Analyzers; Cheshire, CT), 3 mL luer-lock syringes (Becton, Dickenson and Company, Franklin Lakes, NJ). The following equipment was used: electronic pipette (Gilson Inc., Middleton, WI); Vortex-2-Genie (Scientific Industries Inc., Bohemia, NY); Mettler Toledo XS205 Semi-Micro balance (Mettler Toledo AG, Greifensee, Switzerland).
Instrumentation: Handheld Raman spectrometers included: TruScan RM (785 nm laser, Thermo-Fisher Scientific Corp., Waltham, MA); Progeny ResQ (1064 nm laser, Rigaku Americas Corp., The Woodlands, TX). FT-IR analyses were conducted using a benchtop Nicolet 8700 spectrometer (Thermo-Fisher Scientific Corp., Waltham, MA).
Sample Selection
Samples consisted of seven suspect unapproved dermal fillers that were taken from an adjudicated criminal case, which were labeled to contain cross-linked HA (24 mg/mL), lidocaine HCl (3 mg/mL) and phosphate-buffered saline (pH 7.0).
FT-IR Analysis
Standards Preparation
FT-IR spectra of neat standards were collected. Additionally, the spectra of lidocaine HCl and lidocaine free base recrystallized using chloroform were also collected. Recrystallization was performed to account for any variations or changes that may be observed in the standard spectra due to changes in crystallinity resulting from the extraction process. Approximately 2 mg of each standard was dissolved in chloroform and used for each recrystallization. Several drops of lidocaine dissolved in chloroform were transferred to a microscope slide using a disposable pipette and allowed to air dry. The dried residue was transferred to internal reflectance element (IRE) surface using a razor blade and fine-pointed probe. Appropriate pressure recommended by the manufacturer was applied and a spectrum was collected.
Sample Preparation
All samples were analyzed neat, oven dried and extracted using chloroform, as described below.
Neat analyses: Portions of suspect liquids were transferred directly to the IRE surface and a spectrum was collected with no pressure applied.
Oven dried samples: Approximately 0.3 mL of each suspect liquid was transferred to individual microscope slides and placed in the oven at a temperature of 90°C for 20 minutes. The solidified residue was removed from the slide with a clean razor blade, placed on the IRE and examined with appropriate pressure applied for contact.
Chloroform extraction: Approximately 0.3 mL of each liquid was placed in individual 4 mL glass scintillation vials. To each vial was added 1 mL of deionized water and the contents vortexed for 30 seconds, after which 2 mL of chloroform was added to the vial and centrifuged for 5 minutes at a relative force of gravity (RCF) of 3075. A portion of the chloroform layer was transferred to a microscope slide and allowed to air dry. The resultant semi-solid residue was removed from the slide with a clean razor blade, smeared on the IRE and examined with no pressure applied for contact.
SERS Analysis
Standards Preparation
Lidocaine HCl and the lidocaine free base standards were weighed using a calibrated analytical balance and an appropriate amount of diluent was added to each using a calibrated electronic pipette. Stock solutions of 1 mg/mL of each individual standard were prepared in a 10% methanol solution in deionized water and diluted to a concentration of 100 µg/mL. A SERS signature spectrum of lidocaine was collected using the procedure below.
Ag colloidal solution (250 µL) was transferred to a 4 mL glass vial followed by addition of 250 µL of lidocaine (100 µg/mL) in 10% MeOH in H2O and 5 µL KBr aqueous solution. The glass vial was capped and vortexed for 30 seconds. The sample equilibrated for 30 seconds prior to conducting Raman analysis.
Sample Preparation
Suspect liquids (0.3 mL) were placed in separate 4 mL glass scintillation vials. To each vial was added 0.5 mL of 10% MeOH in deionized water and the contents vortexed for 30 seconds. Ag colloidal solution (500 µL) was transferred to each vial and was mixed for 30 seconds using a vortex mixer. Finally, 5 µL KBr (3 M) solution was transferred to the vial followed by vortexing for an additional 30 seconds. The sample equilibrated for 30 seconds prior to conducting Raman analysis.
Results and Discussion
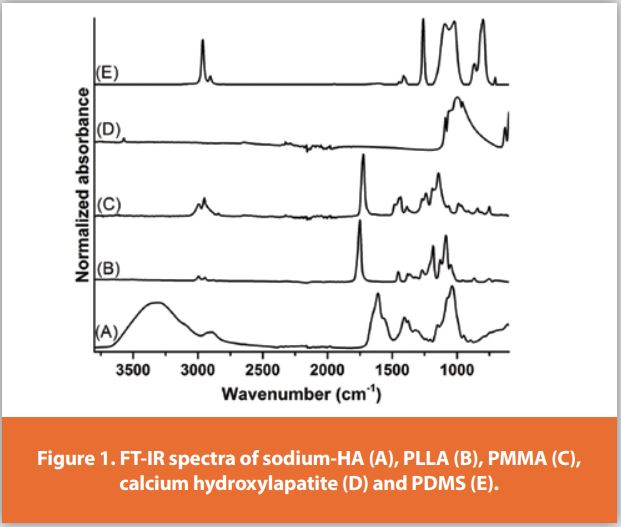
FT-IR: The FT-IR signature spectra of the reference standards for FDA-approved filler materials are presented in Figure 1. The standards exhibit characteristic spectral data sufficient for use as signature spectra and can be easily distinguished from each other.
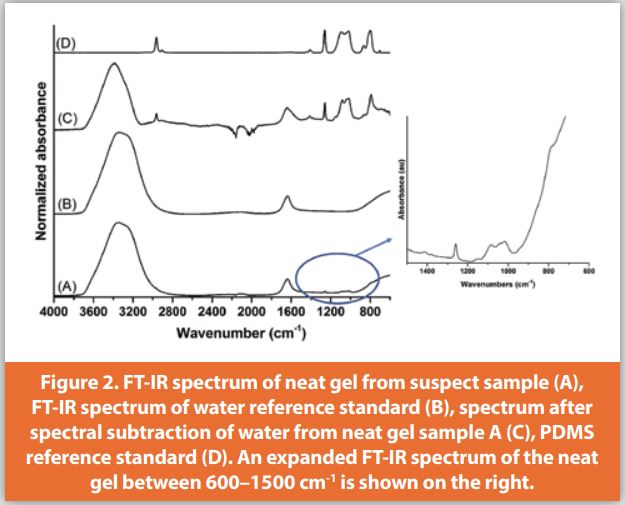
All suspect dermal filler gels were first analyzed neat (no sample preparation) and spectrally searched using all standard spectral libraries (in-house and commercial). Using FT-IR spectroscopy, the neat gels were determined to contain water based on the OH stretching and bending absorptions (Figures 2A and 2B). The presence of PDMS was detected after spectral subtraction (Figure 2C); the suspect spectrum exhibited nearly a peak-for-peak match with the standard across the entire spectral range (Figure 2D) with exception of the broad OH absorptions.
Since the broad OH absorptions assigned to water obscure those characteristic peaks of other analytes in the neat sample, the gels were placed in an oven to evaporate the water. The clear gel presented in Figure 2A was placed in an oven and the FT-IR analysis of the oven dried sample (Figure 3A) revealed absorptions consistent with those of sodium hyaluronate (Figure 3B). The sodium hyaluronate standard spectrum was then spectrally subtracted from the sample spectrum, which yielded the spectrum shown in Figure 3C that exhibited peaks characteristic of PDMS (Figure 3D) (8, 9). Finally, the sample was further examined using a micro-liquid-liquid (water-chloroform) extraction procedure. The FT-IR spectrum of the residue dried from the chloroform layer (Figure 3E) yielded a library search result for, and exhibited absorptions characteristic of, lidocaine HCl recrystallized with chloroform (Figure 3F).
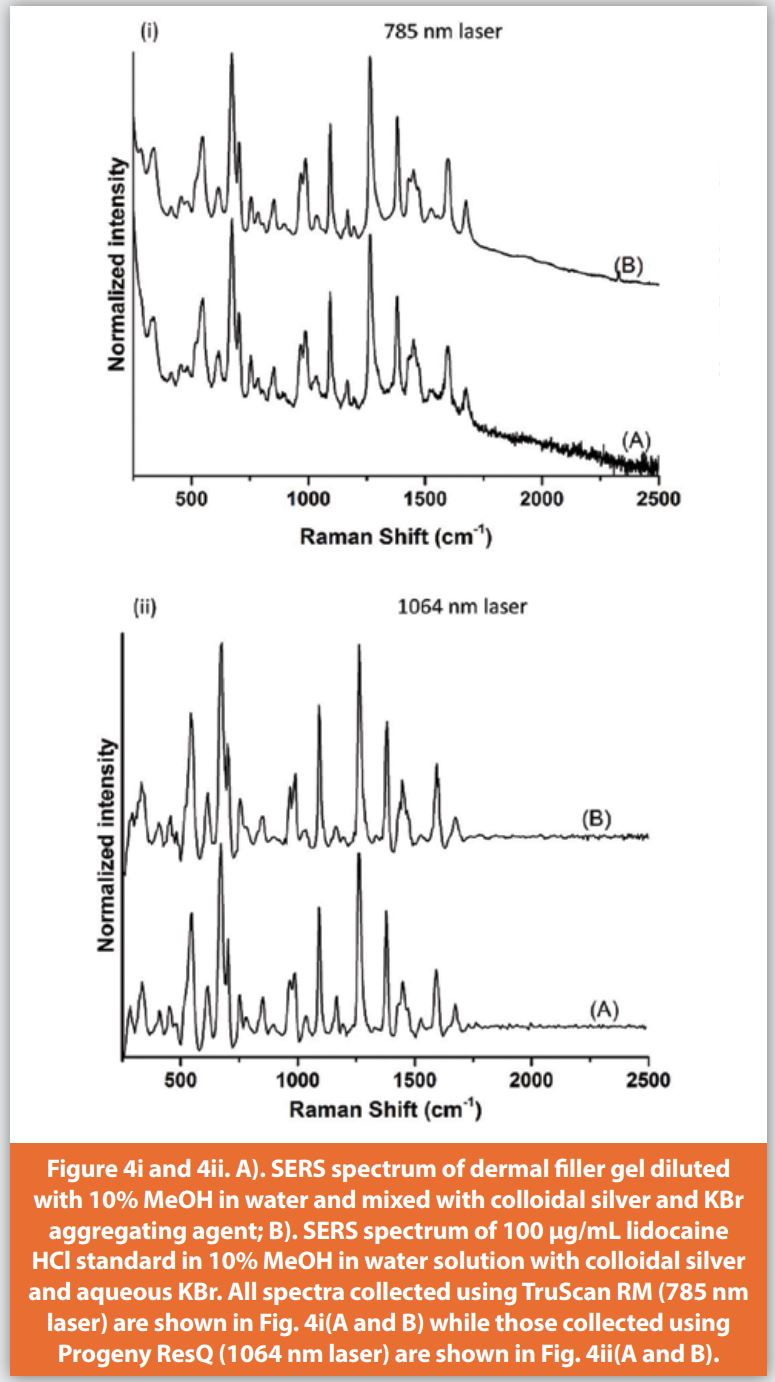
SERS: The suspect dermal fillers previously analyzed using FT-IR (Figs 2 and 3) were prepared for SERS analysis by diluting the gel using 10% MeOH in water followed by addition of Ag colloids and aqueous 3 M KBr. This procedure allowed the lidocaine present in the sample solution to be preferentially enhanced and therefore detected, even in the presence of other components such as HA and PDMS. For example, the SERS spectra of this sample solution mixture collected with Raman spectrometers equipped with 785 nm (Figure 4iA) and 1064 nm lasers (Figure 4iiA) were consistent with those of a lidocaine HCl standard solution mixed with Ag colloids and aqueous 3 M KBr (Figures 4iB and 4iiB, respectively).

The approach presented here is simple, has the potential to be portable and does not require the use of expensive reagents or radio-labeled standards. FT-IR spectroscopy has been shown to be highly selective for detecting a wide range of analytes and can be adequately applied in the analysis of dermal fillers labeled to contain HA and lidocaine. The FT-IR sensitivity was improved by oven drying the gels or via micro liquid-liquid extractions. Although Raman analysis of cross-linked HA found in dermal fillers using handheld spectrometers has not been successful due to poor signal intensity resulting from non-favorable (polar) functional groups (data not shown), the developed SERS method overcomes the sensitivity limitations of conventional Raman and permits the analysis of lidocaine. The results presented here reveal that these two complementary techniques can be used in the laboratory and potentially in the field to analyze the components found in dermal fillers. Although we have only shown one example here, the outlined procedure has been successfully used to analyze dermal fillers containing other compounds in the laboratory and in the field.
*The contents of this article are the author’s opinions and should not be considered as opinions or policy of the US FDA. The mention of trade names and manufacturers is for technical accuracy and should not be considered as endorsement of a specific product or manufacturer.
References
- Mobayed N, Nguyen JK, Jagdeo J. Minimally Invasive Facial Cosmetic Procedures for the Millennial Aesthetic Patient. J Drugs Dermatol. 2020 Jan 1;19(1):100-103. doi: 10.36849/JDD.2020.4641.
- https://www.fda.gov/medical-devices/aesthetic-cosmetic-devices/fda-approved-dermal-fillers
- Cheng LY, Sun XM, Tang MY, Jin R, Cui WG, Zhang YG. An update review on recent skin fillers. Plast Aesthet Res 2016;3:92-9.
- https://nypost.com/2019/05/01/diy-beauty-injectables-are-fueling-a-horrifying-online-black-market/
- https://www.cbp.gov/newsroom/local-media-release/philadelphia-cbp-seizes-more-100-shipments-illicit-dermal-fillers
- https://www.fda.gov/consumers/consumer-updates/fda-warns-against-injectable-silicone-body-contouring-and-enhancement
- https://www.fda.gov/consumers/consumer-updates/dermal-filler-dos-and-donts-wrinkles-lips-and-more
- Lanzarotta A, Kelley CM. Forensic Analysis of Human Autopsy Tissue for the Presence of Polydimethylsiloxane (Silicone) and Volatile Cyclic Siloxanes using Macro FT-IR, FT-IR Spectroscopic Imaging and Headspace GC-MS. J Forensic Sci. 2016;61(3):867-874. doi:10.1111/1556-4029.13018.
- Crowe, JB, Lanzarotta, A, Witkowski, MR and Andria, SE. Analysis of Hypodermic Needles and Syringes for the Presence of Blood and Polydimethylsiloxane (Silicone) Utilizing Microchemical Tests and Infrared Spectroscopy. J Forensic Sci. 2015, 60, 1078-1084.
Subscribe to our e-Newsletters
Stay up to date with the latest news, articles, and events. Plus, get special offers
from American Pharmaceutical Review – all delivered right to your inbox!
Sign up now!