Most Rapid Microbiology Methods (RMM) are inherently expensive and justifying its introduction into a system requires a thorough evaluation of the method itself. Of several factors involved, efficiency is an important factor that needs to be considered and evaluated. Efficiency entails an effective use of time and available resources for the best utilization of the method. In a production environment, the basic premise of efficiency is to minimize the consumption of resources while maximizing the output. While no official tools or techniques exist for measuring the efficiency with Rapid Microbiology Method, below is a generic and a practical approach to its measurement in a real world.
The efficiency method described in this article for the measurement of Rapid Microbiology Method is based on a parametric approach – i.e. an input/output model [1]. In this model, efficiency variables of a microbial method are identified and placed into either of the two categories: input variables or output variables. Ratios of input and output variables are calculated and compared amongst the methods – for example, traditional microbial method with that of a RMM.
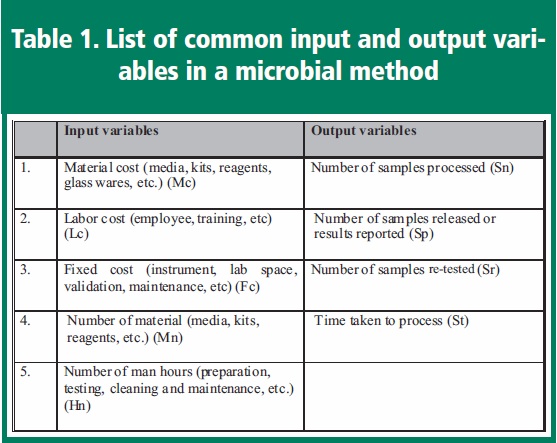
Efficiency Variables – The input variables are the resources and time utilized to obtain the result – i.e. an output. Likewise, the output variables are a resultant of the input variables. Table 1 lists some of the commonly occurring input and output variables in a microbial method. However, the classification of inputs used for a method would vary depending upon the type of method. For instance, in a traditional method, the input variable – Material Cost (Mc) would be the cost of media, glassware, etc. On the other hand, in a RMM, Material Cost (Mc) would be the cost of kits, reagents, glassware, etc.
The variables mentioned above can be utilized to measure two types of efficiencies: Technical Efficiency and Cost Efficiency.
Technical Efficiency – Measures a method’s speed, capacity, and ability to obtain the desired results.
Technical Efficiency Variables – The likely input variables used to measure this efficiency are number of material used (Mn) and number of man hours contributed (Hn). The likely output variables with this type of efficiency are number of samples processed (Sn), total time taken to process (St), number of samples released or results reported (Sp) and number of samples retested of total samples prepared (Sr).
Technical Efficiency Ratios – The efficiency variables identified above are then put in the ratio form to obtain the technical efficiency. Below are technical ratios that measure a method’s speed, capacity and ability.
Capacity Ratio = Number of samples processed (Sn)
Number of samples received (Sr)
Process Time Ratio = Number of samples processed (Sn)
Time taken to process (St)
Material Ratio = Number of samples processed (Sn)
Number of material used (Mn)
Cost Efficiency – Measures the economic value of the method to process a desired number of samples and results.
Cost Efficiency Variables – The likely input variables involved in the cost efficiency variables are the cost of material incurred (Mc) and the cost of labor (Lc). The likely output variables involved in measurement of this efficiency are number of samples processed (Sn), totaltime taken to process (St), number of samples released or results reported (Sp) and number of samples retested from total samples prepared (Sr).
Cost Efficiency Ratios – The efficiency variables identified above are then utilized in the ratio form to obtain the cost efficiency. Below are the cost efficiency ratios that measure the economic value of a method.
Sample to Cost Ratio = Number of samples processed (Sn)
Material Cost (Mc) + Labor Cost (Lc)
Time to Cost Ratio = Time taken to process sample (St)
Material Cost (Mc) + Labor Cost (Lc)
Other Efficiency Ratios – Further, input and output variables can be utilized to measure the efficiency of a method in terms of number of sample retested, number of man hours spent i.e., labor involved, and actual number of sample released. These ratios are indicated below:
Re-test Ratio = Number of samples retested (Sr)
Number of samples processed (Sn)
Sample Release Ratio = Number of samples processed (Sn)
Number of samples released or results reported (Sp)
Labor Ratio = Time taken to process sample (St)
Number of man hours spent (Hn)
Interpretation of Efficiency Ratios
Assigning the input and output variables and calculating ratios are only half the process of measuring the efficiency. Interpretation of the ratios obtained is the essence of the efficiency measurement process. There is no definite number in a ratio analysis that can be used to make conclusions about the efficiency of a particular method or an instrument. However, just like any other measuring system, a ballpark ratio number can be created for a particular method by a comparative procedure. For example, for an ideal method, the Comparison Ratio should be one – i.e. the number of samples received is equal to number of samples processed. However, if the ratio obtained is less than one, then it could be interpreted that the method or instrument’s capacity is limited and processing the maximum number of samples could be an issue. On the other hand, if the Capacity Ratio is more than one, then the method or instrument will be able to process more than daily average samples received.
The technique for measuring the efficiency suggested in this article is broad and its application is not limited to RMM; rather, it can be applied to laboratory instruments as well. Further improvements in efficiency with RMM or an instrument can be made by creating the efficiency curves and identifying inefficient variables [2].
References
1. Chen, W., Dissertation titled “The productivity efficiency analysis of Chinese steel firms: An application of data envelopment analysis”, West Virginia University. 1999.
2. Sengupta, J., Dissertation titled “A dynamic efficiency model using data envelopment analysis”, University of California, Santa Barbara, CA. 1995.
Manish Gandhi, M.S., is a Lead Microbiologist, Quality Control at Leiner Health Products. Manish possesses more than seven years of experience working with the rapid microbiology methods.