Abstract
The first steps in an Analytical Quality-by-Design (AQbD) method development include understanding the analysis needs (e.g., purpose, specificity, sensitivity, cycle time, on-line/off-line, qualitative/quantitative, accuracy, precision) and selection of the technique (which is at the receiving lab) that will meet these criteria. One set of analytical tools applied during the development and scale-up of drug substances and dosage forms include in-situ analytics, chemometrics and modeling (i.e., Process Analytical Technology (PAT) tools. Although the tools are similar, the performance requirements, approaches and drivers for using PAT in development can differ significantly from those for commercial manufacturing. In-situ analytics provides the potential for greater (and faster) understanding of the process as compared to traditional off-line analyses. Qualitative or semi quantitative analyses are often sufficient during process development, and the speed of data analysis is often of highest importance. The ability to monitor in real-time is invaluable during process development, process understanding and scaleup. PAT contributes to a greater understanding of the process design space in a Quality-by-Design (QbD) framework. PAT that measures critical quality attributes (CQA) may be progressed commercially for process control. However, the majority of PAT applications that are developed for process understanding will not. This article will provide an overview of typical API/DP PAT toolboxes and discuss case studies in which PAT has been utilized during the development of pharmaceutical candidates.
Introduction
Quality-by-Design (QbD) is well-established in development and manufacture of pharmaceutical drug substance and drug productand is discussed in ICH Q8 [1], Q9 [2] and Q11 [3]. The outcome of QbD is a well-designed and understood quality product that consistently delivers the intended performance. The knowledge obtained during development helps justify the establishment of a design space, (process) control strategy and set point within the (regulatory approved) design space. Materials made within the design space will produce an acceptable product, and changes within the design space are (regulatory) acceptable.
These same principles and concepts have been applied to the development of analytical methods, and termed Analytical QbD (AQbD). AQbD development for chromatographic methods have been described in detail [4-10]. Analogous to process QbD, the aim of AQbD is to design a well-understood, robust method that consistently delivers the necessary performance as described in the analytical target profile (ATP). One set of analytical tools used in support of pharmaceutical development and control include insitu analytics, chemometrics and modeling (i.e., Process Analytical Technology (PAT) tools.
PAT has been defined as “a system for designing, analyzing, and controlling manufacturing through timely measurements (i.e., during processing) of critical quality and performance attributes of raw and in-process materials and processes, with the goal of ensuring final product quality” [11]. This definition (and relation with QbD) has been debated and discussed in many venues (e.g., conferences, social media, articles) [12,13]. In these enthusiastic discussions, one point that is frequently overlooked is that PAT tools are firmly embedded in the pharmaceutical workflows that underpin development and scale-up, for both drug substance and dosage forms [14-17].
In-situ analytics offers the potential for greater (and faster) understanding of the process as compared to traditional off-line analyses (a caveat being that not all processes are readily amenable or require real time assessments). Development of chemometric models for quantitative analyses are seldom required during process development (as processes are still being developed, the need for control methods are premature), and the speed of data analysis (to allow impact to the next set of experiments) is often more important. The ability to monitor in-situ and in near real time is invaluable during product development. For example, the following detailed objectives are frequently requested:
- When does a product form and at what rate?
- When does a reactant disappear?
- Does the reaction proceed via a reactive intermediate?
- When does crystallization start and what factors control rates?
- What polymorphic form(s) occur during processing?
- How does the homogeneity of a blend change with time?
- When does wet granulation reach an end point?
- How does the tablet potency change during a run?
PAT tools are routinely applied to develop a greater understanding of the process design space under a Quality-by-Design (QbD) framework. The use of PAT tools helps enable the development of robust processes, processes that are well-understood, with process set points that are controlled within design regions that are well-away from the edges of failure. As “quality cannot be tested into a product; it should be built-in or should be by design” [11], well-designed and controlled processes may not require routine analytical measurements and feedback control during the manufacture. A PAT tool that measures a critical quality attribute (CQA) may be implemented commercially for process control, however there are business drivers and regulatory aspects that will contribute to a final control strategy.
Pat Tool Boxes
Many on-line tools are routinely applied to monitor, measure or control processes. Commonly used PAT tools that are well-integrated and routinely used in manufacturing include thermocouples and pressure sensors. Spectroscopic tools (near infrared [18-21], mid infrared [22,23], Raman [24-27]) are utilized due to the specificity gained by the presence of functional groups routinely found in raw materials, intermediates and drug substances that are often not part of the matrix (e.g., solvents, excipients). This specificity can allow for qualitative trending or the quantitative determination of the component(s) of interest. With the use of probes to connect the spectrometer to the process, the process can be evaluated in real time. An added benefit is the reduced chance of exposure due to manual sampling. Figure 1 shows popular tools that have been routinely applied to API processes.

With the advent of handheld/portable spectrometers, the identity of raw materials can be confi rmed on the loading dock, often without opening liners (minimization of exposure hazards). Many tools are routinely applied to develop and understand the synthetic route. The choice of tool will be dependent upon the type of information required, timeframe of analysis, reaction matrix and chemical reactivity of the analytes of interest. Typical information desired will include rate of product formation (or reactant loss) and formation of impurities (from side reactions or chemical degradation). Measurements performed during isolation will include solvent levels, particle size/shape and polymorphic form. The resultant material may be milled if the particle characteristics are not appropriate for downstream processing. The finished API is subsequently put into a dosage form manufacturing process. Figure 2 shows popular tools that have been routinely applied to solid oral dosage form processes. Analogous to the first step of the API process, the first step is to confirm the identity of the ingoing dosage form materials (excipients and API). An added aspect of the dosage form identity test is an assessment of physical properties (e.g., particle size). NIR is often used to confirm chemical identity and physical properties. The tableting process is made up of a series of blending/ mixing/lubrication steps followed by compression and film coating. In the early process steps, the homogeneity of the mixture is most important, and NIR is often used to determine homogeneity. During granulation steps, evaluation of polymorphic form change and wet granulation end point are commonly tested. Once the tablets are compacted, potency assessments are made of the finished product, and NIR and Raman are the most often employed spectroscopic tools. The types of coating measurements are dependent upon the film coat type, functional or elegance. Film coatings can be assessed for weight gain, or spectroscopic tools (e.g., terahertz, chemical imaging) can be used to determine thickness.
Although the concepts, tools and approaches are similar, the (scientific and business) drivers for using PAT tools in development can differ from those in a commercial setting. The vast majority of PAT tools and “real time or in-situ” applications support the development and understanding of processes in a lab-based environment (or in pilot facilities), with few transferring as quantitative measurements and feedback controls into the production plant. Figure 3 represents this graphically as a PAT pyramid, with the PAT base and foundation set by in-situ analytics for the development of a process. One can also compare this to a PAT iceberg, where the visible PAT activities undervalue the vast base that underwrites the knowledge and understanding.
API Pat examples
Raman and mid infrared (MIR) spectroscopy are complementary techniques. Both have found widespread use in the development and scale-up of API. Figure 4 shows the reaction of a thiol dosed into a bromobenzene compound. Raman was chosen for this reaction, as there is a strong band at 292cm-1 (CBr vibration). Monitoring at 292cm-1 will show the debromination of reactant (1) as it is consumed (either degraded or reacted) to form product (3). The S-H band can also be monitored by Raman during this reaction. By monitoring at 2582cm-1, the addition of reactant (2) can be monitored followed by its consumption. In this case, following the consumption of both raw materials, the endpoint can be determined and adjusted during process refinement. The Raman trend tells the chemist the reaction is dose controlled, and rapid. The entire reaction takes approximately 5 minutes from reactant (2) addition to reaction completion.

Figure 5 shows the trend plot for a continuous reaction forming an oxazole using MIR. The formation of the product is observed at 1570 cm-1. In this reaction, off-line HPLC is used to confirm the MIR results. From the trend plot, steady state is achieved around 70 percent yield. One benefit of continuous processing is the ability to rapidly change and evaluate the impact of process parameters on quality attributes. In this case, a subsequent change in the process parameters resulted in a decreased yield. The yield is just one quality measurement, and the impact will be determined in combination with other measurements, for instance purity data, and the purgability of the resultant impurities.

Drug Product Blend Monitoring
The spectral homogeneity of blends can be easily monitored using near infrared (NIR) spectroscopy [28,29]. (Note: spectral homogeneity is defined as when changes in the blend composition are less than what can be detected by the instrument and measurements are no longer changing, e.g., system steady state/ equilibrium is achieved). Figure 6 shows the trend plot for API level in three blends. Note that the level of the API rapidly comes to steady state (spectral homogeneity) for all blends within approximately 75 blender rotations. With the NIR spectrometer, other components can generally be monitored as well. Although the uniformity of the blend is critical for a quality dosage form, blending is seldom a quality concern requiring the routine use of an on-line tool. The use of PAT is useful for fault detection and identification of root causes if manufacturing issues occur.
Drug Product Content Uniformity (Cu)
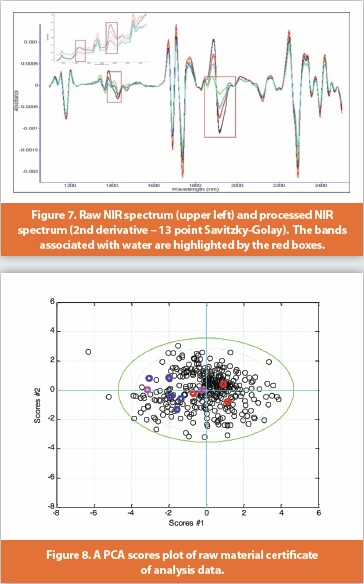
NIR is used for dosage form potency assessments (content uniformity testing) [30,31] and Raman is also finding use [32,33]. The samples can be evaluated by qualitative trending, or a quantitative determination can be made. As NIR is sensitive to both chemical and physical properties of the material, appropriate variance must be built into the model prior to use, and diagnostics used to ensure the test material falls within the model. Calibrator tablets are generated for the purpose of systematically adding the variance to the model [34]. Typical sources of variance will include API percentage, hardness, weight, water content, and excipient source (Figure 8).

The manufacture of calibrator tablets is not generally performed until the formulation and manufacturing process is set, and qualitative trending is often sufficient in developing and understanding the process (quantitative data can be generated using other analytical techniques).
Water Content
NIR has very good specificity for water, and has found widespread use for this analysis [35-37]. If technically feasible, the same spectra used to confirm tablet identify can be re-purposed for the determination of water content and also tablet potency. The ability to rapidly test for tablet identity, potency and water content has contributed to real time release testing (RTRt). Figure 7 shows the NIR spectra (raw and processed) for a drug product. The red boxes show the spectral regions for the water bands. Each spectrum was taken through a (glass) vial to minimize staff exposure to the material and to reduce environmental impacts to the sample water level. The data can be used for trending the water content in each vial, or with the creation of a calibration curve developed using a reference method (e.g., Karl Fischer), quantitative data for each vial. This type of non-destructive testing has significant advantages over destructive methods as the materials can subsequently be evaluated by other analytical methods. Consequently, this allows a 1:1 correlation of water data with another attribute (for instance purity). If the material stability is related to moisture content, the contents of an environmentally compromised container could be identified by NIR (results a high water content) and visually inspected prior to performing any additional testing (fault detection).
Feed Forward Controllers
Raw material variability can be a significant factor to product variability in the absence process adjustments to account for this variable input [38]. The use of feed forward controllers can allow for the adjustment of the process within the design space to compensate for (or reduce the impact of ) the raw material variability on the final quality attributes of the product. This can be done prior to the initiation of the process (which differs from feedback controllers which modify process conditions based upon observations (measurements) during the process). In the course of the development of the process, the impact of the raw materials can be assessed along with the process understanding DoE studies to achieve a correlation between the raw material attributes, process parameters and product quality attributes [39,40]. Figure 8 shows an example of a Principal Component Analysis (PCA) scores plot of raw material certificate of analysis data.
This PCA can be used to select material lots with differing properties for inclusion into DoE studies. Via development of simulators, process parameters can subsequently be simulated to minimize the resultant product variability prior to initiating the manufacture. This approach can be utilized to reduce lot to lot product variability without the incorporation of in-situ analytics during the manufacture.
Conclusions
PAT tools (e.g., in-situ analytics and modeling) are well-established and are habitually used within the pharmaceutical community in the development, understanding and optimization of rugged processes (at various scales). With the understanding gained, in laboratory-based and pilot settings, via a QbD framework, sufficient understanding around process design space will facilitate the development of the control strategy. A PAT tool that measures a critical quality attribute (CQA) may be implemented commercially for process control; however there are business drivers and regulatory aspects that will contribute to the final control strategy.
References
1. International Conference on Harmonization (ICH) Q8(R2): Pharmaceutical Development. Aug 2009.
2. International Conference on Harmonization (ICH) Q9: Quality Risk Management, Nov 2005.
3. International Conference on Harmonization (ICH) Q11: Development and Manufacture of Drug Substances Draft Guideline, May 2011.
4. Phil Borman, Phil Nethercote, Marion Chatfield, Duncan Thompson, Keith Truman, The Application of Quality by Design to Analytical Methods, Pharmaceutical Technology 31, 142 (2007)
5. Mark Schweitzer, Matthias Pohl, Melissa Hanna-Brown, Phil Nethercote, Phil Borman, Gordon Hansen, Kevin Smith, Jaqueline Larew, Implications and Opportunities of Applying QbD Principles to Analytical Measurements, Pharm. Tech. 34 (2) 52 (2010)
6. Frederick C Vogt, Alireza S Kord, Development of Quality-by-Design Analytical Methods, J. Pharm. Sci. 100, 797-812 (2011)
7. Devesh A. Bhatt, Smita I. Rane, QbD Approach to Analytical RP-HPLC Method Development and its Validation, Int. J. Pharm. and Pharm. Sci. 3(1), 179-187 (2011)
8. Timothy W. Graul, Kimber L. Barnett, Simon J. Bale, Imogen Gill, Melissa Hanna-Brown, Chapter 29: Quality by Design for Analytical Methods, D.J. am Ende (Ed.), Chemical Engineers in the Pharmaceutical Industry: R&D to Manufacturing, John Wiley & Sons, New York (2011) 545-562
9. S. Karmarkar, R. Garber, Y. Genchanok, S. George, X. Yang, R. Hammond, Quality by Design (QbD) Based Development of a Stability Indicating HPLC Method for Drug and Impurities, J. Chrom. Sci. 49, 439-446 (2011)
10. Kate Monks, Hans-Jürgen Rieger, Imre Molnár, Expanding the term “Design Space” in high performance liquid chromatography (1), J. Pharm. Biomed. Anal. 56(5), 874- 879 (2011)
11. Food and Drug Administration (FDA) Guidance for Industry: PAT — A Framework for Innovative Pharmaceutical Development, Manufacturing, and Quality Assurance, Rockville, MD, Sept 2004
12. Rich Merritt, PAT looms over Pharma, Control June 30-38 (2009)
13. Ali Afnan, Real-Time Release: It’s Time for Action, Not Debate, Pharma QbD Expert Insights, Posted on 22 February 2011 (http://www.pharmaqbd.com/afnan_real_ time_release_time_for_action/).
14. Darryl J. Ertl, Susan E. Barnes, Bob E. Cooley, Charles A. Goss, Application 0of PAT to API Synthesis from R&D to Manufacturing, Amer. Pharm. Rev., May/June 66-72 (2009)
15. Claudia C. Corredor, Dimuthu Jayawickrama, Gary McGeorge, Doug Both, Monitoring Blend Uniformity Form Conversion and Fluid Bed Drying by Near Infrared and Raman Spectroscopy, , Amer. Pharm. Rev., January/February 66-72 (2010)
16. Saly Romero-Torres, Rina Chokshi, Jun Huang, Mahesh Krishnan, Concomitant Use of Near-Infrared Chemical Imaging and Raman Spectroscopy during Selection of a Solid Dosage Manufacturing Platform, Amer. Pharm. Rev. November/December 10- 17 (2011)
17. Frederick G. Vogt, A Multi-Disciplinary Approach to the Solid-State Analysis of Pharmaceuticals, Amer. Pharm. Rev. 11, 50-57 (2008)
18. Bradley Diehl, Bronwyn Grout, NIR Spectroscopy - Just One of Many Analytical Tools for PAT, Amer. Pharm. Rev. 3, 70-74 (2011)
19. Howard W. Ward II, Sonja S. Sekulic, Michael J. Wheeler, Geraldine Taber, Frank J. Urbanski, Frank E. Sistare, Timothy Norris, Paul K. Aldridge, On-Line Determination of Reaction Completion in a Closed-Loop Hydrogenator Using NIR Spectroscopy, Appl. Spec. 52(1), 17-21 (1998)
20. Matt Santangelo, Brent Maranzano, Ken Norris, Tim McDermott, Near Infrared (NIR) Determination of Uniformity for a Drug Product Powder for Oral Suspension (POS) in Amber Glass Bottles, Amer. Pharm. Rev. July/August, 68-72 (2010)
21. Mark Bell, NIR as an In-Process Tool, Amer. Pharm. Rev. 11(3), 75-79 (2008)
22. Frederick T. Mattrey, Sarah Dolman, Jason Nyrop, Peter J. Skrdla, On-line FTIR Monitoring and Simultaneous Optimization of a Strecker Reaction Performed in a Laboratory Scale Flow-Through Reactor, Amer. Pharm. Rev. 14(7) (2011)
23. Shelly Li, Application of On;ine Reaction Monitoring by Raman and Infrared Spectroscopy in Early Development, Amer. Pharm. Rev. March, 62-67 (2010)
24. Anders Sparen, Jonas Johansson, Olof Svensson, Staffan Folestad, Mike Claybourn, Transmission Raman Spectroscopy for Quantitative Analysis of Pharmaceutical Solids, Amer. Pharm. Rev. January/February, 62-73 (2009)
25. Yong Zhou, Nicole Crane, Chunsheng Cai, Yanxi Tan Cain, Model for Raman Spectroscopic Monitoring of Process-Induced Pseudomorph Interconversion, Amer. Pharm. Rev. May/ June, 56-64 (2009)
26. Joanny Salvas, Jean-Sebastien Simard, Nicolas Abatzoglou, Raman Spectroscopy to Analyze Intact Pharmaceutical Tablets: Factors Influencing MVPM based PAT Methods, Amer. Pharm. Rev. April, 46-53 (2010)
27. Yong Zhou, Rebecca LoBello, Chunsheng Cai, Nicole Crane, Faiza Poshni, William W. Porter, Yanxi Tan Cain, Measurement of an Amorphous Form in a Pharmaceutical Drug Product using FT-Raman Spectroscopy, Amer. Pharm. Rev. July/August, 34-41 (2010)
28. Sonja S. Sekulic, Howard W. Ward II, Daniel R. Brannegan, Elizabeth D. Stanley, Christine L. Evans, Steven T. Sciavolino, Perry Hailey, Paul K. Aldridge, On-Line Monitoring of Powder Blend Homogeneity by Near-Infrared Spectroscopy, Anal. Chem., 68(3), 509- 513, (1996).
29. Benoît Igne, Brian M. Zacour, Zhenqi Shi, Sameer Talwar, Carl A. Anderson, James K. Drennen III, Online Monitoring of Pharmaceutical Materials Using Multiple NIR Sensors—Part I: Blend Homogeneity, J. Pharm. Innov. 6(1), 47-59 (2011)
30. Robert P. Cogdill, Carl A. Anderson, James K. Drennen III, Using NIR Spectroscopy as an Integrated PAT Tool, Spectroscopy 19(12), 104-109 (2004)
31. Manel Alcala, Joshua Leo, Jorge Ropero, Marcelo Blanco, Rodolfo J. Romanach, Analysis of low content drug tablets by transmission near infrared spectroscopy: selection of calibration ranges according to multivariate detection and quantitation limits of PLS models, J. Pharm. Sci. 97, 5318–5327 (2008)
32. J. Johansson, A. Sparen, O. Svensson, S. Folestad, M. Claybourn, Quantitative transmission Raman spectroscopy of pharmaceutical tablets and capsules, Appl. Spec. 61, 1211-1218 (2007)
33. Charlotte Eliasson, Neil A. Macleod, Linda C. Jayes, Fiona C. Clarke, Stephen V. Hammond, Mark R. Smith, Pavel Matousek, Non-invasive quantitative assessment of the content of pharmaceutical capsules using transmission Raman spectroscopy, J. Pharm. and Biomed. Anal. 47(2), 221-229 (2008)
34. Marcel Blanco, Manel Bautista, Manel Alcala, Preparing Calibration Sets for Use in Pharmaceutical Analysis by NIR Spectroscopy, J. Pharm. Sci. 97(3) 1236-1245 (2008)
35. George X. Zhou, Zhihong Ge, Jason Dorwart, Bill Izzo, Joseph Kukura, Gary Bicker, Jean Wyvratt, Determination and Differention of Surface and Bound Water in Drug Substances by Near Infrared Spectroscopy, J. Pharm Sci 92(5) 1058-1065 (2003)
36. Claudia C. Corredor, Dongsheng Bu, Douglas Both, Comparison of near infrared and microwave resonance sensors for at-line moisture determination in powders and tablets, Analytica Chimica Acta 696, 84–93 (2011)
37. Howard W. Ward, Frank E. Sistare, On-line determination and control of the water content in a continuous conversion reactor using NIR spectroscopy, Anal. Chim. Acta. 595(1-2), 319-22 (2007)
38. John F. MacGregor, Mark J. Bruwer. Framework for the development of design and control spaces. J. Pharm. Innov. 3,15–22 (2008)
39. Koji Muteki, Vidya Swaminathan, Sonja S. Sekulic, George L. Reid. De-risking Pharmaceutical Tablet Manufacture Through Process Understanding, Latent Variable Modeling, and Optimization Technologies, AAPS PharmSci Tech, 12(4), 1324-1334 (2011)
40. Koji Muteki, Ken Yamamoto, George L. Reid, Mahesh Krishnan. De-risking Scale-up of a High Shear Wet Granulation Process Using Latent Variable Modeling and Near Infrared Spectroscopy, J. Pharm. Innov., 6(3), 142-156 (2011)
Authors Biographies
George Reid, Ph.D., is a Research Fellow in the Quality-by-Design Method Development group at Pfizer Worldwide Research and Development in Analytical Research and Development. In this role, he has responsibilities in the area of separation science, spectroscopy and process modeling/understanding.
George obtained his Ph.D. in Analytical Chemistry from the University of Missouri - Rolla under Professor Daniel Armstrong and his B.S. in biochemistry at Beloit College.
Howard W. Ward II is a Principal Scientist in the Development Analytics API group at Pfizer Worldwide Research and Development in Analytical Research and Development. In this role, he has responsibilities in the area of spectroscopy/PAT to aid in process understanding and control during both API route selection and scale up. Will has extensive experience in PAT for API and drug product, spectroscopy (NIR, MIR, Raman, UV-Vis), chemometrics and automation.
Will obtained his B.S. in Chemical Engineering from the University of New Haven.
Andrew Palm is a Scientist in the Development Analytics API group at Pfizer Worldwide Research and Development in Analytical Research and Development. In this role, he has responsibilities in the area of spectroscopy/PAT to aid in process understanding and control during both API route selection and scale up. Andy has experience in spectroscopic method development (MIR, Raman), particulate analysis and PAT for API. Andy obtained his B.S. in Chemistry from the University of Delaware.
Koji Muteki, Ph.D., is a Principal Scientist in the Quality-by-Design Method Development group at Pfizer Worldwide Research and Development in Analytical Research and Development. He received his Ph.D. in Chemical Engineering in 2006 from the McMaster University (Ontario, Canada) with Professor John. F. MacGregor. His interests include QbD, PAT, Chemometrics, Scale-up, Process Optimization and Advanced Process Control.