Introduction
Since the discovery of inelastic (Raman) scattering nearly 90 years ago, Raman spectroscopy has become well-established as a powerful analytical method for various applications, including biochemical research. A Raman spectrum is a molecular vibrational signature of a (bio)chemical system, which offers information about structure and chemical composition. Recent advances in optical and spectroscopic technologies, computing power and digital methods have resulted in tremendous progress in Raman spectroscopy, providing effective solutions to such common issues as luminescence interference and low sensitivity, which limited its application at the early stages of method development. Numerous applications of Raman spectroscopy to chemistry, physics, biology, medicine, pharmaceutical studies, forensic science, nanoscience, mineralogy, etc. have been recently reported.
With new, fast Raman spectral imaging modules, the acquisition time for a single spectrum can be as low as 5 microseconds per point, resulting in many thousands of Raman spectra within a few minutes of experimental work. The latter increases the potential role of statistical analysis for retrieving valuable information from massive spectral datasets. Numerous statistical methods have been developed and applied to Raman spectroscopic data to extract hidden information about the structure, composition and evolution of biochemical systems. The main goal of this article is to provide a brief review of selected statistical methods developed and tested in our laboratory for spectroscopic data analysis in biomedical research and forensic applications. Specifically, the application of two-dimensional correlation Raman spectroscopy for probing the kinetic mechanism of amyloid fibrillation will be discussed. Additionally, we will describe a new concept involving multidimensional Raman spectroscopic signatures, which accounts for intrinsic sample heterogeneity and variations between donors. This approach has a significant potential for characterizing various (bio)chemical systems that are intrinsically heterogeneous and could exhibit certain allowed variations from sample to sample.
Fibrillation Mechanism of a Model Intrinsically Disordered Protein Revealed by 2D Correlation Deep UV Resonance Raman Spectroscopy
Intrinsically disordered proteins (IDPs) are a class of proteins without well-defined structures in their native (functional) state. More than 25% of eukaryotic proteins are predicted to be disordered [1], and distinct disordered segments can be found in more than 50% of eukaryotic proteins and 70% of proteins involved in signal transduction [2]. The structural flexibility of IDPs makes it possible to overcome steric restrictions and enables binding to different structural targets [3]. However, the great conformability of IDPs exposes them to accidental misfolding and aggregation. As a result, numerous human diseases, such as neurodegenerative disorders and certain types of cancer, are associated with IDPs [4-7]. Transitions of α-synuclein, amyloid β-peptide, tau-protein, prion protein, atrial natriuretic factor or islet amyloid polypeptide, to name but a few, from native functional forms into acquired insoluble forms (amyloid fibrils) are associated with pathological evidence of Parkinson’s disease, Alzheimer’s disease, spongiform encephalopathies, atrial amyloidosis, and type II diabetes [4-7].
Our goal was to facilitate greater insight into the mechanism of initiation of IDPs’ fibrillation [8]. De novo, genetically engineered polypeptide GH6[(GA)3GY(GA)3GE]8GAH6 (YE8) was used as a model of IDP [9]. YE8 is an intrinsically disordered polypeptide exhibiting all the properties of a typical fi brillogenic protein [10-13]. The design and synthesis of YE8 have been described elsewhere [10-12]. The fibrillation of a 44 μM solution of YE8 performed at pH 3.5 and room temperature was monitored by deep UV (197-nm laser) Raman spectroscopy [14]. Deep UV resonance Raman (DUVRR) spectroscopy combined with two-dimensional correlation spectroscopy (2DCoS) was used to elucidate the sequence of events that happened at earlier stages of IDP fibrillation. 2DCoS [15] facilitates the correct assignment of vibrational bands to protein and peptide structural motifs and the monitoring of their evolution with time. As an example, a 2DCoS analysis of Raman spectra revealed preceding changes in the aromatic amino acid environment (Figure 1).
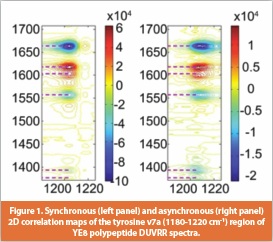
The same sign of corresponding synchronous and asynchronous correlation features (labeled by dashed lines) indicate that changes at the CαH (1393 cm-1), Amide II (1558 cm-1) and Amide I (1664 cm-1) bands occurred with a certain delay [15] relative to the change at the tyrosine ν7a (1208 cm-1 on the x-axis) Raman band (reference #6 provides detailed explanations of 2D correlation maps and rules used for the sequential order of events determination). A similar treatment performed for the extended 1220-1700 cm-1 spectral region allowed us to reestablish the kinetic mechanism of IDP fibrillation. It was demonstrated that the very first step of the fibrillation process involves global structural rearrangements of YE8 manifested by changes in the tyrosine local environment, with no detectable appearance of secondary structural elements. Formation of β-sheets followed the global structural changes and proceeded via a simultaneous formation of turns and β-strands. The described mechanism affords new insights into the general mechanism of IDP fibrillation [7].
Multidimensional Raman Spectroscopic Signatures as a Tool for Forensic Identification of Body Fluid Traces
Many biochemical studies address inherently heterogeneous systems, such as biological tissues, fluids, cell cultures and pharmaceutical forms. Different spectroscopic (FTIR, Raman, fluorescence, etc.) imaging methods facilitate quantitative and qualitative characterization of these objects, providing massive amounts of topographic and chemical information [16, 17]. One of the most important challenges facing modern analysts is distinguishing between different types of heterogeneous samples, as in the case of biological species differentiation [18], counterfeit drug detection [19] and forensic evidence differentiation [20]. For the last several years, our laboratory interest has centered on the forensic identification of human body fluids [20]. We have pioneered a multidimensional Raman spectroscopic signature approach [20].
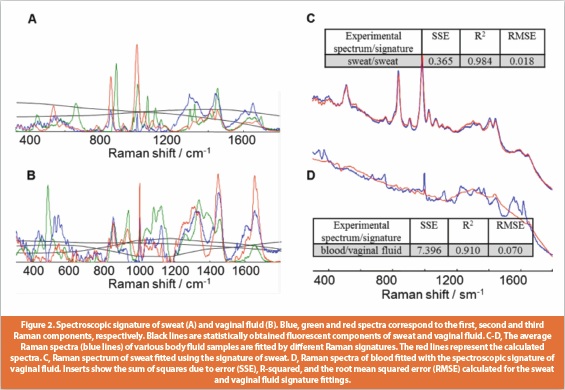
Standard spectroscopic methods used for the identification of unknown samples are usually based on the use of characteristic bands or comparison of the experimental spectrum, as a whole, with reference spectra. Application of these methods can be significantly affected by the high variability of spectroscopic data. The concept of a multidimensional spectroscopic signature, a set of several characteristic spectra that represent the most important and characteristic spectral variations of the object under study, was introduced to overcome these complications. Each experimental spectrum can be presented as a linear combination of these characteristic components, or, in other words, as a point in multidimensional space with coordinates that are proportional to the coefficients (contributions) of the linear equation. The individual spectral components for blood, semen, saliva, sweat and vaginal fluid were calculated by the alternate least squares (ALS) algorithm. Examples of multidimensional signatures for sweat and vaginal fluid calculated for NIR excitation (785 nm) can be observed in Figures 2.A-B. Significant factor analysis (SFA) was utilized to determine the number of components required for characterizing a particular body fluid. The identification of an unknown object consists of searching for the best match between the available predefined sets of spectra (signatures) and the experimental data. The sum of squares due to error (SSE), the coefficient of determination (R2), and the root mean squared error (RMSE) were successfully tested as statistical criteria for “the best fit” (Figures 2.C-D).
The SSE and RMSE values will be closer to 0 and R-squared will be closer to 1 if the signature corresponds to a body fluid. Figure 2 demonstrates two characteristic examples of Raman signature fitting. The upper pair of spectra (Figure 2.C) shows fitting using the correct signature, whereas the lower pair of spectra (Figure 2.D) is the case showing inconsistency between the body fluid and the signature.
The concept of multidimensional signatures, specifically developed for the characterization of dried body fluid stains, has the potential for various practical applications, including quality control of pharmaceutical preparations, food production and novel nanomaterials for different stages of production and storage. Another important application is disease diagnostics and the monitoring of biological tissue development in which the targeted systems are intrinsically heterogeneous and could vary within a certain allowed range.
Conclusions
This article discusses the application of Raman spectroscopy combined with advanced statistical methods for characterizing complex (bio) chemical systems, which exhibit significant heterogeneity and variations from sample to sample. As an example, the mechanism of YE8 polypeptide fibrillation, a complex dynamic system, was studied using 2-D correlation Raman spectroscopy. The evolution of secondary structure motifs with time was examined, and key stages of fibrillation, including the initiation process, were exposed. The application of multidimensional Raman spectroscopic signatures was proposed for the characterization and identification of complex (heterogeneous) nondynamic systems. The approach was successfully tested for forensic identification of body fluid stains. Blood, semen, saliva, sweat and vaginal fluid stains were extensively analyzed using NIR and Raman spectroscopy. The developed multidimensional signatures account for both the intrinsic heterogeneity of body fluid stains and variations between donors.
Acknowledgement
This work was supported by Award No. R01AG033719 from National Institute on Aging, National Institutes of Health and Award No. 2011-DN-BX-K551 from the National Institute of Justice, Office of Justice Programs, U.S. Department of Justice. The opinions, findings, and conclusions or recommendations expressed in this publication are those of the authors and do not necessarily reflect those of the National Institutes of Health and the Department of Justice.
References
1. C.J. Oldfield, Y. Cheng, M.S. Cortese, C.J. Brown, V.N. Uversky, and A.K. Dunker, Comparing and combining predictors of mostly disordered proteins. Biochemistry, 2005. 44(6): p. 1989-2000.
2. L.M. Iakoucheva, C.J. Brown, J.D. Lawson, Z. Obradovic, and A.K. Dunker, Intrinsic disorder in cell-signaling and cancer-associated proteins. J Mol Biol, 2002. 323(3): p. 573-84.
3. V.N. Uversky and S. Longhi, eds. Instrumental analysis of intrinsically disordered proteins: assesing structure and conformation. The Whiley Series on Protein and Peptide Science, ed. V.N. Uversky2010, John Wiley & Sons, Inc.: Hoboken, NJ.
4. F. Chiti and C.M. Dobson, Protein misfolding, functional amyloid, and human disease. Annu Rev Biochem, 2006. 75: p. 333-66.
5. C.M. Dobson, Protein aggregation and its consequences for human disease. Protein Pept Lett, 2006. 13(3): p. 219-27.
6. V.N. Uversky, Intrinsic disorder in proteins associated with neurodegenerative diseases. Front Biosci, 2009. 14: p. 5188-238.
7. V.N. Uversky, C.J. Oldfield, and A.K. Dunker, Intrinsically disordered proteins in human diseases: introducing the D2 concept. Annu Rev Biophys, 2008. 37: p. 215-46.
8. V. Sikirzhytski, N.I. Topilina, G.A. Takor, S. Higashiya, J.T. Welch, V.N. Uversky, and I.K. Lednev, Fibrillation Mechanism of a Model Intrinsically Disordered Protein Revealed by 2D Correlation Deep UV Resonance Raman Spectroscopy. Biomacromolecules, 2012. 13(5): p. 1503-9.
9. N.I. Topilina, V.V. Ermolenkov, V. Sikirzhytski, S. Higashiya, I.K. Lednev, and J.T. Welch, A de novo designed 11 kDa polypeptide: model for amyloidogenic intrinsically disordered proteins. Biopolymers, 2010. 93(7): p. 607-18.
10. N.I. Topilina, V. Sikirzhytski, S. Higashiya, V.V. Ermolenkov, J.T. Welch, and I.K. Lednev, Genetically engineered polypeptides as a model of intrinsically disordered fibrillogenic proteins: deep UV resonance Raman spectroscopic study, in Instrumental analysis of intrinsically disordered proteins, V.N. Uversky and S. Longhi, Editors. 2010, John Wiley & Sons, Inc.: Hoboken, New Jersey. p. 253.
11. N.I. Topilina, V. Sikirzhytsky, S. Higashiya, V.V. Ermolenkov, I.K. Lednev, and J.T. Welch, Charge distribution and amyloid fibril formation: insights from genetically engineered model systems. Biomacromolecules, 2010. 11(7): p. 1721-6.
12. N.I. Topilina, V.V. Ermolenkov, S. Higashiya, J.T. Welch, and I.K. Lednev, Beta-sheet folding of 11-kDa fibrillogenic polypeptide is completely aggregation driven. Biopolymers, 2007. 86(4): p. 261-4.
13. I.K. Lednev, V.V. Ermolenkov, S. Higashiya, L.A. Popova, N.I. Topilina, and J.T. Welch, Reversible thermal denaturation of a 60-kDa genetically engineered beta-sheet polypeptide. Biophys J, 2006. 91(10): p. 3805-18.
14. I.K. Lednev, V.V. Ermolenkov, W. He, and M. Xu, Deep-UV Raman spectrometer tunable between 193 and 205 nm for structural characterization of proteins. Anal Bioanal Chem, 2005. 381(2): p. 431-7.
15. I. Noda and Y. Ozaki, Two-dimensional correlation spectroscopy - applications in vibrational and optical spectroscopy2004, Chichester: John Wiley and Sons. 310.
16. A.A. Gowen, C.P. O’Donnell, P.J. Cullen, and S.E. Bell, Recent applications of Chemical Imaging to pharmaceutical process monitoring and quality control. European journal of pharmaceutics and biopharmaceutics: official journal of Arbeitsgemeinschaft fur Pharmazeutische Verfahrenstechnik e.V, 2008. 69(1): p. 10-22.
17. C. Gendrin, Y. Roggo, and C. Collet, Pharmaceutical applications of vibrational chemical imaging and chemometrics: a review. J Pharm Biomed Anal, 2008. 48(3): p. 533-53.
18. K. Virkler and I.K. Lednev, Blood species identification for forensic purposes using Raman spectroscopy combined with advanced statistical analysis. Anal Chem, 2009. 81(18): p. 7773-7.
19. M.R. Witkowski and M.W. Carrabba, Examination of Counterfeit Pharmaceutical Labels, in Infrared and Raman Spectroscopy in Forensic Science, J.M. Chalmers, H.G.M. Edwards, and M.D. Hargreaves, Editors. 2012, John Wiley & Sons, Ltd: Chichester, UK. p. 573-582.
20. V. Sikirzhytski, A. Sikirzhytskaya, and I.K. Lednev, Multidimensional Raman spectroscopic signatures as a tool for forensic identification of body fluid traces: a review. Appl Spectrosc, 2011. 65(11): p. 1223-32.
Author Biographies
Dr. Igor K. Lednev is an associate professor at the University at Albany. His research is focused on the development and application of novel laser spectroscopy for biomedical research and forensic purposes. Dr. Lednev is an advisory member for the White House Subcommittee on Forensic Science.
Dr. Vitali Sikirzhytski is a postdoctoral fellow in Dr. Lednev’s lab. His work is related to spectroscopy, analytical methods, and chemometrics. He received an M.Sc. degree in biophysics at Belarusian State University and a Ph.D. Degree in chemistry