Introduction
Two common approaches to sample analysis exist in the pharmaceutical industry. Drug discovery organizations often employ open-access analysis, in which medicinal chemists submit their samples to automated analytical instrumentation and the analysis and reporting is performed automatically. The instrument is a shared resource used by multiple scientists. By contrast, pharmaceutical development organizations heavily favor custom analyses carried out by skilled analytical chemists using instruments dedicated to the exclusive use of a small number of analysts or projects. While NMR and LC-MS are frequently used as self-service, open-access instruments in both discovery and development, the vast majority of HPLC-UV analyses in development have not employed the open-access approach.
In this paper, we describe an open-access approach to HPLCUV non-GMP analysis in Chemical Development, the organization responsible for developing the final commercial route of synthesis and producing active pharmaceutical ingredient for use in safety assessment, stability, and clinical studies. A recent paper in this publication provides a lucid description of the kinds of problems encountered during this phase of development [1]. While expert analysts handle many challenging problems, about half of all chromatographic analyses (250,000 samples per year) are performed by process chemists and chemical engineers using open-access systems. This approach greatly increases the speed-to-answer for the decisions required to progress chemical syntheses. The approach is not new. Synthetic chemists have been running their own TLC, IR, and NMR analyses for decades. However, our implementation of this open-access approach is novel: using generic fast LC and custom analytical methods on more than 100 HPLC-UV instruments located across eight R&D sites. This collection of actively managed and supported open-access instruments is termed a Platform.
The open-access HPLCs employed in Chemical Development were modeled after the well-understood traits of an automated teller machine (ATM). The Platform LCs are easy to use, available outside normal business hours, and conveniently located. They function with the same look and feel in all countries, and transactions (in this case the data and meta-data) are stored, retrievable, and trendable. If a more complex analysis is required, experienced analytical staff provides this support. Finally, there is a dedicated team of technical experts who maintain the fleet and respond quickly with technical support when something breaks. All of these attributes of an ATM have been adapted to fast LC analysis in Chemical Development.
Motivation: Answers in Minutes, Not Days
It was recognized that the traditional sample submission approach to analyses was often an unnecessary bottleneck to decision-making. Routine samples that require a high, but not extreme, amount of separation performance can be analyzed directly by synthetic chemists or chemical engineers (the sample-generating scientists). Reaction monitoring, starting material purity, and analysis of process intermediates to understand the growth or reduction of impurities associated with variable process conditions are common examples of where this technology can be applied. Faster analysis is enabled by modern chromatographic methods that employ ever smaller particles to enable fast cycle times (e.g., sub-2 μm particles). Figure 1 illustrates how routine problems are solved using a Platform instrument.

Figure 1: open-access fast LC process. A chemist logs in a sample using the custom interface on the lab PC connected to the instrument, choosing a 3- or 8-minute gradient method. Chemist returns to other activities and the integrated chromatogram is accessible immediately after completion from either the lab or remote PC.
As shown in the figure, a chemist 1) logs in the sample(s) using a custom user-interface on a lab PC connected to the HPLC, choosing a 3- or 8-minute gradient method and placing the sample vial in the designated position and 2) receives the result in a few minutes, after sample queuing and method completion. The PC and instrument do the rest: automatic wakeup in the morning, system wash, system suitability blank and test mix injections, queue management, sample injection, chromatographic peak integration, monitoring of mobile phase volumes, storage of injection data for metrics, and transitions to daytime idle and shutdown at night to conserve solvents and energy. Additionally, a password-protected administration menu lets lead users configure, maintain and troubleshoot the instrument. Median queue times for instruments running the generic fast LC methods are less than 10 minutes, across each of 8 sites over a 12-month period, corresponding to 250,000 samples. Instrument use by 5 – 20 scientists (site-dependent) increases in the morning, then remains roughly continuous throughout the working day, with slightly fewer samples being submitted during lunch. The main point, as illustrated in Figure 2, is that the instruments are nearly always running back-to-back samples, with little idle time during the working day.
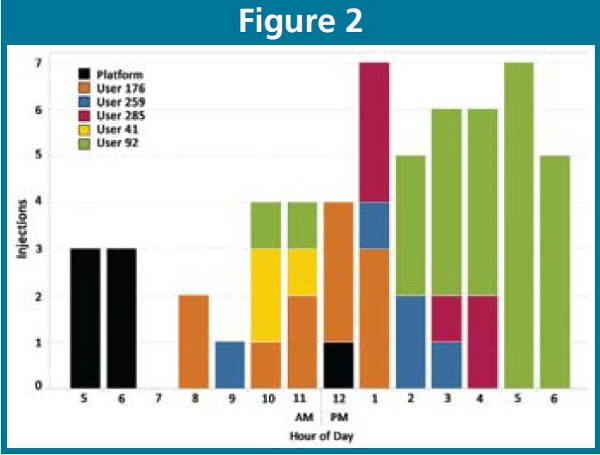
Figure 2: a high-usage day in the life of a fast LC. Starting at the 5 AM hour, the instrument automatically starts and makes three injections to assess system suitability (black bars). The first injections from User 176 start about 8 AM. On this day, five chemists submitted 50 samples; upon completion of the last sample the instrument automatically shut down.
To be clear, custom analysis by trained analysts remains a critical function. Shifting analysis of routine samples is not a zero sum game. It saves hours of the analyst’s time and takes less than a minute for a chemist to login a sample on a platform instrument. Figure 2, for example, depicts 50 samples from 5 chemists run on a single instrument in one day – samples that didn’t require custom analysis from multiple analysts.
Chromatographic Method Selection: A Pareto Approach
No technology or analytical method is a panacea and it’s not surprising that development organizations create a large number of different methods to address a variety of different problems. However, many analysis problems don’t require a new, custom method: they can be solved with just a few readily available generic analytical methods. This fact is a specific example of the Pareto principle: 80 % of analysis problems can be solved by 20 % of available analytical methods [2]. The open-access Platform instruments exploit this 80-20 rule-of-thumb and use two generic fast LC methods on approximately half of the (column-switchable) instruments. The 3-minute fast LC method uses a sub-2 μm particle, 50 x 3.0 mm, C18 column and employs a linear gradient at 1.5 mL/min and 60 °C using 0.05 % TFA in both aqueous and acetonitrile mobile phases. The 8-minute linear gradient method employs the same mobile phase and uses a 3 μm particle, 50 x 2.0 mm, C18 column held at 40 °C and flowing at 1.0 mL/min. Figure 3 shows a representative 3-minute test mix chromatogram that is automatically generated in the morning to assess system suitability before chemists arrive at work (one of the six injections referenced in Figure 2).
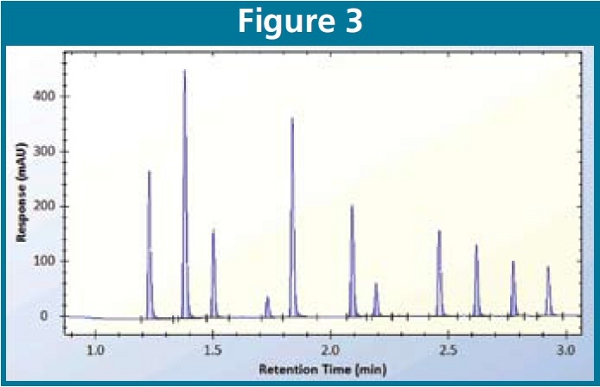
Figure 3: Test mix chromatogram automatically injected each morning used to assess system suitability. Key chromatographic features are correlated with known instrument failure modes: check valve, lamp, leaks, etc.
These two generic fast LC methods described above constitute the majority of injections made on the Platform. The remaining HPLC instruments allow for a second-tier of different generic methods, employing different or complementary separation mechanisms: for example, core-shell particles for higher efficiency [3], perchloric acid for ion-pairing [4], high pH, normal phase, HILIC [5], or chiral methods. Additionally, custom project-specific methods developed by an analyst may also be employed in open-access mode if the generic methods don’t work and if there is sufficient project demand. Finally, a low-thermal mass (LTM) GC-FID instrument configuration [6] supports open-access analysis for monitoring solvent impurities, solvent ratios, and starting materials and intermediates without chromophores (i.e., samples not amenable to HPLC-UV analysis). The LTM technology enables rapid analysis: e.g., a 10-minute cycle time for analysis of 22 common process solvents.
Having a suite of choices always available is efficient because scientists simply start with the generic fast LC methods and if these top-tier methods don’t work, they can simply “walk the sample” to instruments running second-tier generic or custom methods. This is fast, empirical problem solving with a high likelihood of success before seeking custom analysis from the analyst.
Making it Scale Globally: Automation, Informatics and Hands-On Support
The primary objective of any open-access analysis model is to maximize instrument uptime and provide high quality data with minimal resource needed to achieve these objectives. Meeting these objectives for one or two open-access instruments is decidedly different than managing more than 100 instruments across eight sites. In addition to the sheer number of instruments, additional complexity arises from the need to get the same chromatography on any instrument in the Platform. Our chemistry operations cross labs and sites: a chemist visiting a site in Ireland working on a pilot plant campaign must get the same chromatographic behavior as that obtained at home in the United States. It is unacceptable to have large shifts in retention times, changes in resolution, or differences in signal-to-noise. This requirement necessitates active management of all instruments as a single collection and use of lean sigma principles to minimize variance [7].
This active management of instruments started four years ago. At that time 40 generic fast LC instruments across four sites were in operation. There was little standardization, as the open-access approach had spread organically throughout the organization. In the first year, nearly 800 failures globally were logged, causing significant instrument downtime and disruption in the lab. Analysis of the failure modes revealed that 70 % were computer-related; the remaining 30 % being related to actual instrument hardware (e.g., check valves, lamps, leaks, columns). There is now more than double the number of instruments across double the sites and we field less than 10 errors per month, approximately half of which are computer-related. This significant improvement came about due to a change in mindset. The chromatography was well understood; the computer and software was the challenge that needed to be addressed. In addition, beyond simply keeping the instruments running, we were becoming inundated with large amounts of unmanaged data because the data delivery mechanism was an email with a PDF report of the results sent only to the scientist who submitted the sample. Thus, shared data access and analysis became a second driver to find a computer solution to the problem of scale. Automation, informatics, and hands-on support are the three key areas that have made this approach scalable. Figure 4 below illustrates the solution developed.

Figure 4: Distributed architecture to enable sample submission, instrument control, and data access in the lab and remotely. Not shown is an automated data archiving application that copies data to a secure location every night.
A custom chromatography viewer developed in-house lets scientists connect to any instrument in the global Platform. Current results are readily available after analysis: scientists see their own sample results appear at the top of the list immediately after peak integration is completed. In addition to these current results, hundreds of thousands of older chromatograms obtained from all samples on all instruments are available. Finding relevant data takes a few seconds using filters to focus on results of interest. Scientists can quickly zoom in or out, overlay chromatograms, and exclude unwanted peaks from area-% results with one click. A dynamic charting tool supports reaction monitoring and other workflows that require trending. This feature has reduced hours of manual data transcription and charting (from emailed PDF reports into Excel) to minutes because the chart is built interactively as data is received from the instrument. Finally, data from each instrument is automatically archived overnight to a secure server.
Fast and easy data access and analysis is supported by a distributed client-server architecture in which each PC in the lab, connected directly to the HPLC stack, provides chromatographic data to the chromatography viewer client application. This means that colleagues can share and analyze data in a meeting room, in their office, in the lab, or at the local coffee shop over secure VPN. Simple, remote access to “all” the data eliminates hundreds of thousands of emails every year as well as lost data and data silos that inevitably result from emailing results to a single individual in a static PDF document.
Maintaining more than 100 computers connected directly to the HPLC might seem archaic and a management nightmare. The opposite has turned out to be true. With sufficient standards in place, the overhead has been very manageable and the benefits large. First, a direct connection to in-memory chromatograms on the lab PC provides fast, responsive data access globally. Second, single point-of-failure client-server systems that control many instruments remotely can bring down the whole fleet at once. This distributed approach means that if one computer goes down, the chemist can move to a different instrument and submit the sample, getting a valid result because the instruments are standardized. In the event of a network failure, samples continue to be run and submitted because the PC controlling the HPLC has a hardwired connection to the instrument and data access and analysis is still provided using the chromatography viewer installed on the same PC (although remote access is disrupted in the event of a network failure).
Responsive hands-on support from local lead users is the last critical piece needed to make this approach work. When an instrument goes down, the lead users hear about it almost instantly and it becomes a high priority to fix it. Dedicated site-based lead users who meet regularly to share ideas and solutions has spread knowledge throughout the organization and led to “best practices” and fast troubleshooting. The same look-and-feel of all Platform instruments also facilitates uptake by both users and lead users – like the ATM analogy, learning to use or troubleshoot one instrument is the same as knowing how to use or troubleshoot all of them. In some situations, web-based video demonstrations and detailed training documentation has proven useful. Finally, strong management support of both lead users and the Platform team is crucial.
Benefits and Challenges of Managing Instruments as a Single Collection
Sharing instruments and maximizing their use is a fiscally responsible use of a large capital investment. Managing them as a single collection also facilitates data-driven asset management by considering instrument age, maintenance history, and utilization metrics across different labs and sites. How many HPLCs do we need? Which ones should we retire? Where would we place new ones if we purchased them? A holistic, managed approach provides answers to all of these questions.
Additionally, funneling instrument failures and fixes through a single point in the organization enables trends to be identified: failure modes that would otherwise go unnoticed are easily identified. For example, a Platform lead user was reviewing test mixes and noticed that a test mix on a pilot plant system at a different site had a late onset of the gradient, which is strongly correlated with a slow leak in the acetonitrile side of the binary pump. Once notified, the lead user at the pilot plant was able to detect and fix the system. Knowledge such as this is translated directly to all instruments in the Platform and when an HPLC is converted to a Platform instrument, it receives a “tune-up” that often improves its performance by adopting a proven set of standardized hardware, software, firmware, tubing, and consumables.
Finally, it’s worth noting that people are sometimes reluctant to try new ways of working. Change management is a fact in any organization. Furthermore, not all forms of automation are actually improvements. While we are strong advocates for this way of working, we have found that it’s best to let people “pull” rather than “push” a new technology into an organization. Piloting a new capability on just one instrument is a good way to see how it is received. The best ideas are usually extremely well received and spread naturally into the organization. If a new capability is rejected or a complaint received, it’s probably time for introspection and re-evaluation of the idea. Validation of a perceived improvement is best left to the “customer” – the synthetic chemists, chemical engineers, and analysts who stand to benefit from the technology.
Future Plans
The Platform ethos is to help our organization become more efficient by harnessing computers to do the boring, redundant work, thus freeing scientists’ time to solve more challenging problems. Toward that end, improvements are being developed to further reduce the effort needed to maintain the instruments. First, application updates to all instruments will be implemented automatically overnight (configuration management), enabling improvements to scale rapidly. New capabilities, improvements and fixes demonstrated on one or two instruments can be made available instantly on all instruments globally overnight. Second, we are investigating traditional system suitability criteria and pattern recognition algorithms to automatically classify chromatograms and pressure traces as good or bad, assigning a specific cause and action needed. Computer assignment of data quality means the instrument is completely autonomous and working properly unless the analyst is notified by email about a specific problem (e.g., faulty check valve on instrument R07, replace with part number 12345). Finally, to reduce “reinventing the wheel” during method development, in silico structure-property relationships [8] are being developed to identify existing in-house analytical methods that have a high likelihood of success.
Automation improvements like these will facilitate expansion of open-access analysis into other problem areas. Examples include the drug product side of the business: content uniformity, excipient compatibility, and prototype stability studies.
Acknowledgments
The authors would like to thank our Platform lead users and Michelle King and other colleagues in our IT Lab Support department for collaborating with lab PC standardization and support. We also appreciate strong support from Chemical Development management over the years, without which much of the work described here would not be possible.
References
- Wang, W., Chen, and Q., McCaffrey, J., Evaluation of UHPLC for In-Process Testing During Drug Substance Scale-Up and Manufacture. Am. Pharm. Rev., 2009, September/October: p. 68 – 72.
- Bicheno, J., The New Lean Toolbox, PICSIE Books, Buckingham, UK, 2004.
- Gritti, F., Leonardis, I., Shock, D., Stevenson, P., Shalliker, A., and Guiochon, G., Performance of columns packed with the new shell particles, Kinetex-C18, J. Chrom. A., 2010, 1217: p. 1589 – 1603.
- Roberts, J., Diaz, A., Fortin, D., Friedle, J., and Piper, S., Influence of the Hofmeister Series on the Retention of Amines in Reversed-Phase Liquid Chromatography. Anal. Chem., 2002, 74: p. 4927 – 4932.
- Hemström, P. and Irgum, K., Hydrophilic interaction chromatography. J. Sep. Sci., 2006, 29: p. 1784 – 1821.
- Luong, J., Gras, R., Mustacich, R., and Cortes, H. Low thermal mass gas chromatography: Principle and applications. J. Chrom. Sci., 2006, 44: p. 253 – 261.
- Womack, J.P., and Jones, D.T., Lean Thinking: Banish Waste and Create Wealth in your Corporation. Simon & Schuster UK Ltd, 2003.
- Poole, S.K., and Poole, C.F., Quantitative structureretention (property) relationships in micellar electrokinetic chromatography. J. Chrom. A., 2008, 1182: p. 1 – 24.
Dr. James M. Roberts is an Investigator in Analytical Sciences at GlaxoSmithKline. He works on Platforms and applies informatics, data integration, modeling, and automation to increase efficiency in analytical chemistry. He received a Ph.D. under the advisement of Professor Janet Osteryoung and has 12 years of experience in the pharmaceutical industry.
Dr. Steve R. Cole is Manager, Analytical Sciences, Chemical Development, at GlaxoSmithKline. He leads scientists who provide analytical deliverables for late-phase drug candidates and walk-up chromatography to > 250 chemists on 8 sites. He received his Ph.D. from Professor John Dorsey in 1992 and has 20 years experience in the pharmaceutical industry.
Jay Spadie is the President of MindGarden, Inc., a custom software development company. Collaborating with GlaxoSmithKline, he is responsible for the development of data visualization software, including the Chromatography viewer discussed in this article. Jay received a Bachelor degree in Chemistry and Math from Indiana University and a Master of Computer Science degree from North Carolina State University.
Helen E. Weston is a Principal Analytical Scientist at GlaxoSmithKline. She is responsible for ensuring consistency and quality of results for 56 instruments globally. She gained practical troubleshooting skills as a purification specialist in medicinal chemistry, developing new automated SPE equipment. She joined GSK after graduating in Chemistry from Oxford University.
Dr. William K. Young is an Investigator in Analytical Sciences at GlaxoSmithKline in Stevenage, UK. He develops and maintains the walk-up chromatography systems within Chemical Development. He received his Ph.D. from Imperial College, London with Professor W. John Albery and has 11 years experience in the pharmaceutical industry.
To correspond with author, please e-mail him directly at: james.m.roberts@gsk.com