The number of drugs imported into the US has more than doubled in the past decade [1], and globalization of the pharmaceutical supply chain appears to be increasing the risk that American pharmaceutical consumers will be exposed to drug products that have been contaminated, counterfeited or mislabeled [2]. Recent cases of adverse events suggest that economically motivated adulteration of pharmaceutical raw materials is on the rise [3-5]. In addition, some dietary supplements marketed as remedies for common medical problems have been found to contain undeclared synthetic active pharmaceutical ingredients (APIs) [6-9]. Surveillance testing is one important component of the FDA drug quality monitoring program. Globalization of the pharmaceutical supply chain is challenging the capacity of the current surveillance process, which involves issuing sampling assignments, collecting samples, sending samples to regional labs for analysis, and reporting results. Higher efficiencies can be achieved by screening imports at the port-of-entry in order to selectively sample and further test suspect materials in regional laboratories. Such a strategy would require methods of chemical analysis that are both rapid and sensitive in order to significantly increase the number of materials that can be screened. The CDER Division of Pharmaceutical Analysis (DPA), in collaboration with CDER Office of Compliance and the ORA Division of Field Sciences, has undertaken a collaborative study to determine the feasibility of using portable analytical instruments to screen pharmaceutical materials in the field. This article will review some of the challenges that we have encountered while developing procedures for field deployment of Raman, near infrared (NIR), x-ray fluorescence (XRF) and ion mobility (IM) spectrometers for pharmaceutical surveillance.
In the summer of 2008, the DPA embarked on a Critical Path project to evaluate rapid portable spectrometric instruments for surveillance of pharmaceutical materials. Portable instruments are becoming commonplace tools in the arsenal of instruments available for chemical analysis, and many types of portable and handheld spectrometric instruments are available from numerous vendors. The program described in this article was designed to determine the feasibility of using these instruments to dramatically increase the number of materials evaluated by the FDA surveillance program. To accomplish this goal, our analytical methods must meet four criteria: (1) they must be rapid, requiring little or no sample preparation, (2) they must have sensitivity and specificity suitable for screening the contaminant of interest at the expected concentration, (3) they must be user friendly and suitable for use by field scientists and inspectors who are not instrument specialists, and (4) they must be distributable, such that scientists can develop a method on a single “master” instrument, and then transfer that method with an appropriate calibration model to numerous instruments located at remote sites without the need to develop independent calibrations for each instrument.
For this feasibility study, we purchased 20 spectrometers: five Raman, five NIR, five XRF and five IM spectrometers. We then began to evaluate the applicability of these instruments for specific analyses. For our initial study we developed methods to analyze diethylene glycol (DEG) in glycerin by Raman spectroscopy, DEG in propylene glycol by NIR spectroscopy, undeclared weight loss drugs in dietary supplements by IM spectrometry, and toxic elements in pharmaceutical materials by XRF spectrometry. After suitable methods were developed, we sent the instruments to five different FDA field laboratories along with sample sets and protocols for a collaborative study whose purpose was to (1) determine the detection limits for each method including the effects of repeatability, intermediate precision and reproducibility [10], (2) evaluate the durability of the instruments as they were sent around the country and (3) assess potential problems associated with transferring the methods to the field. We encountered numerous instrument-specific challenges during method development, and some of these challenges and their solutions are discussed below.
NIR and Raman Spectroscopy
NIR and Raman spectra can typically be collected in less than 1 minute; therefore these methods have the potential to be rapid enough to satisfy our first criterion. These instruments are often designed to compare the measured spectrum with a spectral library for material identification, but we have found that library methods are not able to routinely indicate the presence of low level contaminants in pharmaceutical materials. (A more quantitative assessment of the sensitivity of library methods will be the subject of a future publication.) Thus we have implemented chemometric calibration models into our NIR and Raman methods in order to satisfy our second criterion. In a previous publication [11], we demonstrated that partial least squares (PLS) calibration models could detect DEG in glycerin at the 1% level with benchtop Raman and NIR spectrometers. so we had confidence that chemometric calibration would give us the sensitivity we required for a screening method. 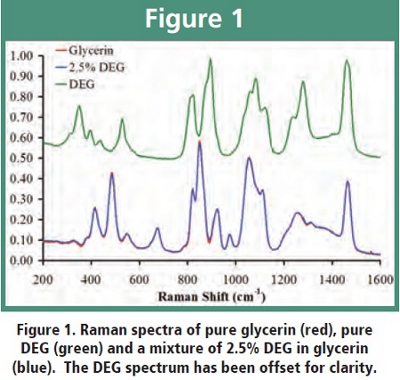 This sensitivity would not be adequate to meet USP requirements, but it should be adequate to screen large numbers of glycerin samples for economically motivated adulteration with DEG. Anecdotal evidence suggests that economically motivated adulteration of glycerin with DEG would occur in the range of 7-25 weight percent. We were able to achieve similar results for DEG in glycerin with portable Raman spectrometers, as well as for DEG in propylene glycol with portable NIR spectrometers. (Details of the NIR method for DEG in propylene glycol will be described in a future publication.) Figure 1 shows a glycerin spectrum and compares it to a spectrum containing 2.5% DEG in glycerin. Both spectra were collected with portable Raman spectrometers. The spectra are nearly identical, but the chemometric calibration model can easily distinguish the contaminated spectrum from the spectrum of pure glycerin. Such a determination would be very difficult by visual inspection of spectra or difference spectra.
Chemometric calibration resulted in a rapid and sensitive method for detecting DEG in glycerin with portable Raman spectrometers, but the use of chemometrics threatened to compromise the user-friendliness of the method. Typically, the analyst would use the vendor’s software to collect spectra, pass the spectra to a chemometrics data analysis program, and then interpret the results to either pass or fail the sample at hand. To overcome this cumbersome sequence of events, we developed a Microsoft Excel-based user interface that controlled the instrument, measured a spectrum, applied the chemometric calibration model to the measured spectrum, and then made a pass/fail decision using statistically-based decision criteria. The analyst begins by selecting a method from a dropdown menu, which contains all of the required parameters such as laser power and integration time as well as the name of the previously prepared chemometric calibration model for the analysis of the samples at hand.
The interface was created using Microsoft Visual Basic for Applications (VBA) to access instrument and software control functions using the vendor-supplied dynamic link libraries (DLLs). One significant advantage of this approach is that Excel is a familiar program to most inspectors and scientists, and therefore little training is required to familiarize the user with the platform. Screen shots of the user interface are shown in figure 2, illustrating the appearance of the interface after a sample passes or fails.
The statistical decision criterion that is applied to the results of the chemometric prediction is based on the procedure developed at the National Institute for Standards and Technology (NIST) for determining limits of detection (LoDs) and critical levels for chemical analysis [12]. This procedure is illustrated in Figure 3. The analyst must make several measurements of a blank sample in order to estimate the distribution of predictions when no DEG is present. The critical level is then selected at the 95% confidence level (or other desired level of confidence) as the upper limit of the onesided interval that includes 95% of the distribution’s area. Once the critical level is determined, the analyst can estimate the distribution of predictions for a sample containing a low level of DEG. We used a 5% DEG in glycerin sample for this purpose. From this distribution, the lower limit of the one-sided 95% confidence limit is identified. The center of the low level DEG sample distribution is then shifted so that these two limits coincide at the critical level. The critical level is then used as the decision threshold. The critical level can be interpreted in the context of hypothesis testing as the concentration at which a type I error (false failure of a blank sample) will occur 5% of the time, and the concentration at which a type II error (erroneous pass for a sample contaminated at the LoD) will occur 5% of the time.

To distribute this method to field instruments, we used a chemometric method for transfer of calibration known as piecewise direct standardization. (Details of the calibration transfer procedure will be described in a future publication.) The method requires the field analyst to measure 5 to 10 “calibration transfer” samples that are compared to identical samples measured with the master instrument. The chemometric software then applies a transformation to the spectra measured on the field instrument that corrects for differences between the response of the field and master instruments, and the PLS calibration model is applied to the transformed spectra. Measurement of the calibration transfer spectra takes 5 to 10 minutes and does not require the field user to build a chemometric calibration model. Similar procedures were developed to detect DEG in propylene glycol by NIR spectroscopy. Thus, we have satisfied all four criteria required to successfully deploy methods based on portable NIR and Raman instruments to the field. Using the procedure outlined above, the results from the collaborative study of the Raman method for detecting DEG in glycerin gave a detection limit of 2.4% and a critical level of 1.4%. Subsequent improvements to the method have resulted in lower detection limits at the DPA lab.
X-ray Fluorescence Spectrometry
Portable XRF spectrometers have been widely used to evaluate the composition of alloys, artwork and artifacts and for environmental sampling [13, 14]. Spectral integration times are typically on the order of 1-10 minutes; therefore XRF spectrometry is suitable for rapid screening. Modern portable XRF spectrometers use x-ray tube sources that generate a broad “bremsstrahlung” emission that can interfere with the x-ray fluorescence from the sample. Bremsstrahlung can be scattered by the sample into the XRF detector resulting in a spectral background whose intensity depends on the sample density. For example, Figure 4 displays the XRF spectrum of a stainless steel sample with strong chromium, iron, nickel, and molybdenum signals. All of the elements that comprise this sample absorb x-rays strongly, and the relative intensity of the background signal is low. This can be contrasted with the XRF spectrum in Figure 4 of an aqueous solution containing 50 parts per million (ppm) of both lead and mercury. The lead and mercury lines are easily identifiable, but they ride on a broad background signal that is nonlinear. Small iron and copper peaks and large Pd and This poses a challenge for calibration of XRF spectra. XRF analysis software typically addresses this issue by developing matrix specific calibrations, but we felt that this was not appropriate for our purpose, because we would not always have advanced information concerning the matrix for the samples of interest. To overcome this problem, we have developed a transformation method that eliminates the broad background emission in a matrix-independent and instrument-independent manner that does not rely on baseline fitting. (Details of the transformation method will be the subject of a future publication.) The transformation method makes the XRF methods easily distributable to field instruments.

We have used the transformed data to develop a limit test for the presence of toxic metal impurities in pharmaceutical materials. The method does not require a quantitative calibration, and detection of impurities is based on the signal-to-noise ratio of the transformed signal at the element’s emission energy. By applying this limit test to a large number of samples of known composition, we can estimate the detection limit for any given element as the concentration at which we correctly detect the presence of the element at the 95% confidence level. This provides an estimated detection limit in a manner consistent with the detection limits determined for Raman and NIR measurements. Based on the results of the collaborative study with field scientists, we estimate that we can detect lead, mercury and arsenic at levels below 18 ppm. Because chromium emits low energy X-rays and has a weak background signal, we estimate that our detection limit for this element is 75 ppm. The strongest cadmium XRF line lies beneath the strong Compton peak at about 23 keV. Because we rely on the relatively weak Kβline at about 26 keV, our detection limit for cadmium is about 300 ppm. Methods for catalytic metals are currently under development.
Our implementation of portable XRF analysis has also benefited from a custom-designed Visual Basic user interface. We did not have access to the DLLs to control our XRF spectrometers, so we constructed a user interface that provides step-by-step instructions that allow a user to collect a spectrum without extensive training. Once the spectrum is saved, the interface automatically transforms and analyzes the data, and delivers a pass/fail decision to the user. This approach requires both the user interface and the vendor’s spectral collection software to be open at the same time on a laptop computer, and is therefore slightly more cumbersome than the Raman and NIR interfaces. The total time required to analyze a single sample is about 90 seconds. The XRF method has therefore met our four criteria of speed, sensitivity, user friendliness and distributability.
Ion Mobility Spectrometry
Ion mobility spectrometry is capable of detecting molecular species at the part per million level. In a recent paper, we demonstrated that benchtop ion mobility spectrometry could detect undeclared synthetic erectile dysfunction drugs in products marketed as dietary supplements [9]. For the collaborative study we focused our efforts on detecting undeclared synthetic active pharmaceutical ingredients (APIs) in herbal products and dietary supplements using portable IM spectrometers. The molecular analyte of interest must be volatilized to be detected by IM, so the application of portable IM spectrometers is limited to APIs that have some volatility at temperatures below 200° C. To perform the analysis, an extraction step is often required to separate the API from the rest of the material in the tablet or capsule. We have developed a rapid methanol extraction process that has successfully separated undeclared APIs from the tablet or capsule matrix material. A small sample of the extract can then be spotted on a desorption substrate and introduced into the IM spectrometer.
Sibutramine, an API present in prescription weight loss products, has been detected in several weight loss products marketed as dietary supplements. We have developed a rapid, sensitive method for detection of sibutramine by IM spectrometry. (A detailed account of the sibutramine method will be the subject of a future publication.) An herbal weight loss product was spiked with sibutramine, and the samples, instruments and protocols were sent to FDA field laboratories for analysis. The IM spectrometers allow the user to develop methods that signal the presence of molecules based on the drift time of parent and/or fragment ions in the instrument drift tube. Like the XRF instruments, we did not have access to DLLs that would allow us to control the instrument behind a user interface. Thus the IM spectrometer was used according to the manufacturer’s instructions after the method was developed. DPA scientists were able to download the IM spectra from the instruments when they were returned from the field, but the field analysts would not typically have access to the spectra in the field. When all analyses were completed, the results from all labs were compiled to determine the detection limit of the method. We found that we could detect sibutramine when as little as 2 nanograms were delivered to the instrument. Considering the dilution factor of the extraction step, this detection limit is capable of detecting undeclared sibutramine in dietary supplements at concentrations well below levels found during previous surveillance. The measurement takes about 20 seconds, and another 20-60 seconds is required to prepare the instrument for the next sample. Thus IM spectrometry has been found to be rapid and sensitive at levels suitable for our applications. Comments from field analysts indicate that the instruments are user friendly, and we have also demonstrated that a method developed on a single instrument can be distributed to other instruments, because of the internal calibrant that standardizes the measured drift times of IM spectrometers.
Summary
We have completed one collaborative study with each of the four types of instruments that have been identified for evaluation. The collaborative studies involved 6 different sites around the country, and for any given method, 6 to 8 analysts made measurements on 5 different instruments on different days using both battery and AC line sources to power the instruments. Using chemometric models developed at the DPA, Raman and NIR spectrometries appear to have detection limits in the 1-2% range when the spectrum of the contaminant is similar to that of the pharmaceutical article, whereas XRF and IM spectrometries appear to have detection limits in the ppm range. The second round of collaborative studies is under way, and the results from method development indicate that these detection limits should be achievable for a separate set of methods. There are still challenges to overcome. For example, the instruments require more routine maintenance than we initially anticipated; therefore maintenance of field instruments is likely to require significant lab support in the near term until instrument technology becomes more robust and durable. We are also working to streamline the process of method development so that we can respond quickly as new threats to the US pharmaceutical supply chain emerge. These collaborative studies indicate that portable instruments can be deployed for routine surveillance of FDAregulated pharmaceutical materials in the field. Widespread field deployment of rapid spectroscopic screening technologies could drastically increase the number of product packages and containers of drug ingredients inspected by the FDA while targeting only those samples that fail screening for analysis by more time consuming USP methods. This in turn may provide added assurance of the integrity of the US pharmaceutical supply chain.
Acknowledgements
The results described herein would not have been possible without the hard work and dedication of FDA field scientists including Luella Rossi, Murthy Sikha, Temar Williams (Philadelphia District Office) Daniel J. Brown, Gary Dzidowski (Detroit District Lab) Mark Henry (Pacific Regional Lab, Irvine, CA) Kenneth Williams, Phyllis Wilson, Valentino Fiorella, Dongping Dai (Northeast Regional Lab, Jamaica, NY) Burnell M. Henry, Sarah McMullen, Amy Irwin and Diana Mould (Southeast Regional Lab, Atlanta, GA).
References
1. (a) Deborah M. Autor, “Globalization: Challenges and Recent Case Studies” DCAT Week, New York, March 18, 2009 (b) “Are your Drugs Safe?” U. S. News and World Report, October 5, 2007
2. Randall Lutter, “Addressing Challenges of Economically-Motivated Adulteration” Public Meeting on Economically Motivated Adulteration, College Park, MD, May 1, 2009 http://www.fda.gov/NewsEvents/ MeetingsConferencesWorkshops/ucm163619.htm
3. Allan Coukell, “Protecting Consumers from Adulterated Drugs” Public Meeting on Economically Motivated Adulteration, College Park, MD, May 1, 2009 http://www.fda.gov/NewsEvents/ MeetingsConferencesWorkshops/ucm163619.htm
4. “Contaminant found in Heparin” Washington Post, March 6, 2008
5. U.S. Department of Health and Human Services, Food and Drug Administration, Guidance for Industry, “Testing of Glycerin for Diethylene Glycol” May 2007 http://www.fda.gov/downloads/Drugs/ GuidanceComplianceRegulatoryInformation/Guidances/ucm070347.pdf
6. “Supplements for Athletes Draw Alert from FDA” New York Times, July 28, 2009
7. U.S. Department of Health and Human Services, Food and Drug Administration, “Warning on Body Building Products Marketed as Containing Steroids or Steroid-like Substances” July 28, 2009 http:// www.fda.gov/forconsumers/consumerupdates/ucm173739.htm
8. John C. Reepmeyer, Jeffrey T. Woodruff, and D. André d’Avignon “Structure elucidation of a novel analogue of sildenafil detected as an adulterant in an herbal dietary supplement”, Journal of Pharmaceutical and Biomedical Analysis (2007) 43, 1615-1621
9. Connie M. Gryniewicz, John C. Reepmeyer, John F. Kauffman and Lucinda F. Buhse, “Detection of Undeclared Erectile Dysfunction Drugs and Analogues in Dietary Supplements by Ion Mobility Spectrometry”, Journal of Pharmaceutical and Biomedical Analysis (2009) 49, 601-606
10. International Conference on Harmonisation of Technical Requirements for Registration of Pharmaceuticals for Human Use (ICH) , Guidelines for Industry Q2A, Text on Validation of Analytical Procedures, 1995
11. Connie M. Gryniewicz, John A. Spencer, Michael Hankins and John F. Kauffman, “Spectroscopic methods for rapid determination of diethylene glycol in glycerin” American Pharmaceutical Review (2007), 10, 24-30 (Issue 7, Nov/Dec)
12. Lloyd A. Currie, “Limits for Qualitative Detection and Quantitative Determination” Analytical Chemistry (1968) 40, 586-593 http://www. cstl.nist.gov/div837/Division/about/Currie_1968.pdf , see also http://nvl. nist.gov/pub/nistpubs/sp958-lide/164-166.pdf
13. “Science from Art” Chemical and Engineering News, October 19, 2009
14. Dennis J. Kalnicky and Raj Singhvi, “Field portable XRF analysis of environmental samples” Journal of Hazardous Materials (2001) 83, 93-122
Dr. John Kauffman is a research chemist in the FDA Division of Pharmaceutical Analysis, St. Louis, MO, and serves as the team lead for the rapid spectroscopic screening technologies project. He received a Ph.D. in Physical Chemistry from the University of Illinois, Champaign- Urbana. He joined the FDA in 2004 after a 13 year academic career as Professor of Chemistry at the University of Missouri, Columbia.
Dr. Connie Gryniewicz-Ruzicka is a chemist in the FDA Division of Pharmaceutical Analysis, St. Louis, MO. She has a bachelor’s degree in chemistry from Wayne State University in Michigan and received her Ph.D. in Analytical Chemistry from the University of Missouri in Rolla. In her present position at the FDA, Dr. Ruzicka utilizes spectroscopic methods to study the quality and stability of pharmaceutical products.
Dr. Sergey Arzhantsev is an ORISE fellow in the FDA Division of Pharmaceutical Analysis, St. Louis, MO. He has a bachelor/master degree in physics from Moscow M. V. Lomonosov State University in Moscow, Russia and received his Ph.D. in Physics from the same university. In his present position at the FDA, Dr. Arzhantsev utilizes spectroscopic methods to study the quality and stability of pharmaceutical products.
Dr. Jamie Dunn is a chemist in the FDA Division of Pharmaceutical Analysis, St. Louis, MO. She has a B.S. in Chemistry from Southern Illinois University in Carbondale. She received her M.S. in Criminal Justice, M.S. in Chemistry, and Ph.D. in Analytical Chemistry from Michigan State University in East Lansing. She currently uses mass spectrometry and ion mobility spectrometry to study the quality of pharmaceutical products.
Dr. John Spencer is a research chemist in the FDA Division of Pharmaceutical Analysis, St. Louis, MO. He received his Ph.D. in Physical Inorganic Chemistry from the University of Illinois. Before joining the FDA, Dr. Spencer was Professor of Chemistry at Southern Illinois University at Edwardsville. His research interests include applications of physical, spectroscopic and chemometric methods to pharmaceutical analysis and PAT.
Dr. Steven Wolfgang is a consumer safety officer on the guidance and policy team within the FDA Center for Drug Evaluation (CDER) Office of Compliance, Division of Manufacturing and Product Quality. He is a member of the CDER team that oversees its drug surveillance testing program and is working with others within the Agency to develop and assess potential of technologies for identification and authentication of drug ingredients and for the detection of Economically Motivated Adulteration within the ingredient supply chain.
Xiang Li was an ORISE fellow in the FDA, Division of Pharmaceutical Analysis, St. Louis, MO, during the summer of 2009, where she performed near-infrared spectroscopy, X-ray fluorescence spectroscopy and comparative analysis of pharmaceutical products using chemometrics. She is currently pursuing her Doctorate in Chemistry at The Pennsylvania State University doing laser spectroscopy.
Lindsey Pelster was a student intern in the FDA Division of Pharmaceutical Analysis, St. Louis, MO, during the summer of 2009, where she contributed to the development of the portable spectroscopic methods of chemical analysis. She received her bachelor’s degree in biochemistry from Saint Louis University, and is currently a graduate student in the Saint Louis University Department of Chemistry working with Prof. Shelley Minteer to optimize enzymatic biofuel cells for energy applications.
Benjamin Westenberger is Deputy Director of the Division of Pharmaceutical Analysis (DPA) in St. Louis, a laboratory for the Center for Drug Evaluation and Research (CDER) in the Food and Drug Administration (FDA). Mr. Westenberger joined DPA in 1971, and has held a variety of positions during his tenure at the DPA.
Dr. Lucinda Buhse is Director of the Division of Pharmaceutical Analysis (DPA) in St. Louis, a laboratory for the Center for Drug Evaluation and Research (CDER) in the Food and Drug Administration (FDA). Dr. Buhse joined DPA in 2001 as Deputy Director and was promoted to Division Director in June, 2004. Dr. Buhse received a B.A. in Chemistry from Grinnell College and a Ph.D. in Physical Chemistry from the University of California, Berkeley under the direction of John H. Clark and George C. Pimentel. Before joining FDA, Dr. Buhse worked in management positions in Production, Validation and Analytical Services at Sigma Aldrich Corporation and as a Senior Research Scientist for Rohm and Haas Company.