Introduction
Developing a robust analytical method for pharmaceutical products is always challenging. A lot of effort has been devoted to chromatographic separations, column selections, and quick analysis turnaround time. On the other hand, less attention has been paid to sample preparation and/or to the subtle differences in various chromatographic instrumentation. Matrix effect seems to be more of a concern in bioanalytical samples or for LC-MS studies [1].
Different from prescription medicinal products, the compositions of over-the-counter (OTC) drug products tend to be complicated due to the presence of a variety of ingredients (multiple drug substances, inert but functional excipients, flavors, dyes, etc.). Many excipients used in OTC products are intended to achieve fast onset effects, provide pleasant experiences, and improve consumer compliance. However, the added “inert” ingredients can not only sometimes cause product instability, but can also give big challenges to analytical scientists [2].
A common practice for HPLC quantitation of pharmaceutical products is to measure a sample UV response against an external standard response. In routine analysis, the standard solution is usually prepared using solutions that do not contain a sample matrix, i.e., the placebo of the product. The assumption is that the sample matrix does not cause any differences in the response of the analyte in sample solutions and the response obtained from the external standard solutions.
For this assumption to hold true, the sample matrix and sometimes the chromatographic instrumentation play very important roles. In this paper, an active pharmaceutical ingredient (API) was spiked at the same concentration into a concentrated (10x) placebo, a “normal” (1x) placebo, and a diluted (0.1x) placebo. The recoveries of the spiked API in both the 10x and 1x placebos were obtained using two commercial analytical HPLC systems and a commercial UPLC system. In addition, the recovery of the 0.1x placebo was obtained using the UPLC. In extreme cases, a sample response can be 90% different from the standard response, which obviously causes attention. But in many cases, the difference in responses is less than 4% and may be overlooked. The product development endeavors can be wrongly focused on “improving” product stability, content uniformity, etc., while the undesired recoveries are actually caused by the analytical method in which the sample preparation is not optimized for the selected chromatographic system.
Experimental Procedures
Materials
The excipients used in this study are all commonly available in over-the- counter pharmaceutical products. Purified water (18.2 MΩ.cm) was obtained in-house and all HPLC grade solvents were obtained from a leading provider of analytical instruments.
Instrumentation
Two HPLC systems and one UPLC system were used in this study. All HPLC systems were equipped with a column compartment with temperature control, an on-line degasser, and an autosampler with temperature control. Data acquisition, analysis, and reporting were performed by two vendor’s chromatography software.
Chromatographic Conditions
Since this work is not for a specific product, generic conditions were used as long as the API peak was retained longer than void volume and no placebo peak was observed in the baselines.
Solution Preparations
Sample solutions were prepared by dissolving a certain amount of placebo to make a 10x placebo, a 1x placebo, and a 0.1x placebo solution. A stock API solution was prepared and the same amount of the API stock was pipetted into the 10x, 1x, and 0.1x placebo solutions to make the 10x placebo-API, 1x placebo-API, and 0.1x placebo-API solutions.
Calculation
The quantitation of API was carried out based on the external API reference standard prepared. The sample solution experimental concentration was obtained from the following equation:
Where:
P1 = peak area of the API in the API standard injection
P2 = Peak area of the API in placebo-API solution
C1 = Concentration of the API in standard solution
The recovery of the API was then determined by the following equation:
Results and Discussion
As mentioned in the introduction section, many OTC products have large amounts of excipients for various purposes. The challenges to the analytical scientist are not only in the chromatographic separation, but also in the sample preparation. During our method development work, we observed some interesting phenomena. Below are the results obtained from several artificially-made samples (i.e., not from a commercial or development product), for the purpose of this presentation. The concentration of the API spiked was around 0.3 mg/mL, which is reasonable for routine analysis. The placebo was constructed based on some true formulations. Three placebos were made, one at a 10x concentration, one at a 1x concentration and the third one at a 0.1x concentration of the placebo solution. The API was then spiked into these three placebo solutions at the same 0.3 mg/mL level. The diluent was a mixture of 50:50 water:methanol (v/v) or 50:50 water:acetonitrile (v/v). The sample solutions were filtered and placed onto the chromatographic instrument autosamplers which were chilled at 4oC or maintained at 25oC. The other chromatographic parameters such as columns, gradients, and mobile phases were not a major concern for this presentation and thus are not discussed in detail.
Peak Shape Does Not Necessarily Tell the Truth
Often times, the chromatographers will pay close attention to the peak shape in addition to the peak retention and critical separations. In some cases, the peak shape is obviously distorted causing the chromatographer to change the chromatographic conditions such as gradient, mobile phase compositions, ionic strengths, etc. to obtain a better peak shape. Figure 1 shows an overlaid chromatogram of the API peaks from a standard solution, a 1x placebo-API solution, and a 10x placebo-API solution. The peak shape from the 1x placebo-API and the standard injections are highly similar while the peak shape from the 10x placebo-API injection is distorted. The distortion is very obvious since it is chosen for illustration purposes. In some cases, the peak distortion is not quite as obvious and might mislead the chromatographer to believe there is some “co-elution” resulting in efforts to “improve” the “separation”.
 Figure 1. Overlaid chromatogram of a 10x placebo-API (bottom black line), a 1x placebo-API (middle blue line), and an API standard (top red line) injections. The injections were made on the first HPLC system.
The real risk is, however, that even with a “perfect” peak shape, the matrix effect can still cause false recoveries. Figure 2 shows an overlaid chromatogram of the API peaks from the standard solution, the 1x placebo-API solution, and the 10x placebo-API solution. The gradient conditions were optimized to obtain the same peak shape from both samples and the standard. The recoveries are 104.0% and 99.8% for the API spiked in the 10x placebo and the 1x placebo, respectively. A false positive recovery (+4%) is obtained from the 10x placebo-API solution without any obvious chromatographic abnormality.
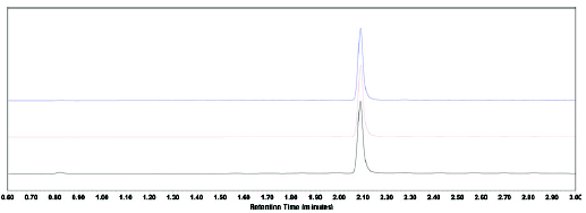 Figure 2. Overlaid chromatogram of a 10x placebo-API (bottom black line), a 1x placebo-API (top blue line), and an API standard (middle red line) injections. The injections were made on a UPLC system (0.3 μL injection, 104% recovery for 10x placebo-API and 99.8% recovery for 1x placebo-API).
Recoveries from First HPLC System
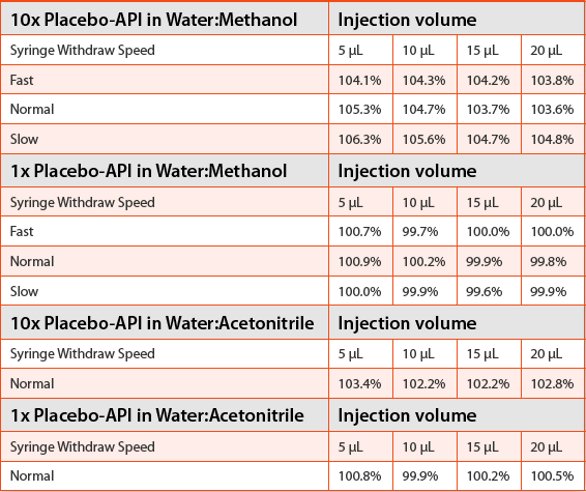
The recoveries obtained from the first HPLC are listed in Table 1. The API was spiked in 10x placebo and 1x placebo solutions. The diluents were either a mixture of 50:50 water:methanol (v/v) or a mixture of 50:50 water:acetonitrile. The samples were placed into the autosampler chamber which was chilled to 4oC. Conventional wisdom tells chromatographers to lower the syringe withdrawing speed when handling viscous samples. Therefore different sample withdrawing speeds were evaluated. Furthermore, the water:acetonitrile diluent was used to make the sample solutions less viscous than the sample solutions made in 50:50 water:methanol. The results indicate, however, that no matter which syringe withdrawing speed was selected, the recoveries from the 10x placebo-API samples were off the target of 100% recovery by 2 to 6% from the water:methanol solutions, and by 2 to 3% from the water:acetonitrile solutions. On the other hand, the recoveries from the 1x placebo-API samples were right on the target of 100% in both solvent mixtures, regardless of the syringe withdrawing speeds.
Table 1. Recoveries of spiked API in 10x placebo and 1x placebo samples on the first HPLC. Autosampler temperature 4oC
Recoveries from Second HPLC System
The same sample solutions were placed onto the HPLC autosampler (maintained at 4oC) for evaluation. The sample withdrawing speeds were selected at the default setting of 200 μL/minute and two other extremes, 1000 μL/minute and 10 μL/minute. Dramatic differences were observed from the recoveries of the 10x placebo-API and 1x placebo-API samples (Table 2). The recoveries from the 10x placebo- API samples prepared in water:methanol solutions were off the target of 100% by more than 90% in some cases. Again, the results were for illustration purposes, since this significant difference would obviously catch the chromatographer’s attention and in fact, the peak distortion such as the one shown in Figure 1 was observed. The recoveries were much better from the 10x placebo-API sample prepared in the water:acetonitrile solution, except for the 20 μL injection. On the contrary, no matter which syringe withdrawing speed was selected or which solvent mixture was used, the recoveries from the 1x placebo- API samples were right on the target of 100%.
Table 2. Recoveries of spiked API in 10x placebo and 1x placebo samples on the second HPLC. Autosampler temperature 4oC

Recoveries from UPLC System
Sample solutions prepared by water:methanol as the diluent were placed into the autosampler for evaluation. The sample withdrawing speeds were selected at the default setting of 100 μL/minute and two other slower speeds of 50 μL/minute and 20 μL/minute. To evaluate whether lowering the sample viscosity would improve the recoveries, the autosampler was also maintained at 25oC during injection. Once again, sporadic recovery results were obtained from the 10x placebo-API injections (Table 3). The recoveries were not improved by increasing the autosampler temperature or by lowering the syringe sample withdrawing speed. The recoveries from the 1x placebo-API injections were all close to 100%, no matter which syringe sample withdrawing speed or at which temperature the autosampler was maintained. Apparently, the sample matrix effect can be much more than just a viscosity issue.
Table 3. Recoveries of spiked API in 10x placebo and 1x placebo samples on a Waters Acquity UPLC. Autosampler temperature 4oC and 25oC

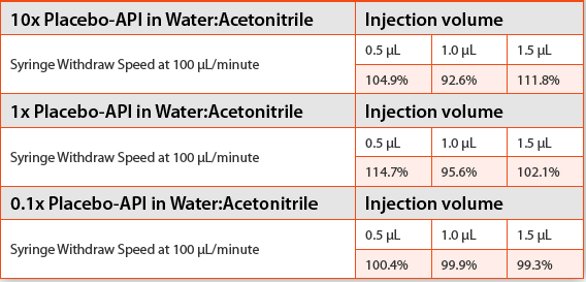
Interestingly, when sample solutions prepared by using water:acetonitrile as the diluent were placed into the autosampler for evaluation, we found even the 1x placebo-API solution did not give good recoveries (Table 4). The experiments were repeated many times and all results showed sporadic recoveries from both 10x and 1x placebo-API solutions prepared in water:acetonitrile. Good recoveries were only obtained after we further diluted the 1x placebo 10 times to a 0.1x placebo. The take-home message seems to be that when using UPLC, more attention should be paid not only to the sample preparation but also to the delicate nature of the instrumentation. In fact, we also noticed that although good recoveries were obtained with 2 μL injections on the second HPLC, it was not the case on the first HPLC. It is known that the injector design, sample withdrawing and delivery mechanisms are different between the two HPLCs. Therefore, the results obtained here also serve as a reminder to chromatographers that when a good result is obtained from one HPLC at small injection volumes such as 2 μL, the same may not necessarily be true for injections made on another HPLC, especially when a 100 μL syringe is installed. Thus to make the method robust and transferable from laboratory to laboratory, this injector difference has to be taken into account.
Table 4. Recoveries of spiked API in 10x placebo, 1x placebo, and 0.1x placebo samples on a UPLC. Autosampler temperature 4oC
Conclusions
The potential impact of sample matrixes and chromatographic instrumentation on obtaining the true value of the API potency is illustrated in this presentation. This matrix effect may not be simply ascribed to the solution viscosity and may not be easily fixed by increasing the autosampler temperature, using less viscous solvent, or lowering the injector sample withdrawing speed. During method development, evaluating different injection volumes and sample withdrawing speeds to check whether consistent results could be obtained may be helpful to rule out the matrix effect. Whether diluting the sample (and therefore diluting the placebo), or using a placebo in the preparation of external standards, it is up to the chromatographer to balance the workload and placebo availability for routine analysis. As pointed out in this study, subtle differences among various chromatographic instruments must also be taken into account.
Acknowledgements
The authors would like to thank Jerry Meisel, head of the Bayer HealthCare Consumer Care Global Product Development, for his support of this study.
Author Biographies
Jianhua Li received her B.Sc. in Polymer Physics from University of Science and Technology of China, and Maters in Analytical Chemistry from Colorado State University. She is currently a Research Scientist in the Global Product Development Analytical Development at Bayer Healthcare Consumer Care. Her daily work involves analytical method development and providing analytical support to formulation development of new over-the-counter drug products.
Jenny Lee received her B.Sc. in Sung-shin University, Seoul, S. Korea and Masters in Biochemistry from Old Dominion University in Norfolk, VA from 1988 to 1990. She is currently a Research Scientist in the Global Product Development Analytical Development at Bayer Healthcare Consumer Care. Prior to joining Bayer, she worked as a Research Associate in Enzon Pharmaceuticals.
Dr. Murty Varanasi received his B.Sc. in Chemistry, Physics and Mathematics from Andhra University, India in 1974 and Ph.D. in Natural Products Chemistry in 1980. He then completed postdoctoral fellowships at University of Virginia, University of Texas and University of Pennsylvania from 1982-1989. He is currently a Senior Research Scientist in the Global Product Development Analytical Development at Bayer Healthcare Consumer Care.
Dr. Kang Ping Xiao received his B.Sc. in Chemistry from Wuhan University, China, in 1990, and a Ph.D. in Analytical Chemistry from the University of Tokyo, Japan, in 1999. He then completed postdoctoral fellowship at Michigan State University and The University of Michigan from 1999 to 2003. He is a Senior Associate Director leading the Global Product Development Analytical Development at Bayer Healthcare Consumer Care.
References
- Strategies for the Assessment of Matrix Effect in Quantitative Bioanalytical Methods Based on HPLC−MS/MS. Anal. Chem., 2003, 75 (13), pp 3019–3030. B. K. Matuszewski, M. L. Constanzer, and C. M. Chavez-Eng
- QUALITY CONTROL - Testing Methods / Overcome OTC Challenges. Pharmaceutical Formulation & Quality, April/May issue. Jeff Layne, and Sky Countryman