2013 is, for me, an auspicious year. It marks the 30th anniversary of looking into a new technique for raw materials qualification and finding, ta-da, near-infrared spectroscopy. There were few choices of vendors in the US at that time: the company with whom I worked on my research which no longer exists (thanks to venture capitalists), and the other major player, which has, over the years morphed into a leading manufacturer of instruments for chemical analysis and is still doing quite well. My company was developing qualitative software at that time.
We had just undergone a large expansion of our QC labs at Sandoz (US), more than doubling our staff and making massive capital expenditures on equipment. When we were asked by Basel (we were Swiss-owned, after all) to comply with the EMEA “suggestion” to inspect 100% of our containers of incoming excipients and actives, I was asked what would be required to comply. My director was not at all happy with the answer: a second shift was needed for QC to perform all those USP tests on thousands of samples each month.
After the recent departmental growth-spurt, that expense was out of the question, so I was “urged” to find an alternative method. I was visited by an NIR salesman who told me that the method required no work and was simple and easy. Of course, I ignored him. Only later that week, when I attended an NIR symposium (all food, agriculture, and polymers), I saw potential in the technique. After all, the protein or nylon amide bond was not that different from a drug’s amide bond. And a hydroxyl group was a hydroxyl group, whether located on polyester, sugar, or aspirin.
[Note: The down side to investigating this technique for our use was that there were few reference books available. Virtually all analytical texts ignored the NIR or mentioned that it was found “between the Visible and Infrared regions.” The closest I had to go on was “Near- Infrared Technology: In the Agricultural and Food Industries” by Phil Williams and Karl Norris, two original masters of NIR from Canada and the US. There were many clues, but noting on drug products.
We all know that the USDA runs more on practical results, while the USFDA is tied to cGMP. Eventually, Don Burns and I published the “Handbook of Near-Infrared Analysis”, [Marcel-Dekker Inc., New York (1992)].There, other pharmaceutical workers could find solace while doing an orphan technique.]
To make a long story short(er), we bought an NIR instrument, hired a person to sample materials in the warehouse, and became the beta site for the new software. Dr. Howard Mark (with whom I later taught NIR courses) introduced the Mahalanobis distance concept [1], now used in a large number of commercial software packages. By 1984, we had validated NIR for raw materials and by 1985 we were qualifying 100% of incoming raw materials and APIs with NIR. [To me, an interesting highlight is that commercial Principal Components and Partial Least Squares software were not available until 1987, two years later.]
Once we had the instrument in-house and the raw materials problem “solved”, we wondered to which other projects the technique might be applied. It was known that agricultural samples (e.g., wheat) were ground to mitigate the effect of particle size on diffuse reflection spectra. So, we tried to see if the effect could be used to measure particle size (see Figure 1). We found that sieve cuts of common excipients and APIs could have their estimated mean particle size determined with NIR [2]. When the reciprocal of the mean particle size is plotted v. the Absorbance at a chosen (random) wavelength, a straight line is seen (Figure 2). Some instrument manufacturers insisted that derivatives would obviate baseline offsets, but it was not until Multiplicative Scatter Correction software became available (also in 1987) that much of the particle size effects were eliminated.
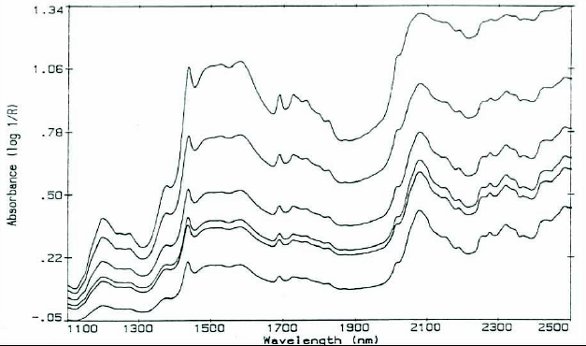 Figure 1. Diff use Refl ection spectra of various particle sizes of sucrose (c. 1985)
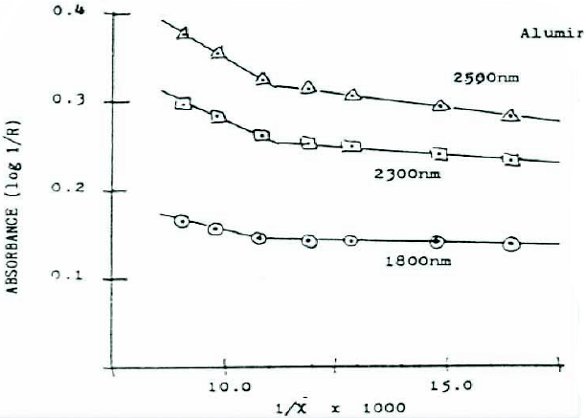 Figure 2. Reciprocal of mean particle size vs. Absorbance at various wavelengths
Many of the discoveries during these “formative” years were, let’s just say “unplanned”. In 1986, I prepared a saturated methanol solution of caffeine by shaking the flask with excess material. After a time, the mixture was deemed saturated, it was filtered and the filtrate place into another flask. After only a few minutes, a large amount of crystalline material appeared. On a hunch, it was dried, scanned via NIR and the spectra compared with the starting materials. Figure 3 shows the two materials (2nd derivative) spectra overlaid. This observation led to examining polymorphism, since this was quite important and common in pharmaceutical actives.
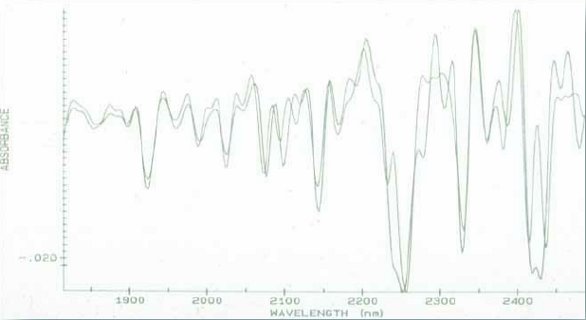 Figure 3. Recrystallized caffeine and starting material. The recrystallized peaks are sharper above 2000nm.
While we had not done quantitative analyses of dosage forms (yet), we found that the Mahalanobis concept could be used to ascertain that the materials in drug granulations both contained all ingredients and that they were within “tolerance” levels prescribed by law [3]. So, in 1986, the groups could be qualified as “all present and within limits,” or missing A, or B or C. This concept was revisited over a decade later as a precursor to PAT blend uniformity.
Since the Absorbances in NIR are based on C-H, N-H, and O-H vibrational overtones and combinations, it stood to reason that the nearest-neighbor molecule would affect the spectrum of each material in a crystal. So it stood to reason that the effect should be seen when an optically active material was crystallized as a racemic mix. Both isomers, in their pure state, “see” the same crystal structure, with all hydrogen bonds similar. However, when the two mirror-imaged molecules formed a crystal, the C=O, R-H, and R-OH moieties had different spatial partnerships. We used this idea to assay the optical purity of amino acids [4].
Other workers discovered that the degree of crystallinity was easily determined for excipients and active ingredients with NIR. It is also well documented that the adsorption of a drug into the blood stream is enhanced when it is amorphous, so crystallinity determination was a critical application. Now, we were looking at physical differences, where traditional spectroscopy had been a mainstay of quantitative analysis.
In the late 1980s, other players entered the pharmaceutical (NIR) arena. Academics began using the technique and turning out excellent researchers. Rob Lodder, graduating from Indiana University and moving to Kentucky, began doing a myriad of research projects. Later, Jim Drennen (now Professor and Dean) settled at Duquesne and has generated an amazing number of graduates in the field. Centers of NIR are found at Rutgers, Maryland (with the FDA nearby, why not?), CPAC at the U. of Washington, among some of the best.
The irony of the universities taking such a strong lead is that, in the beginning, not one would touch near-infrared. Not because it was not worthwhile, but because of its “breeding.” Most “true” scientific methods (i.e., NMR, Mass Spectroscopy, etc.) were developed at universities and “bestowed upon” the mere practitioners in industry. NIR was the brainchild of workers in the US Department of Agriculture, namely Karl Norris (90 years young and still doing research). Certainly, the farmers at the USDA could not know as much as “true” professors and researchers, could they?
Another problem was that NIR was not spectroscopy, in the traditional sense. Traditionally, spectroscopy was used to either determine how much of a material was in a solution (UV/Vis, AAS) or what a pure material was, based on structure (IR, MS, NMR, Raman). NIR was a mongrel: vis., mixtures were used, not pure samples. It did not follow Beer’s law: the matrix absorbed more than any analyte, the pathlengths were not known, there were no stand-alone peaks, hydrogen bonding appeared everywhere, and, in many cases, no standards were available.
Despite these “handicaps,” industrial chemists have adopted the method more and more. The development of rugged instrumentation has brought the technique to the “Final Frontier:” the process floor. Instruments in the late 1980s became routinely equipped with fiber optic probes to allow for easy measurement of process lines and tanks. The instruments went from lab instruments to hardened lab instruments (encased in NEMA enclosure, heated or cooled, as necessary), to true portable instruments to handheld models.
The early wireless model (developed by Zeiss at Pfizer, Sandwich, UK) used for blend uniformity demolished the “glass ceiling” for NIR. Wireless units could be placed anywhere, being small and unattended. In addition, the lower operating voltages (6-12V, low amperage) obviated the need for expensive explosion-proof cabinets. This allowed the units to be placed in any environment at any step of the process. [And now, they can be carried by law enforcement to check for counterfeits, in the field.]
So, in a “mere” thirty years, we have seen NIR move from a clunky, lab-based instrument to tiny (some are solidstate and fit in the palm of your hand), rugged tools in the industry, making PAT more than a dream. What’s next? In addition to continued advances in NIR instrumentation, Chemometrics, and wireless communications, we have a new partner in our attempt at control: Raman.
Over the same time period we have been discussing, Raman mostly remained a lab oddity. The fact that it used a LASER and was, in reality, a scattering method, not necessarily purely spectroscopic made practical applications difficult. Yes, the spectra generated were on par with Mid- Range IR spectra and, yes, the information complemented MIR spectra, but there were technical problems.
Initial trials on pharmaceutical products tended to burn little holes, thanks to the LASER power. Also, quantitation was chancy, in the beginning. Moving to longer wavelength LASERs (ironically, into the NIR) avoided fluorescence nicely, excellent filter technology has largely eliminated Rayleigh scattering, and dependable LASERs have eliminated power variations, allowing quantitative assays.
Some good points of Raman are its ability to see specific materials in a mixture, be blind to water, allowing aqueous assays to be performed, and be sensitive to morphology changes, allowing determination of crystallinity and polymorphic changes. So, for raw material ID, Raman can do much of what a NIR can accomplish, often with less calibration. However, for qualification of raw materials, Raman has some blind spots: it cannot see water, so its presence must be inferred from peak shifts, not directly seen. In addition, particle size variations do not affect the Raman spectra, so Raman is not a tool for particle size determination.
We have seen two wonderful tools evolve over the past three decades. Both NIR and Raman are important tools in the pharmaceutical analysis tool-chest…I am just happy I was on hand to watch and help a little.
Author Biography
Emil W. Ciurczak, Ph.D., has advanced degrees in Chemistry from Rutgers and Seton Hall and has been in the pharmaceutical industry since 1970, performing method development on most types of analytical equipment. In 1983, he introduced NIR spectroscopy to pharmaceutical applications. He also consulted for numerous NIR companies. His research was on pharmaceutical applications of NIR where he has published over four dozen articles in refereed journals, over 150 magazine columns, and presented nearly two hundred technical papers.
Emil is a Contributing Editor for Pharmaceutical Manufacturing magazine and has written and edited several texts and chapters: “Handbook of NIR Analysis”, “Pharmaceutical and Medical Applications of NIRS”, “Molecular Spectroscopy Workbench”, and chapters on NIR applications to life sciences. Emil sits on several magazine editorial boards is a founder of the CNIRS, and was the 2002 chair for IDRC. He has been teaching (college adjunct) since 1979 at various colleges and presenting short courses for the ACS, CfPA (US and Europe), PTi, ASSA, and other organizations.
Emil is a consultant in the field of NIR and holds patents for NIR-based devices and software. He consults with various pharmaceutical companies, instrument manufacturers, and the FDA. He was a member of the PAT subcommittee (Validation) for the FDA and member of the PAT Expert Committee for the USP. He was the 2004 recipient of the EAS Achievements in NIR Award.
References
- H.L. Mark, D. Tunnell, “Qualitative Near-Infrared Reflectance Analysis using Mahalanobis Distances”, Anal Chem. 57 (7), (1985) pp. 1449-1456.
- E.W. Ciurczak, R.P. Torlini, and M.P. Demkowitz. “Determination of Particle Size of Pharmaceutical Raw Materials Using Near-Infrared Reflectance Spectroscopy”, Spectroscopy 1 (7), 36 (1986).
- E.W. Ciurczak and T.A. Maldacker, “Identification of Actives in Multi-Component Pharmaceutical Dosage Forms via NIR Reflectance Analysis”, Spectrosc 1(1), 36 (1986)
- E.W. Ciurczak, D. Honigs, B. Buchanan, and A. Grunke, “Determination of Enantiomeric Purity of Valine by Near Infrared Analysis”, Spectroscopy 3 (5), 25 (1988).
- Chapter“Near-Infrared Spectrophotometry”, Pharmacopeial Forum. 28 (6) Nov-Dec (2002) p1119ff.