Introduction
Regulatory agencies are increasingly requesting a more comprehensive evaluation of the potential contamination of biopharmaceuticals from leachables both from the container closure system used to store the biopharmaceutical and other possible sources such as the manufacturing system. To meet this demand, Total Organic Carbon (TOC) has been investigated as a possible technique that can be used to assess leachables from biopharmaceutical manufacturing equipment and thus provide data to assess the potential risk that biopharmaceutical manufacturing leachables pose to patient safety and product quality.
TOC is mostly used for the analysis of aqueous-based systems due to fact that it will detect carbon from any source (including common solvents). Despite this limitation, it is commonly used in pharmaceutical cleaning verification due to its universal detection mode and rapid analysis time.
A typical manufacturing process is formed of several steps such as synthesis, purification, filtration, filling and storage. All of these steps can be performed with single-use assemblies. These assemblies can include chromatography columns, filters, storage bags or tubing, as examples.
Most single-use assemblies are manufactured with pharmaceutical grade polymeric materials often tested to meet the requirements of USP<87>, USP<88>, USP<661> and ISO 10993. Data from the majority of suppliers indicates that extracts are non-toxic and have been identified as mostly polymeric in nature.
Information gathered from suppliers on extractables levels from single-use assemblies can sometimes be incomplete leading to the need for further experimental studies. This is because the “off the shelf” information gathered from suppliers is not typically tailored specifically to a particular project and the conditions. In addition, methods used to assess the risk from extractables vary from one supplier to another.
This paper discusses how TOC can provide useful information as part of a risk-based approach in the assessment of leachables derived from single-use assemblies.
Through a series of case studies, the strengths and weaknesses of TOC as an analytical technique are illustrated when compared to chromatography-based techniques such as Gas Chromatography (GC) or High Performance Liquid Chromatography (HPLC). TOC is considered to have the following characteristics:
- It is precise and accurate.
- It has a wide linear range from ppb to ppm levels.
- It has very low limits of detection and quantitation.
- It is good as a limit test (to get a pass or a fail result).
- It is limited to a carbon-free solvent system (including buff er constituents/excipients).
- When compared to other chromatographic techniques, TOC provides limited information on the nature of detected compounds. The limitations are such that other techniques are required to fully characterize a sample.
The case studies presented form part of a risk-based approach aligned to the principles given in ICHQ8 and ICHQ9. Prior to conducting these studies, we have assessed the failure modes associated with single-use assembly leachables being dosed to patients. The highrisk failure modes were subsequently investigated using TOC. The failure modes were defined via FMEA process to classify them as low, medium and high.
Each of the single-use assemblies forming part of the manufacturing process could have been assessed individually by performing a set of analytical studies to understand what compounds can be extracted with aggressive conditions (e.g., the extractables) and what compounds will migrate under the (milder) process conditions (e.g., the leachables). These studies are most of the time performed with scaled down versions of the single-use assemblies in a static mode and use classical analytical methodology such as HPLC and GC for separation and identifi cation of the compounds. This approach can lead to lengthy method development and validation.
In general, the data presented by suppliers from GC and HPLC analyses for the leachable studies does not show the presence of many leachables in the solutions. However, TOC data is also often included in the package from suppliers and the TOC data suggests that GC and HPLC are not giving a complete picture of what is in the solutions, as mass balance is not always achieved. Most of the singleuse assemblies are made of plastic or polymeric materials. Therefore, it is possible that leachable material might correspond to non-volatile components not easily detected by either GC or HPLC analysis. Indeed, some manufacturers included a qualitative analysis of the nonvolatiles components using Fourier Transform Infrared spectroscopy (FTIR) to recognize this.
Experimental: Investigation of single-use Assemblies using TOC
Total Organic Carbon (TOC) measurements were made during “simulated” manufacture using full size single-use assemblies. Similar conditions to full manufacture were adopted except sources of carbon were excluded to allow TOC to be used to assess leachables. The TOC analysis is able to provide a measure of the overall carbon content of aqueous solutions and can be used to monitor components leached from the single-use assemblies. It is not however able to provide an identity or the source of the carbon it measures. A diagram of the system used is shown in Figure 1.
 Figure 1. Schematic diagram of a total organic carbon analyzer
Nevertheless, it provides a quick, sensitive and accurate method to determine amount of carbon present in extracts. In our experiments, TOC levels have been initially compared to a patient exposure threshold of 1.5μg/day, which has been selected as a trigger for further study. The threshold of 1.5μg/day is the same as the threshold used for genotoxic impurities and represents a threshold below with exposure so small that it is a negligible risk to patient safety even from compounds that are genotoxic. This seemed to represent a conservative and riskbased threshold. It allows TOC to be used as a rapid screening tool. If levels less than 1.5μg/day are measured, no further analytical study is necessary. With this in mind, Figure 2 illustrates the biopharmaceutical manufacturing assembles that we choose to study with TOC.
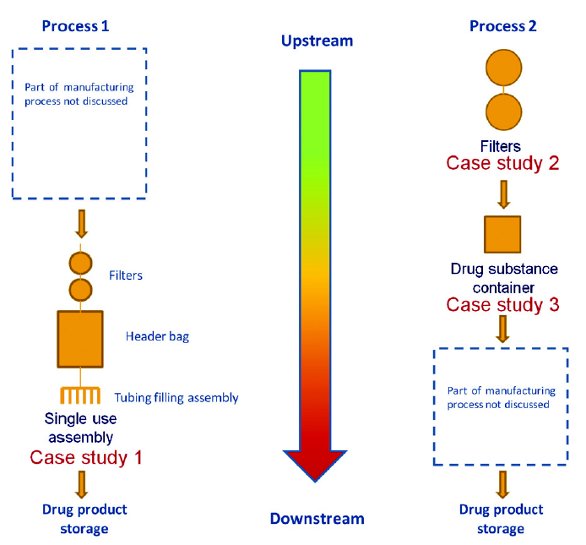 Figure 2. Simplifi ed manufacturing processes after risk assessment
From the processes illustrated, three case studies are presented here to demonstrate the benefits, the drawback and the potential use of the TOC technique in assessing risk from leachables derived from a manufacturing process. As shown in the graphic, the risk from leachables increases the closer the manufacturing process producing leachables is to drug product storage. Hence there is less opportunity for mitigation of leachable level through dilution or other means.
Case Study 1 illustrates a custom-made single-use manufacturing assembly used in the secondary manufacturing process in Figure 2. It is formed of 2 filters, a 20L header bag and tubing to connect all components to the needles used for filling. Each component has been assessed for leachables using TOC as an analysis tool.
Case Study 2 shows TOC measurements on 2 filters used in the primary manufacturing process in Figure 2.
Case study 3 demonstrates how TOC is used to monitor a processing bag used to store and transport the drug substance solution from the primary to the secondary manufacturing process in Figure 2. Two types of bags were investigated for storage and transport at either 5°C or -40°C.
The TOC analysis can only be performed with a carbon-free solvent system. This limitation required the solvent used for the studies to be carbon-free. For Case Study 1, pure deionized water was used. For Case Studies 2 and 3, deionized water with added hydrochloric acid was used to bring the pH down to 5.5 and to simulate an acidic formulation. In all the case studies, samples were collected directly into TOC vials, and capped prior to their analysis. Dependant on the formulation, this surrogate system may infl uence how accurate the systems simulation is.
Case study 1: A Study of a Complete Drug Manufacture Assembly
The custom-made single-use assembly was partly disassembled to study the fi lter assembly, the bag and the tubing separately to determine which component might be responsible for leaching the most material.
Case Study 1a: The Filter Assembly
The filters from the assembly were flushed with around 800mL of deionized water. The flushed water was collected as fractions collecting 2.5mL, 5mL, 10mL, 20mL and finally 40mL fractions as the 800mL passed through the assembly. The fraction sizes were varied as the expected TOC values got lower. The collection of increasingly larger fractions from the beginning to the end of the experiment was decided for two reasons:
- To obtain a precise assessment of the leaching profile when decreases in TOC levels are at their largest with small fractions collected at the beginning
- To flush enough liquid through the filter assembly with large fraction at the end.
The leaching profile from the fi lters is presented in Figure 3.
 Figure 3. Leaching profi le from the fi lters in the custom-made single-use assembly
As illustrated above, there is a rapid decrease in the amount leached from the fi lter assembly during the fi ltration step. The observed TOC levels for the fi rst fractions collected from the fi lters are shown to be around 10ppm. However, in the chosen set-up (See Figure 2) the custom-made single-use assembly positions the fi lters before the header bag. This has the eff ect of pooling the material leached from the filters in the fi ltered solution during the manufacture. The total amount of leachable material transferred from the filter assembly to the solution was calculated to be around 1000μg in total when scaled to full manufacturing volume. The calculation was made from the area under the curve presented in Figure 3.
The exposure of leachables to a patient is based on the expected clinical use. In this example, it means a patient will be typically dosed with one and a half vials of drug product.
The batch volume is 5000mL and during manufacture, 1mL of drug product solution is fi lled in each vial from the single-use assembly.
Since the contribution from the fi lter assembly has been calculated at 1000μg, this means it is distributed into 5000 vials equating to 0.3μg per day exposure for a patient. If the manufactured batch size is 10L instead of 5L, the contribution from the filter assembly goes down to 0.15μg per day for a patient.
Case Study 1b: The Header Bag
In the second part of this case-study, the header bag was fi lled with 5000mL of deionized water as a worst-case scenario (highest leachable concentration) although manufactured batches could be made in the range from 5L up to 10L. Samples were collected directly from header bag then analyzed by TOC. The header bag was positioned flat on the bench (to maximize surface contact) at room temperature and shaken at regular intervals to increase the transfer of possible leachable material from the polymeric layers to the liquid solution. The bag solution was sampled several times over a 55 hour period. The sampling rate was greater at the beginning, with 8 determinations during the fi rst 24 hours of contact and then once a day, thereafter.
The leaching profile from the header bag is presented in Figure 4.
 Figure 4. Leaching profi le from the header bag in the custom-made single-use assembly
It can be seen that measured TOC levels increase as the storage time of water in the header bag is increased. The observed TOC level for the header bag is around 0.5μg/mL after storing the deionized water for 2 days. However, typical storage periods might be only a few hours. A value of 0.5μg/mL equates to a maximum of 0.75μg per day exposure for a patient. If the manufactured batch size is 10L instead of 5L, the contribution from the header bag drops to 0.38μg per day exposure for a patient.
Case Study 1c: The Tubing from the Filling Assembly
Separately, the tubing from the filling assembly was fl ushed in a similar manner to the filter assembly with 2.5mL, 5mL, 10mL, 20mL and finally 40mL fractions of deionized water being collected then analyzed by TOC. Due to design of the experiment, multiple tubing lines (six in total) were collected together. The leaching profi le from the tubing of the filling assembly is presented in Figures 5.
As illustrated in Figure 5, there is a single value of 0.8μg/mL prior to the maximum value of 8μg/mL, which is reached after 6mL has passed through the assembly. However, in our process, a purge of 15mL is typically discarded. If this volume is considered, this brings the highest TOC level from 8μg/mL down to 2μg/mL. Additionally, as six lines were sampled together, this value can be further divided by six, to represent amounts entering from a single tubing line. This brings the TOC level down to 0.33μg/mL.
 Figure 5. Leaching profi le from the tubing of the fi lling assembly in the custom-made single-use assembly
Unlike what is happening with leaching material from the fi lter assembly, all the material leached from the tubing of the filling assembly is transferred directly into the vials of drug product (see Figure 2) there is no pooling of material. Theoretically, there will be higher amount of leachables in some vials than others. The vials manufactured first will have greater amounts than those manufactured later.
The worst-case scenario contribution (based on 0.33μg/mL in a vial) from the tubing of the filling assembly is as high as 0.33μg of leachable material per vial or 0.5μg per day for a patient.
Although only 800mL of water was passed through the filter assembly and the tubing from the filling assembly during the simulated manufacture experiments, it is possible to fit a curve through the data collected and then extrapolate for volumes up to 5L.
Figure 6 shows the simulated leaching profi les based upon combining header bag, fi lter assembly and tubing from filling assembly worstcase estimates. It has been calculated the maximum potential level of leachable material transferred to the patient from the custom-made single-use assembly could be as high as 1.6μg per day for a patient based on a clinical use of 1.5 vials per day. If the manufactured batch size is 10L instead of 5L, the contribution goes down to 1μg per day for a patient.
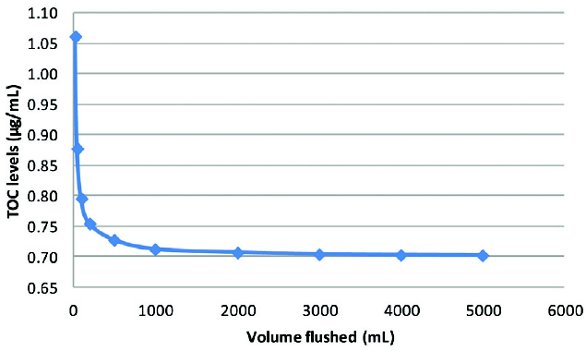 Figure 6. Simulated leaching profi le for the custom-made single-use assembly
Conclusions from Case study 1
Following on from these experiments there are several points to consider when using TOC analysis to assess risk from the manufacturing process.
Our calculation assumed “worst case” of patients receiving drug product manufactured from highest values measured in each part of the system and with a small batch size.
Our “worst cast“ can be considered as highly unlikely. When a 5L batch of drug product is manufactured, there are a total of 5,000 vials fi lled, or 10,000 vials for a 10L batch size.
The level of leachable material observed is based on TOC values and therefore corresponds to an amount of carbon. For each type of molecules involved, whether it is a plastic or polymeric material, the TOC level will be a lower than actual amount of substance. It can be considered approximately one third lower since most molecules contain a minimum of 66% carbon. If this correction factor is applied to the TOC values, it leads to a level of leachable material transferred to the patient from the custom-made singleuse assembly of 1.65μg per day for a patient based on a clinical use of 1.5 vials per day. This level compares to the reporting threshold set at 1.5μg per day that represents a negligible risk to patients even if the components were genotoxic.
Given there is no evidence of toxic materials and the overall exposure levels are low, the conclusion reach from these studies is that the custom-made single use assembly is suitable for use.
Case study 2: a study of two Filters in a typical manufacturing process
In this study, the two filters were connected to each other and flushed with around 110L of deionized water acidified with hydrochloric acid to pH 5.5. The flushed liquid was collected as 1L fractions. The filters were flushed with 12L and left idle for a period of time to simulate the manufacturing process. Then the filters were fl ushed in a similar manner another 8 times.
The leaching profile from the filters is presented in Figure 7.
 Figure 7. Leaching profi le from the fi lters in the primary manufacturing process
The TOC values are decreasing rapidly during the first 12L flushed through the filters. The TOC value of the first 1L fraction collected after the fi lters were left idle is higher than the last 1L fraction collected before the filters were left idle. This diff erence in TOC values is getting less significant when the fi lters have been fl ushed with large volumes of liquid. Data from the TOC measurements provide a ready measure of amount of leachables potential delivered from the filters. Most of the amounts of leachable material transferred from the fi lters to the solution corresponds to the first 24L flushed and is equal to 56 mg.
Conclusions from Case study 2
In this example, 24L of liquid containing 56mg of leachables from the filters could be used to produce 1200 doses of drug product. The exposure to patient from potential leachables is therefore equal to 47μg per day. The leachable levels are far above the 1.5μg per day limit and thus they warrant further study to identify them. However, TOC has provided a rapid and simple mechanism to identify that need.
Case study 3: a study of two diff erent bioprocessing bags
This case study focuses on two bioprocessing bags. The bags were fi lled with 12L of deionized water acidifi ed with hydrochloric acid to pH 5.5 to refl ect their use in the manufacturing process. Typically, the bags are used either to store liquids at 5°C or frozen solid at -40°C.
However, to study the worst-case scenario, the bags were positioned fl at on the bench (to maximize surface contact) stored at room temperature and shaken at regular intervals to increase the transfer of possible leachable material from the polymeric layers to the liquid solution. As in Case Study 1 for the header bag, the bag solutions were sampled several times over a 3-4-month period. The sampling rates were greater at the beginning with six determinations during the first month of contact and then once a month thereafter.
The two bags under study are made with the same polymeric layers, the layer in contact with the fluid being thicker for bag B than bag A. The leaching profile from the bags is presented in Figure 8.
 Figure 8. Leaching profi le from the bag in the primary manufacturing process
Results and Conclusions from Case study 3
It can be seen that the difference in layer thickness is producing two diff erent leaching profiles. The TOC values for bag A are increasing sharply over 2-3 days to reach an asymptotic level at 1.5μg/mL compared to those for bag B increasing less quickly during 60 days to reach a higher asymptotic level at 3.5μg/mL.
These two profiles are similar in shape to the one from the header bag in Case Study 1 where the asymptotic TOC level was at 0.5μg/mL.
In case study 1, the similar size bag was fi lled with a much lower volume of liquid (5L instead of 12L) it might be expected that it should have shown a much higher TOC level. However, the header bag used here was different in composition and has an extra polymeric layer as the contact layer, which appears to limit the leaching process.
The total amounts of leachable material transferred from bags A and B to the solution are equal to 18mg and 42mg respectively.
If the bags were used to store drug product they would contain the equivalent of 600 doses. Therefore the exposures to patient from potential leachables are equal to 30μg per day for bag A and 70μg per day for bag B.
Clearly, the studies were performed at room temperature rather than expected storage temperature of 5°C or -40°C. These results are greater than the 1.5μg per day reporting threshold by a signifi cant margin.
Once again, TOC has demonstrated more analyses are required. However, when the solutions from bag A and B were analyzed by GC and HPLC no signifi cant leachables were detected. Further analysis of the solutions by ion chromatography (IC) allowed the detection of an organic anion explaining around 50% of the TOC levels.
This additional testing provided a better understanding of the content of the solutions but mass balance was still not achieved. The results indicate that diff erent separation and identifi cation methods will be required to fully characterize the leachables from the bags.
Overall Conclusions
The analysis of the samples by TOC has proven very useful to get an accurate profi ling of the leaching process. The method is quick, easy and very sensitive.
In Case Study 1 the overall TOC level detected in the custom-made single-use assembly was below the reporting threshold. There was no need to use other analytical methods for the separation and identification of leachable components. The secondary manufacturing process where the custom-made single-use assembly was utilized was determined to be low risk. Time and money were saved as no time-consuming method development and validation had to be performed, and no lengthy characterization was necessary.
As can be seen, process design can play a part in the results. If the filters had been positioned after the header bag, the amount of leachable materials transferred to the solution would have been greater. The header bag would not limit the importance of the leaching process from filters by acting as a buffer zone. For a 5L batch this means that the TOC value would have been as high as 5.3μg per day. The maximum level of leachable material transferred to the patient from the custom-made single-use assembly would have been as high as 7.9μg per day.
In Case Study 2, the TOC level detected in the filters was far above the reporting threshold. It has highlighted the limitations of the technique when used in isolation to get a pass or fail in a limit test. Clearly the clinical use of the drug product played a major part in the final results too. For example, where a 1mL dose is used, the levels would be less than 1.5μg per day (0.5μg per day) which is considered to be a negligible patient exposure. However, if the dose is 100mL the patient exposure from potential leachables is far greater and equal to 47μg per day based on a TOC value.
In Case Study 3, the TOC level detected in the bags was also far above the reporting threshold. An attempt at elucidating the content of the solutions with another analytical technique led to a 50% reduction in the exposure to patient from potential leachables. Here the clinical use was also a factor.
Moreover, the results demonstrated the need to look for a wide variety of compounds some of which are not currently detected by conventional techniques. Examples of this are polymeric compounds, which are major constituents of disposable systems.
Author Biographies
Jason Creasey is a graduate Analytical Chemist. He has worked for GlaxoSmithKline since 1990, working full-time in the area of extractables and leachables since the mid 1990’s. Over that time he has seen demand in this area grow exponentially. He is currently the director of a team of analytical chemists who are responsible for GSK’s support for E&L activities across a wide range of product types including OINDP and Parenterals. He has had the pleasure of commenting on PQRI guidelines on E&L for GSK and the E&L section in EMEA guidelines on inhalation and nasal products. Jason is a member of several external groups concerned with the development of best practice guides for extractable and leachables issues, these include the IPAC-RS material working group, and the polymer forum and Extractable and Leachable Safety Information Exchange, otherwise known as ELSIE. He recently co-authored one of the chapters in the newly published book entitled, “Leachables and Extractables Handbook: Safety Evaluation, Qualification, and Best Practices Applied to Inhalation Drug Products”.
Vincent Thibon, Ph.D., is a senior analytical scientist with 13 years experience in the pharmaceutical industry currently working for GSK in Stevenage and is part of the leachables and extractables team. He completed his undergraduate studies in France and went on to obtain his Ph.D. from the University of Leeds. Vincent held successive positions at Huntingdon Life Sciences, GSK Consumer Healthcare, and Pfizer. His current role is to provide analytical support to biopharmaceutical projects. Vincent’s main focus is to assess the safety of single-use assemblies (bags, filters and tubing) used in the primary or secondary manufacturing processes by performing risk assessments followed by mitigation studies.
References
- Container Closure Systems for Packaging Human Drugs and Biologics, FDA guidance document , May 1999
- Regulation USP<661>: Physicochemical tests,<381>: Physicochemical tests
- CPMP, Guidelines on the limits of genotoxic impurities (June 2004)
- CPMP, Guideline on plastic primary packaging materials (February 2004)
- CFR 21 part 170.39 Threshold of regulation for substances used in food-contact articles.
- ICH Validation guidelines: Federal Register, Vol. 62, March 19, 1997, pages 27463– 27467).
- Application of the threshold of toxicological concern (TTC) to the safety evaluation of cosmetic ingredients R. Kroes et al. Food and Chemical Toxicology 45 (2007) 2533–2562
- Q8 (R1) Pharmaceutical Development Revision 1, CDER/CBER Draft Guidance 1/10/2008.
- Q9: Quality Risk Management, Published in the Federal Register, Vol. 71, No 106, pages 32105-32106, June 2, 2006.
- “Evaluation of Extractables from Product –Contact Surfaces”, Biopharm International, Dec. 2002, pg 22-34.
- Markovic I. 2007. Expert Opinion on Drug Safety 6(5):487-91.
- Wakankar AA , on developing a process for conducting extractable-leachable assessment of components used for storage of biopharmaceuticals., J Pharm Sci. 2010 May;99(5):2209-18.
- Proposal for Reporting and Qualification Thresholds for Leachables in Parenteral and Ophthalmic Drug Products. PODP Leachables and Extractables Working Group, March 2007, Product Quality Research Institute (PQRI).
- Douglas Ball, Development of Safety Qualification Thresholds and Their Use in Orally Inhaled and Nasal Drug Product Evaluation, Toxicological Sciences 2007 97(2):226-236; doi:10.1093/ toxsci/kfm058.
- Kroes R, Renwick AG, Application of the threshold of toxicological concern (TTC) to the safety evaluation of cosmetic ingredients, Food & Chemical Tox.,45(2007),2533-2562
- I.C. Munro, R.A. Ford, E. Kennepohl and J.G. Sprenger, Correlation of structural class with noobserved- effect levels: a proposal for establishing a threshold of concern, Food Chem. Toxicol. 34 (1996), pp. 829–867
- Pharmaceutical cGMPs for the 21st Century - A Risk-Based Approach, FDA Final report, 2004
- Kenyon, MO, Cheung J.R, An evaluation of the sensitivity of the Ames assay to discern lowlevel mutagenic impurities, Regul. Toxicol. Pharmacol., 48 (2007), 75-86
- The right analytical method for the right application: TOC analysis for cleaning validation, technical paper, GE
- Sajid, S. Shahnawaz; Arayne, M. Saeed; Sultana, Najma, Validation of cleaning of pharmaceutical manufacturing equipment, illustrated by determination of cephradine residues, Analytical methods (2010), 2(4), 397-401.