Introduction
Raman scattering spectroscopy is a standard tool in most analytical chemistry laboratories and it is an established method for speciation, structural analysis, and quantification of pharmaceutically active compounds [1, 2]. Even structurally similar compounds can be distinguished from each other. As an example, Fig. 1 displays the Raman spectra of two C20 polyunsaturated fatty acids (PUFA); the omega-3 PUFA all-cis-5,8,11,14,17-eicosapentaenoic acid (EPA) and the omega-6 PUFA all-cis-5,8,11,14-eicosatetraenoic acid (arachidonic acid, AA). Both molecules differ from each other only by a single unsaturated C-C bond. Medical studies have shown these compounds provide the possibility to treat cardiovascular disease, stomach ulcers, stomach cancer and Alzheimer’s disease and have an effect on the metabolism of mammalian and leukemia cells and human fibroblasts [3]. A detailed analysis of the vibrational spectrum can be found in the literature [3]. Interestingly, both AA and EPA are synthesized by microalgae [4, 5], and hence offer a possibility for their production in bioreactors.
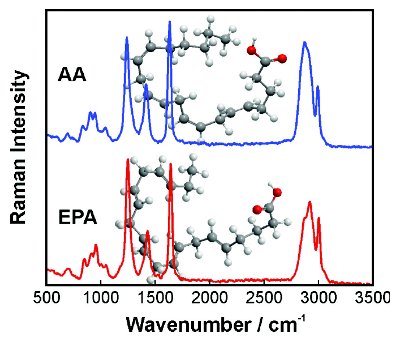
Figure 1. Experimental Raman spectra of arachidonic acid (AA) and eicosapentaenoic acid (EPA). The 3D structures of both PUFAs are shown in the background.
Owing to its versatility, Raman spectroscopy has potential as a tool for monitoring the production of pharmaceutically active compounds in bioreactors: (1) it is suitable for molecular fingerprinting, (2) it allows quantitative measurements, (3) it is less sensitive to water than absorption techniques, and (4) it can in principle directly be applied through the transparent walls of photobioreactors. However, in many practical applications, the Raman signal is superimposed by a spectrally broad and often strong laser-induced fluorescence (LIF) emission, which makes the evaluation of experimental data difficult and may require sophisticated custom-made data processing algorithms. This is particularly true for biotechnological systems which contain a large number of different compounds, many of which may fluoresce when illuminated with light of suitable wavelength.
Methods for Fluorescence Suppression
In this article, we focus on experimental approaches to fluorescence suppression. One possibility to overcome this problem is to remove the fluorescing species from the sample in an initial separation procedure or to chemically convert it into a non-fluorescing species [6]. However, this approach may be expensive and time consuming. Moreover, it may be not applicable at all when inline measurements in a process are the objective or when the species of interest exhibits intrinsic fluorescence. Consequently, it is not an option in most practical applications.
Alternatively, a number of methods have been developed for avoiding or suppressing fluorescence signals in Raman experiments. The most common approaches are based on the careful selection of the excitation wavelength. For example, a near-infrared laser source can be employed, in most cases with a wavelength of 785 or 1064 nm [7]. LIF emission is typically a result of electronic excitation. NIR radiation has relatively low photon energy and hence electronic transitions are not excited. A drawback of this approach, however, is that the scattering cross section and hence the Raman signal intensity is directly proportional to λ-4. Moreover, most detectors have relatively low quantum efficiency in the NIR and IR spectral range. Therefore, obtaining suitable signal-to-noise ratio may be a challenge and require high laser power and/or long acquisition times. Another option is to employ a deep-UV laser source with a wavelength300 nm while the Raman spectrum occurs below 300 nm. An advantage of this approach is the large Raman cross section and resonance-enhancement resulting in strong Raman signals. Disadvantages however are the need for larger spectrometers in order to obtain good spectral resolution. Moreover, the UV photons may photo-dissociate the molecules in the sample and hence the technique may not be non-destructive any longer.

Figure 2. a) Schematic Raman spectrum with fluorescence interference in part of the spectral range; b) schematic Raman spectra for two diff erent excitation wavelengths; c) SERDS spectrum calculated from the spectra in b); d) Raman spectrum reconstructed from the SERDS spectrum.
Fluorescence suppression can also be obtained by exploiting the difference in the polarization properties of Raman scattering and LIF emission. For this purpose, a linearly polarized laser must be used and the signal must be recorded polarization-resolved. In particular for small molecules in the gas phase, the Raman signal conserves the polarization state of the incident light while the fluorescence signal is virtually unpolarized. Consequently, the polarization technique has proved itself to be very useful in gasphase systems, e.g., in combustion diagnostics [9]. However, large molecules and condensed phase matter may exhibit significant Raman depolarization due to symmetry properties or they may reveal an apparent depolarization owing to optical activity [10]. The latter is likely in systems of pharmaceutical interest as many pharmaceutically active compounds are chiral.
Shifted-excitation Raman Difference Spectroscopy
Another technique for suppressing fluorescence interference in Raman analysis is shifted-excitation Raman difference spectroscopy (SERDS) [11-15]. In SERDS, advantage is taken of the fact that internal conversion, e.g. ro-vibrational relaxation processes, in electronic excited states is much faster than fluorescence emission. As a consequence, fluorescence typically occurs from the vibrational ground state of the excited electronic state – virtually independent of the excited ro-vibronic transition. In other words, the fluorescence signal will remain the same even if the wavelength of the excitation radiation is slightly shifted. On the other hand, the Raman scattering is strictly related to the excitation wavelength and hence it will shift together with the incident light wavelength. Consequently, when two spectra are recorded with slightly different wavelength they exhibit the identical fluorescence background and shifted Raman signals. The SERDS approach is illustrated in Fig. 2. Figure 2a shows a schematic Raman spectrum recorded in the presence of a broad fluorescence background. For simplification, the Raman signals are represented as narrow peaks and the fluorescence as a single broad one. In practical applications, the situation may be more complicated, for example, when the fluorescence background and the spectrally broad Raman bands of water overlap. Recording a second Raman spectrum with slightly shifted excitation wavelength results in the data displayed in Fig. 2b. The narrow Raman peaks are spectrally shifted while the broad fluorescence background remains the same. Subtraction of the two spectra yields the SERDS spectrum shown in Fig. 2c. It is free of fluorescence and when the wavelength shift is sufficiently small it basically represents the first derivative of the Raman spectrum in our simplistic example. Hence, a simple one-dimensional integration of the SERDS spectrum can deliver a reconstructed fluorescence-free Raman spectrum. The result of the integration of the SERDS spectrum in Fig. 2c is plotted in Fig. 2d. The spectrum reveals that the fluorescence background is effectively suppressed. We note that in systems of high molecular complexity, the reconstruction requires more sophisticated numerical techniques.
In addition to the relatively straightforward approach, an advantage of SERDS is that it can be performed using standard Raman setups. The only pre-requisite is that they must be equipped with a tunable light source such as a diode laser [16, 17] and the wavelength shift must be carefully selected according to the bandwidth of the light source and the spectral resolution of the detection system [18].
In conclusion, since shifted-excitation Raman difference spectroscopy offers the advantages of conventional Raman spectroscopy plus effective fluorescence suppression, it is a promising approach for applications as a monitoring technique in bioreactors, where it can be employed for tracking and optimizing the production of pharmaceutically active compounds in the presence of fluorescing molecules [19].
Acknowledgements
The authors thank Matthias Schirmer and Rainer Buchholz, Institute of Bioprocess Engineering at the University of Erlangen-Nuremberg for providing the fatty acid samples. Financial support from the German Research Foundation (DFG) is gratefully acknowledged for funding parts of this work and the SAOT within the framework of the German Excellence Initiative to Promote Science and Research at German Univeristies.
Author Biographies
Dr. Johannes Kiefer is a Senior Lecturer in Chemical Engineering at the University of Aberdeen, Scotland and he holds a permanent guest professorship of the Erlangen Graduate School in Advanced Optical Technologies at the University of Erlangen-Nuremberg, Germany. His research interests are the areas of applying spectroscopic techniques for the characterization of advanced materials and processes.
Dipl.-Ing. Kristina Noack M.Sc. is a final year Ph.D. student at the Institute of Engineering Thermodynamics and the Erlangen Graduate School in Advanced Optical Technologies at the University of Erlangen-Nuremberg, Germany. She holds degrees in Chemical and Bio Engineering from Erlangen-Nuremberg and Biotechnology from Busan, Republic of Korea. Her research is the development of novel instrumentation for bioreactor monitoring.
Prof. Dr. Dr. h.c. Alfred Leipertz is Chair Professor and Head of the Institute of Engineering Thermodynamics and Director of the Erlangen Graduate School in Advanced Optical Technologies at the University of Erlangen-Nuremberg, Germany. His research includes the characterization of nanomaterials, the determination of thermophysical properties in process fluids, and laser diagnostics in combustion systems.
References
- Wen Z-Q, Cao X and Phillips J 2010 Application of Raman spectroscopy in biopharmaceutical manufacturing American Pharmaceutical Review 13.
- Buckley K and Matousek P 2011 Recent advances in the application of transmission Raman spectroscopy to pharmaceutical analysis Journal of Pharmaceutical and Biomedical Analysis 55 645-652.
- Kiefer J, Noack K, Bartelmess J, Walter C, Dörnenburg H and Leipertz A 2010 Vibrational structure of the polyunsaturated fatty acids eicosapentaenoic acid and arachidonic acid studied by infrared spectroscopy J. Mol. Struct. 965 121-124.
- Bhakuni DS and Rawat DS 2005 Bioactive marine natural products (New York: Springer).
- Spolaore P, Joannis-Cassan C, Duran E and Isambert A 2006 Commercial applications of microalgae Journal of Bioscience and Bioengineering 101 87-96.
- Schroeder PA, Melear ND and Pruett RJ 2003 Quantitative analysis of anatase in Georgia kaolins using Raman spectrosocopy Applied Clay Science 23 299-308.
- Meyer MW, Lupoi JS and Smith EA 2011 1064 nm dispersive multichannel Raman spectroscopy for the analysis of plant lignin Anal. Chim. Acta 706 164-170.
- Liu C and Berg RW 2013 Nonlinearity in intensity versus concentration dependence for the deep UV resonance Raman spectra of toluene and heptane Appl. Spectr. Rev. 48 425-437.
- Egermann J, Seeger T and Leipertz A 2004 Application of 266-nm and 355-nm Nd : YAG laser radiation for the investigation of fuel-rich sooting hydrocarbon flames by Raman scattering Appl. Opt. 43 5564-5574.
- Kiefer J and Kaspereit M 2013 Determination of the Raman depolarization ratio in optically active samples Analytical Methods 5 797-800.
- Perez Kaiser D, Maiwald M and Schmidt H 2012 Method for generating and for detecting a Raman spectrum Patent EP2480868A1, US20120162641, WO2011033017A1.
- Shreve AP, Cherepy NJ and Mathies RA 1992 Effective rejection of fluorescence interference in Raman spectroscopy using a shifted excitation difference technique Appl. Spectrosc. 46 707-711.
- Zhao J, Carrabba MM and Allen FS 2002 Automated flurescence rejection using shiftedexcitation Raman difference spectroscopy Appl. Spectrosc. 56 834-845.
- De Luca AC, Mazilu M, Riches A, Herrington CS and Dholakia K 2010 Online fluorescence suppression in modulated Raman spectroscopy Anal. Chem. 82 738-745.
- Sowoidnich K and Kronfeldt HD 2012 Shifted excitation Raman difference spectroscopy at multiple wavelengths for in-situ meat species differentiation Appl. Phys. B 108 975-982.
- Maiwald M, Erbert G, Klehr A, Kronfeldt HD, Schmidt H, Sumpf B and Trankle G 2006 Rapid shifted excitation Raman difference spectroscopy with a distributed feedback laser emitting at 785 nm Appl. Phys. B 85 509-512.
- Maiwald M, Schmidt H, Sumpf B, Erbert G, Kronfeldt HD and Trankle G 2009 Microsystem 671 nm light source for shifted excitation Raman difference spectroscopy Appl. Opt. 48 2789-2792.
- Martins MAS, Ribeiro DG, Pereira dos Santos EA, Martin AA, Fontes A and Martinho HS 2010 Shifted-excitation Raman difference spectroscopy for in vitro and in vivo biological samples analysis Biomedical Optics Express 1 617-626.
- Noack K, Dilk C, Schirmer M, Klein BC, Kiefer J, Buchholz R and Leipertz A 2012 Raman difference spectroscopy approach for monitoring of a bioreactor Conference on Lasers and Electro-Optics (CLEO) Paper CM1F4.