Introduction
The development and implementation of an online water bioburden analyzer (OWBA) offers the potential to improve pharmaceutical water system operations, reduce costs, and ensure water quality. An OWBA is not intended to eliminate, but rather to reduce compendial water testing. The overall concept of an OWBA is comparable to an online total organic carbon (TOC) system, i.e., an online analyzer that provides real-time bioburden monitoring data and process control feedback capability. An OWBA can be a risk reduction tool, providing business benefits through the following measures:
- Labor Reduction (Resource Allocations)
- Decreased frequency of sampling and laboratorybased testing through on-line monitoring and system optimization
- Product Quality and Process Understanding
- Reduced investigations to bioburden excursions through continuous water monitoring
- Increased process understanding and product safety through real-time monitoring
- Improved responsiveness to microbiological excursions
- Real-time release of in-process intermediates, process buffers/solutions and ingredient water
- Energy Savings
- Less frequent heat sanitization cycles through verification of system capability
- Reduction of operating temperatures of hot water systems
The OWBA Workgroup Focus
In an effort to guide the development and implementation of an OWBA from its inception, a collaborative workgroup was formed, comprised of eight representatives from seven companies. By leveraging lessons learned through assessment and implementation of various rapid microbiological methods (RMM) and process analytical technologies (PAT) across the healthcare industry, the primary goal of this workgroup is to provide guidance regarding the development of OWBA systems that would be broadly accepted by the industry and regulators. To facilitate this goal and engage instrument vendors, the OWBA workgroup has developed three key documents – a user requirements specification (URS), a testing protocol, and a business benefits proposal.
- The URS provides fundamental OWBA system design requirements, as well as additional desirable attributes.
- The testing protocol provides a list of verification and performance tests which the vendor can apply to demonstrate system capability and operation.
- The business benefit guidance provides the financial justification for both vendors and industry to drive the successful implementation of an OWBA platform.
Design Considerations
The challenge of designing a fit-for-purpose instrument is to segregate base requirements from novel and nice-to-have features. The workgroup identified the system primarily as an online unit, with portability as a secondary feature; many concepts were adapted from our experience with the implementation of online TOC instrumentation.
As compared to traditional laboratory-based methods, online monitoring offers early indication of system excursions and provides process engineers and quality groups the ability to ensure the water used for manufacturing meets quality requirements prior to use. Traditional bioburden and endotoxin testing are performed retrospectively, and only through initial validation and trending of historical data is confidence developed regarding microbial process control.
The USP and Ph. Eur. water compendial limits of 100 colony-forming unit (CFU)/mL for purified water (PW) and 10 CFU/100 mL for water for injection (WFI) are the traditional bioburden requirements for water quality. However, current water sampling techniques, e.g., 100 mL samples collected once per day, are limited in their ability to identify changes in ongoing water system performance and pose restrictions regarding trend analysis, since such ‘grab’ samples only provide a snapshot of the dynamic water system. Continuous monitoring, in contrast, may allow for a more accurate and constant surveillance of water system status.
A significant challenge in developing a real-time microbiological measurement technology is the designation of a measurement unit, since we move from the colony forming unit to alternative bioburden measurements. The OWBA workgroup has adopted the term ‘microbe equivalent’ (microbe eq or μeq) as a new unit to enable a unified approach to understanding and discussing the measurement systems that do not use CFU associated with growth-based plate count methods. Because detection does not require microbial growth, measurement results may differ from CFU and thus, current compendial limits may not be applicable. Nonetheless, monitoring and trending of microbe equivalents still provides a relevant measure of water system performance.
The concept of an OWBA as a critical utility monitoring tool may require placement in a manufacturing facility’s “gray space”, or uncontrolled/ less-controlled areas. Therefore, ruggedness to unfavorable temperature and/or humidity conditions is emphasized as a key design consideration. Additionally, sanitization cycles may subject the OWBA to stress factors including extreme pH, ozone, pressure fluctuation, or elevated temperatures during routine operation. Continuous online measurement should produce data at short intervals, e.g., every 3-5 minutes. The OWBA should possess sufficient sensitivity to be able to detect changes in water systems with low bioload. Moreover, the instrument should be sufficiently robust and accurate to only require periodic calibration. The potential for a multiplex manifold capability to monitor several locations simultaneously may have value, but may only be realizable at the cost of increased complexity and maintenance.
Implementation and Business Benefits
The concept of microbiological monitoring of water systems consists of two aspects: main water loop and points-of-use testing. The goal of main loop water monitoring is to provide assurance of the quality of the entire system, whereas the individual point-of-use testing evaluates water used in discrete manufacturing processes.
Specifically, main loop monitoring should provide answers to whether control procedures for the water loop are effective and whether there is build-up of biofilm with subsequent shedding of microbial aggregates into the water system. Information on the state of a water loop may either be inferred from reviewing microbiological test results from all points-of-use fed by that particular loop, or by additional monitoring of Critical Control Points (CCP). CCPs are typically identified as junction points for several sub-loops or the “worst-case” testing location that can provide a great amount of coverage for a water system.
As mentioned previously, the second aspect of microbiological monitoring of water systems is ensuring that the water introduced into manufacturing processes does not exceed a certain microbiological contamination level. Such quality control of the water should be performed directly at the points-of-use from which the water is introduced into the process, and should also include all piping, hoses, etc., which may be a source of microbial contamination. For the remainder of this article, such testing will be referred to as “Point-Of- Use Testing” (POU).
The implementation of the OWBA at a pharmaceutical manufacturing site would typically involve a feasibility test to evaluate current (baseline) water system microbial levels and compare these to the on-line measured “microbe equivalents (μeq)” of the OWBA. The challenges of verifying the CFU to μeq correlation are daunting; however, such a comparison may enable users to define control limits for μeq measured by the OWBA. Many of the OWBA’s initial business benefits comprise complementary, non-compendial risk reduction roles rather than complete replacement of current compendial testing.
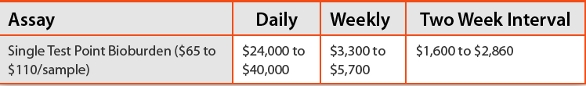
Reduced testing is the simplest role for the OWBA, allowing a move to decreased sampling and laboratory-based testing frequencies. The vision for OWBA implementation would be to place a unit at a strategic location in the water loop e.g., CCP) and continuously monitor the μeq. With growing confidence and body of historical data, compendial laboratory-based monitoring may gradually be replaced by monitoring through the OWBA. Such an implementation strategy may be particularly suitable for CCPs. The practical implementation of CCP monitoring requires alert or action limits based on historical data and provides assurance that the water system remains in a state of control; whether these control limits are expressed as CFU or any other measurement unit is less relevant in that context. Furthermore, once a solid data basis for water loop status is established and continuously monitored, the testing frequency of individual POU may also be reduced in a risk-based manner. A move from daily to weekly (86% reduction) or biweekly (93%) compendial testing reduces the labor of sampling, handling, testing, and reporting the data for each sampling location. Thus, potential savings strongly depend upon the current test frequencies within each manufacturing facility.
Estimates for a single bioburden test range from $65 to $110 per sample, based on standard accounting methods considering laboratory supplies, overhead, and labor costs. Based on the type(s) of products manufactured, typical manufacturing facilities may maintain between 40 and 200 POU sampling points and up to 20 loops. The number of CCPs depends upon the water system design; typically, at least one CCP exists for each loop, which could be monitored by an OWBA. Table 1 provides exemplary calculations of cost savings achievable through reduced testing frequency for a single test point. The cost savings for a manufacturing facility is predicated on the number of test points and would be reduced by the depreciated capital cost and operating costs associated with multiple OWBA instruments.
Table 1. Estimated Annual Cost for Bioburden Sampling, Testing and Data Reporting
Process Understanding - Online Surveillance
Compendial testing methods suff er from the disadvantage that microbiological water quality can only be assessed in retrospect, e.g., 5 days after sampling, when the water has already been long used in the manufacturing process. When signifi cant bioburden is detected in the test samples, an investigation is initiated and batch disposition reviewed. This leads to pressure to justify the continued use of water in the manufacturing process, which may or may not have met specifi cations. Knowing the microbiological quality prior to use and reacting to impending out-of-specifi cation trends reduces both fi nancial loss and regulatory risk.
When used to monitor CCPs on-line, a real-time water bioburden analyzer will detect changes in microbiological water quality in a particular loop several days earlier than is possible with compendial testing methods. While these situations may be somewhat rare in a well-designed and operated water system, the value of early detection should not be underestimated. Since signifi cant contamination of a water loop impacts multiple manufacturing areas, the number of potentially aff ected batches may be substantial if such contamination is observed with several days delay.
In the case of a bioburden excursion during POU testing, timely data which demonstrates that the water loop has always been in a state of control will immediately focus investigation efforts on the point-of-use, rather than questioning whether the elevated microbial counts are consequence of loop and/or water system contamination. Thus, additional analyses in the course of the investigation differentiating POU from loop as the source of the excursion are eliminated. Furthermore, the overall investigation effort may be smaller and thus the time expended reduced since possible root causes for the microbial excursion are already narrowed from the beginning of the investigation.
In addition, POU monitoring would also become possible when an OWBA system is portable. In such a setup, the product contamination risk through ingredient water could be signifi cantly reduced, since the loop would continuously be monitored and an individual point-of-use examined prior to withdrawal of water.
Green Initiatives
Environmental awareness is becoming more common in pharmaceutical companies. Energy usage by HVAC, heat (steam), and water systems is the second largest cost (after labor costs) for many facilities. The duration, frequency and eff ectiveness of heat and chemical sanitization cycles of a water system are based on historical monitoring data and system validation. Based on the large amount of additional data generated by an OWBA, sanitization cycles could be optimized and operating temperatures reduced, resulting in signifi cant energy savings. Furthermore, the water hold times for storage tanks may be extended based on continuous bioburden monitoring, resulting in water and energy cost savings.
Extended water hold times based on measured water quality rather than demonstrated hold times has the opportunity to impact both the dumping of usable water as well as decreased energy costs associated with water manufacturing. For a Midwest manufacturing facility, the production costs for purifi ed water and WFI are $160 per 10,000 L and $350 per 10,000 L, respectively; this is a conservative estimate for the generation of pharmaceutical waters. The validated hold time at the facility is 4 days for a 9,000 L purifi ed water system. The annual cost for water generation for a smaller loop is more than $13,000; increasing the hold time by two days is a 30% yearly savings for water generation.
Another example for cost savings through green initiatives is the energy required to heat a loop for sanitization. At 100% heating process effi ciency, assuming a water volume of 10,000 L and a temperature increase by 60 K (e.g. from 20 °C to 80 °C), the theoretical energy consumption is 700 kWh. However, since heating processes realistically operate at approximately 33% effi ciency, the actual energy consumption can be estimated to be at least three times that high. Assuming the above scenario, reduction of heat sanitization frequency from daily to every second day would lead to annual energy savings of 378,000 kWh. With an electricity price of 15 cent per kWh, this would result in approximately $55,000 savings per year.
Reduction of Human Error
Costs associated with human error during traditional water sampling and testing are challenging to quantify, but are well known to each manufacturing company. For the following example we will conservatively assume that 1% of investigations are due to human related failure (i.e., error during sampling, lab contamination). The typical cost for the investigation of a possible sampling and testing error for a WFI pointof- use ranges between $5,000 and $18,000. A large pharmaceutical company estimates water testing at 100,000 samples per year; based on the estimate of $15,000 per investigation, and 10% CCP samples which could be covered by an OWBA rather than by manual sampling, up to $150,000 could be saved by alleviating investigations of human error.
Outlook and Next Steps
The OWBA workgroup has provided the user specifications, testing protocols and business benefits estimates to identified water instrumentation manufacturers. The feedback to date has been positive; the workgroup is encouraged to further share information and would welcome feedback from other industry stakeholders. Additionally, the workgroup encourages vendors to disseminate information regarding feasibility and proof-of-concept testing across the industry and regulatory agencies, with the intent of accelerating the acceptance and widespread adoption of OWBAs. The concept of “no savings for any company until acceptance and implementation” should drive collaboration and open sharing of experiences garnered during evaluation of OWBA systems.
The OWBA workgroup intends to support external collaborations with industry and vendors with the goal of presenting data to a larger forum. Longer term roles for the system may include: pre-sterilization in-process bioburden, water system qualification, filling line monitoring, investigations. As technology matures, the workgroup will encourage professional organizations to implement chapters and best practices for online water bioburden analysis.
For further information or to collaborate, please contact Jeffrey Weber, coordinator of the online water bioburden workgroup at jeffrey.w.weber@pfizer.com.