Protein Analytical Chemistry
Introduction
Inherent to protein biosynthesis, including the synthesis of therapeutic monoclonal antibodies (mAbs), are heterogeneous protein products. Such heterogeneities include post-translational modifications (PTMs), misincorporations, and mistranslations.1,2 mAbs are also susceptible to chemical degradation throughout production, purification, formulation, transportation, storage, and use.3,4 To ensure product quality and safety, pharmaceutical regulatory authorities require extensive characterization of physiochemical and biological properties of manufactured drug substances and drug products during pharmaceutical development.1,2
Some analytical techniques applicable to the characterization of mAbs and their modifications include ion exchange chromatography, size exclusion chromatography, isoelectric focusing, amino-acid analysis, reversed-phase chromatography, and mass spectrometry.2,5-7 Peptide mapping by reversed-phase chromatography coupled to UV and/or mass spectrometry (MS) is a commonly used technique for the identification, characterization, and quantitation of mAbs. Here we present a rapid, Ultra High Performance Liquid Chromatography (UHPLC)-High Resolution Mass Spectrometry (HRMS) peptide mapping method for monitoring PTMs of previously characterized mAbs. The reproducibility and linearity of the method were tested through the separation of tryptic peptides by a fast, 13-minute gradient, and detection of native and modified peptides using HRMS and accurate mass measurements. This method permits rapid, targeted in-process monitoring and relative quantitation of mAb chemical degradation products.
Experimental Procedures
Tryptic Digestion
A 250-μg sample of mAb1 was reduced with 20 mM DTT in 6 M guanidine hydrochloride, 360 mM Tris, and 2 mM EDTA at pH 8.6 for 1 hour. The reduced sample was cooled to room temperature and alkylated using 1 M iodoacetic acid (final concentration, 50 mM) for 15 minutes in the dark. The sample was then buffer-exchanged into digestion buffer (25 mM Tris, 2 mM CaCl2, pH 8.2). The buffer-exchanged sample was digested with trypsin for 4 hours at 37°C using a 1:50 (w/w) enzyme to substrate ratio. The digestion was stopped by addition of 10% formic acid to a final concentration of 0.3%.
UHPLC-HRMS Analysis
Table 1. UHPLC Gradient Parameters
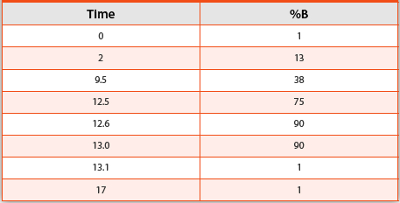
Tryptic digests were analyzed using a UHPLC coupled to quadrupole-orbitrap mass spectrometer. Separation of a 10-μg injection was performed on a charged-surface hybrid C18 column with 1.7 μm, 130 Å particles running a flow rate of 0.3 mL/min at 77°C. Mobile phase A was water, and mobile phase B was acetonitrile, each containing 0.1 % formic acid. The gradient is shown in Table 1. Full scan accurate mass data were acquired at a resolution of 17,500 in positive ion mode scanning from 200 to 2000 m/z. External calibration of the instrument was conducted prior to sample analysis. Data were processed using instrument vendor software specific for biopharmaceutical characterization.
Oxidative Stress Conditions–mAb1
An oxidatively stressed sample of mAb1 was prepared by incubating 2,2’-Azobis(2-amidinopropane) dihydrochloride (AAPH) with 1.25 mg of mAb1 for 16 hours at 37°C. After 16 hours, the AAPH was quenched by adding excess methionine (Met) to the solution.
Results and Discussion
The objective of this study was to determine the suitability of a rapid UHPLC-HRMS peptide map method for monitoring relative amounts of chemical degradation in a previously characterized biotherapeutic mAb. To gauge the efficiency of the digestion and capability of the MS data acquisition method, sequence coverage for mAb1 was determined. Oxidation of Met was used to assess the suitability of the method to monitor PTMs. Four tryptic peptides containing Met were monitored: 2 native peptides (NativeP1 and NativeP2) and their oxidized counterparts (oxP1 and oxP2, respectively). The peak areas, retention times, and percent oxidation for each Met-containing peptide were used to evaluate the reproducibility and linearity of the method.
Data Processing
Relative quantitation of Met oxidation was generated as follows:
- Peak areas were calculated by integrating extracted ion chromatograms of the monoisotopic m/z using the most abundant charge state for the native tryptic peptide and its oxidized counterpart.
- The oxidized peak area was divided by the sum of the oxidized and native peak areas and multiplied by 100 to obtain percent oxidation.
Considerations for MS-only Peptide Mapping
When used for characterization, peptide mapping by LC-MS/MS relies on MS data collection for PTM identification and MS/MS fragmentation for localization of the PTM.8 In order to achieve sufficient resolution, peak shape, and signal of peptides in the mixture, conventional HPLC often requires long gradient times (>90 minutes) and a resulting reduction in sample throughput.9-12 UHPLC enables the use of small particles (sub-2 μm), increasing separation efficiency and peak capacity.13,14 Additionally, researchers have shown that UHPLC improves retention time (<0.5% RSD) and peak area (<5.0% RSD) reproducibility.15,16 UHPLC yields sharper, narrower peaks, making the scan speed of the mass spectrometer a limiting method parameter. By operating the mass spectrometer in MS-only mode, the scan speed and duty cycle of the instrument is increased, and a sufficient number of data points per peak can be collected.
High-Resolution Mass Accuracy–Peptide Identification
As no MS/MS data are collected, this UHPLC-HRMS peptide map method relies on accurate mass measurements for peptide identification. To illustrate the effectiveness in using accurate mass measurements for identification, several in silico digestions were performed to determine the expected peptide masses arising from a tryptic digest of mAb1. Our calculations took into account up to 2 missed cleavages and up to 6 charges on each possible peptide. When only unmodified peptides were considered, 3 sets of peptides were identified with calculated masses within 8 ppm of each other. In all cases, however, the charge states of the peptides differed and thus could be differentiated from each other.
Single oxidations occurring at all Met and tryptophan (Trp) amino acids in mAb1 were also considered. Five additional sets of peptides were identified with calculated masses within 8 ppm. One of the 5 additional sets of peptides could again be differentiated based upon charge state. The remaining sets of peptides had identical charge states, but were the results of missed cleavages, and therefore would be less likely to occur. Notably, the remaining sets of peptides had >5 ppm calculated error. The quadrupole-orbitrap instrument is capable of delivering <5 ppm RMS with external calibration. Therefore, MS-only data collection with this HRMS instrument would allow for differentiation between these remaining sets of peptides.
The mass accuracy of full scan HRMS data was calculated for the 4 Met-containing peptides monitored. We examined the mass accuracy for +1, +2, (P1 peptides) and +3, +4, and +5 (P2 peptides) charge states (Table 2). NativeP1, oxP1, NativeP2, and oxP2 peptides displayed mass accuracies within 5 ppm of the calculated mass. These results, combined with our theoretical calculations, underscore the power of high mass accuracy and demonstrate that identification of a previously characterized mAb does not absolutely require tandem MS data.
Table 2. Comparison of theoretical and observed masses for selected peptides

Sequence Coverage
Sequence coverage for mAb1 was determined using software, which does not require tandem MS data and can solely employ accurate mass measurements.17Figure 1 shows the total ion chromatogram (TIC) for the tryptic digest of mAb1. The sequence coverage for mAb1 was 94%, comparable to peptide maps utilizing longer gradients.8 The majority of the sequence not identified corresponded to a number of short peptides (1 to 5 residues), which likely eluted in the solvent front.
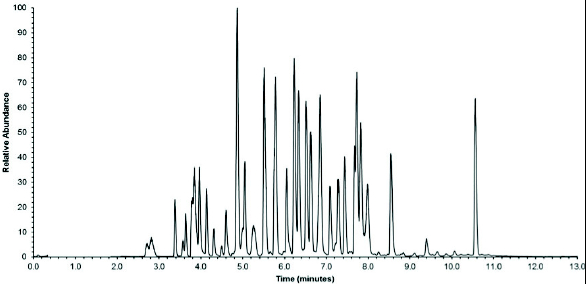 Figure 1. Total ion chromatogram (TIC) for the tryptic digest of mAb1 (13 min gradient).
Reproducibility
Five digests of mAb1 were prepared and injected in triplicate to assess the reproducibility of the sample digestion, preparation, and LC-MS analysis. Relative standard deviations (RSD) were calculated for peak areas, retention times, and relative quantitation of the oxidized Met peptides, shown in Table 3. The RSDs for all parameters did not exceed 10%. Peak areas for the individual peptides had the largest RSDs. RSDs for peak areas within individual digests did not exceed 3%, suggesting that the larger RSDs are due to varying digestion efficiencies (data not shown).
Table 3. Relative standard deviations for peak area, retention time, and relative percent oxidation

Linearity
To test the linearity of this method, an oxidatively stressed sample of mAb1 was analyzed. The oxidized mAb1 sample was subjected to the same digestion procedure outlined above with the average Met oxidation in this sample calculated at 19% and 11% for P1 and P2, respectively. Co-mixes of the oxidized and unoxidized mAb1 digests were then prepared (0%, 25%, 50%, 75%, and 100% oxidized mAb1 digest) and injected 6 times. Linear regressions were performed for each oxidized Met peptide in order to determine the linearity of the method. Linearity curves and R2 values obtained for the percent oxidation of each Met-containing peptide are shown in Figure 2. Both linearity curves give R2 values ≥0.99, indicating a strong linear correlation over the oxidation range tested.
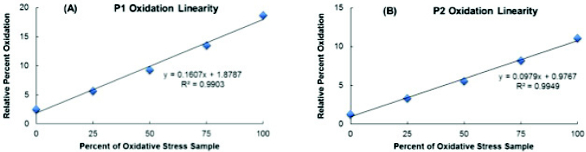 Figure 2. Linearity comparisons for P1(A) and P2(B) relative percent Met oxidation.
Conclusion
Characterization of mAbs and their PTMs is an important aspect in identification of critical quality attributes. LC-MS/MS peptide mapping is one method employed during characterization and is often intended for in-depth analysis of mAb PTMs. Once PTMs have been identified and characterized, however, fast and accurate MS-only methods capable of monitoring site-specific PTMs can be more suitable. Overall, this method provides satisfactory sequence coverage, reproducibility, and linearity, and can be used to monitor relative amounts of previously characterized mAb PTMs throughout pharmaceutical development.
References
- International Conference on Harmonisation; guidance on specifications: test procedures and acceptance criteria for biotechnological/biological products. Notice. Food and Drug Administration, HHS. Federal Register. Aug 18 1999;64(159):44928-44935.
- Berkowitz SA, Engen JR, Mazzeo JR, Jones GB. Analytical tools for characterizing biopharmaceuticals and the implications for biosimilars. Nat Rev Drug Discov. Jul 2012;11(7):527-540.
- Cromwell ME, Hilario E, Jacobson F. Protein aggregation and bioprocessing. The AAPS Journal. 2006;8(3):E572- 579.
- Wang W. Instability, stabilization, and formulation of liquid protein pharmaceuticals. International Journal of Pharmaceutics. Aug 20 1999;185(2):129-188.
- Haberger M, Bomans K, Diepold K, et al. Assessment of chemical modifications of sites in the CDRs of recombinant antibodies: Susceptibility vs. functionality of critical quality attributes. mAbs. Mar-Apr 2014;6(2):327-339.
- Beck A, Wagner-Rousset E, Ayoub D, Van Dorsselaer A, Sanglier-Cianferani S. Characterization of Therapeutic Antibodies and Related Products. Anal Chem. Jan 15 2013;85(2):715-736.
- Sandra K, Vandenheede I, Sandra P. Modern chromatographic and mass spectrometric techniques for protein biopharmaceutical characterization. Journal of Chromatography. A. Mar 28 2014;1335:81-103.
- Srebalus Barnes CA, Lim A. Applications of mass spectrometry for the structural characterization of recombinant protein pharmaceuticals. Mass Spectrometry Reviews. May-Jun 2007;26(3):370-388.
- Yi L, Beckley N, Gikanga B, et al. Isomerization of Asp- Asp motif in model peptides and a monoclonal antibody Fab fragment. Journal of Pharmaceutical Sciences. Mar 2013;102(3):947-959.
- Yu XC, Borisov OV, Alvarez M, Michels DA, Wang YJ, Ling V. Identification of codon-specific serine to asparagine mistranslation in recombinant monoclonal antibodies by high-resolution mass spectrometry. Anal Chem. Nov 15 2009;81(22):9282-9290.
- Liu H, Ponniah G, Neill A, Patel R, Andrien B. Accurate determination of protein methionine oxidation by stable isotope labeling and LC-MS analysis. Anal Chem. Dec 17 2013;85(24):11705-11709.
- Yu XC, Joe K, Zhang Y, et al. Accurate determination of succinimide degradation products using high fidelity trypsin digestion peptide map analysis. Anal Chem. Aug 1 2011;83(15):5912-5919.
- Wu N, Clausen AM. Fundamental and practical aspects of ultrahigh pressure liquid chromatography for fast separations. Journal of Separation Science. May 2007;30(8):1167-1182.
- Rodriguez-Aller M, Gurny R, Veuthey JL, Guillarme D. Coupling ultra high-pressure liquid chromatography with mass spectrometry: constraints and possible applications. Journal of Chromatography. A. May 31 2013;1292:2-18.
- Rapid Peptide Mapping Method with High Resolution Using a sub 2-μm Column. Available at: https://www. chem.agilent.com/Library/applications/5990-4712EN. pdf. Accessed September 18, 2014.
- High Resolution and Rapid Peptide Mapping of Monoclonal Antibody Using an Agilent 1290 Infinity UHPLC and an Agilent 6550 iFunnel Q-TOF LC/MS System. Available at: http://www.chem.agilent.com/Library/ applications/5991-3600EN.pdf. Accessed September 18, 2014.
- Thermo Scientific PepFinder Software. A New Paradigm for Peptide Mapping For Conclusive Characterization of Biologics. Thermo Fisher Scientific Inc. Available at: http://www.thermoscientific.com/content/dam/tfs/ATG/CMD/cmd-documents/bro/bro/ms/lcms/software/BR-64051-PepFinder-BR64051-EN.pdf. Accessed September 18, 2014.