The trend in the biopharmaceutical industry is for clinical products to be available as high concentration formulations, allowing for administration to the patient at low dose and frequency while also satisfying a shelf-life of up to 2 years. This requires the biological to be present at high concentration within a formulation that is both low in viscosity and not prone to aggregation. Developing such formulations can be challenging, and there is considerable emphasis today on understanding the relationships and processes that contribute to successful high concentration formulations, and the mechanisms leading to aggregation.
Central to the successful development of these stable formulations is the ability to predict sample behavior at high concentration based on measurements made on the dilute solutions available at the early stages of development. Achieving this aim reduces the risk and associated costs of failure further downstream. This article looks at some of the benefits of automating the non-destructive measurement of 2 parameters of protein formulations that are increasingly studied in order to predict biopharmaceutical behavior in formulation. These parameters are the second virial coefficient (A2, also known as B22) and the dynamic virial coefficient or dynamic light scattering (DLS) interaction parameter (kD). Both are measured using light scattering techniques.1,2
The Use of Light Scattering Techniques
Analytical techniques based on light scattering are widely used within the biopharmaceutical industry for screening biotherapeutic candidates and formulations. Historically, light scattering technologies that measure at the submicron level have occupied a monitoring role within formulation development. A classic example is the use of DLS to measure the hydrodynamic size of proteins in solution and to test for the appearance of protein aggregates during stress testing. Static light scattering (SLS) is widely used in association with size exclusion chromatography (SEC) to determine protein molecular weight and is fundamental to many SEC-driven aggregation studies. However, SLS can also measure molecular weight in a batch or ensemble type of measurement.
With respect to the 2 parameters that are the focus of this article, the second virial coefficient (A2) is measured using static light scattering and the dynamic virial coefficient, or DLS interaction parameter (kD), using DLS. Traditionally measurement has been made using light scattering techniques operating in batch mode. This can be a lengthy process necessitating the preparation of various concentrations of a sample, with associated time-consuming sample transfer and cuvette cleaning steps. More recently, the advent of new platforms has made possible the automation of both DLS and SLS measurements, making potentially predictive protein analysis faster and more accessible. Working at an early stage in drug development tends also to mean working with a restricted amount of sample, so there is a renewed emphasis on post-measurement sample recovery.
Targeting Predictive Parameters
Protein stability is a function of various parameters and light scattering is widely used to assist in screening for conditions that will enable a formulation to work effectively, often through monitoring aggregation temperature. This is done by measuring the hydrodynamic size of a protein formulation using DLS at progressively higher temperatures. At a particular temperature, the protein begins to aggregate. The temperature at which this occurs, known at the aggregation temperature (Tagg), is a signature for a specific protein under certain formulation conditions, and can change quite dramatically depending on what is in the formulation recipe. This is a simple way to monitor the thermal stability of proteins within different formulations.
More recently, light scattering is being used to predict what may happen under high concentration formulation conditions by studying behavior at relatively low concentrations and then extrapolating. One approach is to use KD, determined by examining DLS as a function of concentration. A second approach is to measure A2, which is determined from measurements of SLS as a function of concentration. These measurements at low concentration have been found to correlate with aggregation propensity, solubility, and viscosity under high concentration conditions.
A2 is representative of the pair-wise interaction potential between like molecules within a formulation and has been shown to have a strong correlation with sample solubility. If a sample has a negative A2, then the sample will tend to aggregate and come out of solution over time, whereas with a positive A2, a sample is more likely to stay in solution. A2 may, therefore, be used as a predictor of sample stability; however, there is a growing recognition that this value may also have wider reaching applications related to sample viscosity.1
KD is calculated from the concentration dependence of the measured diffusion coefficient of the sample and is often used to quantify protein interaction within solution. It, too, has been shown to correlate with stability and viscosity at higher concentrations. Samples with larger positive KD values at low concentration typically exhibit a lower propensity for self-association and aggregation, as well as lower viscosities at high concentrations. More information on the scientific principles that underpin these measurements can be found in online resources.3
Experimental Analysis
The following experimental data demonstrate how the use of A2 and KD as predictive markers correlates with aggregation measurements made at high concentration.
Examining aggregation temperature under formulation conditions
Figure 1, which shows the z average radius (hydrodynamic size) versus sample temperature, illustrates how the hydrodynamic size of an IgG monoclonal antibody prepared in 4 different buffer solutions responds to increasing temperature. The antibodies in Samples 1, 3, and 4 increase in hydrodynamic size when they reach the aggregation onset temperature for that formulation. The sample in Buffer 2, however, appears impervious to aggregation up to 90°C, and may, therefore, provide an effective base for further development.
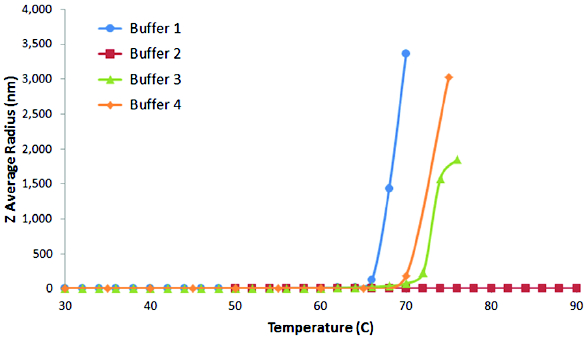 Figure 1. Increased temperature can lead to aggregation which can be monitored by the rise in average hydrodynamic size
Correlating low concentration behavior
The next stage is to look at low concentration behavior to see if it correlates with the behavior seen in the temperature change studies above. The formulations presented in Figure 1 were therefore revisited and those in Buffer 1 and Buffer 2 were studied further using DLS, at low concentrations up to 10 mg/mL, to examine changes in antibody size as a function of concentration. The plot in Figure 2 shows diffusion coefficient versus concentration: as the diffusion coefficient increases, size decreases. The effective diffusion coefficient (Dm) versus concentration can be fitted to a line and extrapolated to zero, D0. The gradient of the slope versus concentration gives KD, the DLS interaction parameter, as per the following relationship:
D= D0 (1 + KDC)
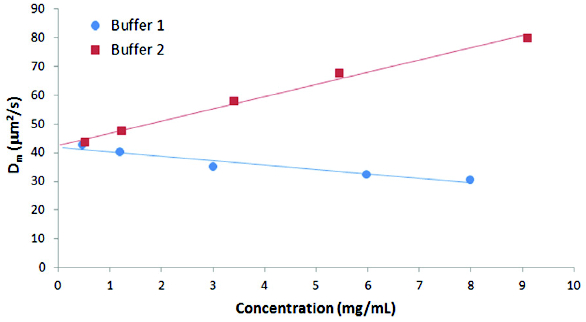 Figure 2. Concentration dependence of the measured diffusion coefficient for IgG in Buffers 1 and 2
In Buffer 1, it can be seen that the diffusion coefficient decreases with increasing concentration. This corresponds to an increase in hydrodynamic size and suggests that the sample is displaying selfassociation, which can lead to aggregation. Buffer 2 exhibits the opposite effect, with a decrease in hydrodynamic size as concentration increases. Research suggests that it is desirable to have a KD>0.
A further experiment uses SLS to examine intensity changes with concentration, using a Debye plot to describe the Rayleigh scattering ratio versus concentration. Figure 3 shows a comparison for the previous IgG monoclonal antibody in Buffers 1 and 2 along with a third buffer that contains a lactose stabilizer.
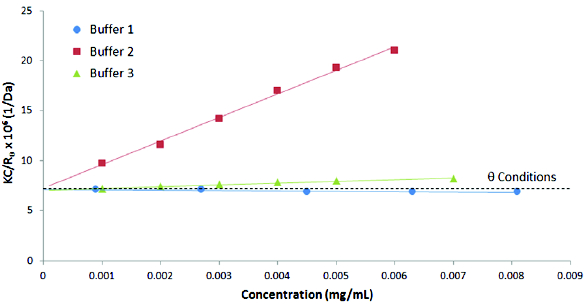 Figure 3. Debye plot for IgG in Buffers 1, 2, and 3
The second virial coefficient A2 is extracted from the slope of these plots. As seen in Figure 3, Buffers 2 and 3 both exhibit positive second virial coefficient values, which is an indicator of high solubility. Buffer 1 exhibits a negative second virial coefficient that indicates attractive interactions between molecules and a tendency to aggregation. Based upon empirical predictions, the preparation in buffer 2 would be expected to be the most stable and that in buffer 1 the least stable, with buffer 3 somewhere in between.4 This is in agreement with the thermal stability data shown in Figure 1, and emphasizes the value of these stability predictors during formulation design.
The Value of A2 and KD
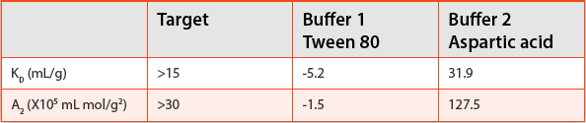
In a program to develop a specific target profile to develop a stable protein formulation, it is possible to set targets for the A2 and/or the KD parameters. For example:
With quick and simple procedures to determine the A2 and KD values, it becomes possible to work towards preferred formulation parameters and speed up assessment of formulation conditions. The example in Table 1 is a simple illustration of this approach, indicating the suitability of 2 different formulation buffers.
Table 1. Bioformulation stability profiles – IgG in Buffers 1 and 2
Accelerating A2 and KD Measurements
Standard single cuvette DLS instruments can be used with automated sample handling systems to speed up the measurement of A2 and KD. However, the sample volumes required may be too high for large scale protein screening in biopharmaceutical development where there is often a need to take measurements on extremely small amounts of sample. For high throughput protein formulation screening, a fully automated system that works with industry-standard 96- and 384-well plates and requires only very small sample volumes often provides a more appropriate solution. Such systems permit fast, fully automated screening, precise temperature control, and, in some cases, the ability to recover the sample following measurement.
The following description of how an automated plate-based light scattering instrument operates takes the Zetasizer APS as an example (shown in Figure 4). Previously used primarily for DLS, this system now also delivers SLS measurements, with advanced software that enables determination of both A2 and KD. Additional information is available in online resources.5
 Figure 4. Illustration of the multi-well plate holder, sampling system, and measurement cell of an automated light scattering system (Zetasizer APS, Malvern Instruments)
Reliable determination of A2 and KD, and therefore the ability to predict stability in a robust manner, requires high-quality light scattering analysis of every sample. Advanced well plate set-ups are designed to deliver the same critical requirements for sensitivity, accuracy, repeatability, reliability, and high data quality as batch measurements. To meet these requirements, automated plate samplers ensure precision sample handling environments by tightly controlling the temperature and cell quality during analysis. The cell and the plate are isolated from one another and are individually temperature controlled, allowing the samples to be kept at optimum conditions throughout the entire procedure. This ensures that each sample is measured with the same level of accuracy and precision as in batch measurements but with greatly improved analytical productivity.
Prior to analysis, a standard operating procedure (SOP) is built for individual samples or groups of samples detailing the measurement conditions required. The program runs a robotic arm with a low volume needle that takes samples from each plate and transfers them to a flow cell for light scattering analysis. The sample may then be discarded or returned to the plate for further analysis. The ability to recover the sample is particularly valuable as it enables rolling stability studies to be carried out on the same sample within the same SOP, further reducing the need for manual sample handling and preparation. The risk of cross-contamination is a concern to some people when considering automated analysis in a well plate format, but customizable washing procedures will ensure this is not an issue.
Maximizing Productivity
Identifying a suitable protein therapeutic formulation is a complex process, which typically requires substantial time and resources. By targeting formulation parameters during early stage screening that reliably predict stability and viscosity at high concentration, formulators can reduce the rate of costly target failures and accelerate the development towards clinical submission. Automated light scattering greatly reduces the analytical workload associated with generating these data sets while providing the same levels of accuracy and repeatability as batch based techniques.
References
- Yadav S, Shire S J, Kalonia D S. Factors affecting the viscosity in high concentration solutions of different monoclonal antibodies. J Pharm Sci. 2010;99:4812-4829.
- Saito S, Hasegawa J, Kobayashi N, Naoyuki K, Uchiyama S, Fukui K. Behavior of Monoclonal Antibodies: Relation Between the Second Virial Coefficient (B2) at Low Concentrations and Aggregation Propensity and Viscosity at High Concentrations. Pharm Res. 2011;29: 397- 410.
- Malvern Instruments. Developing a bioformulation stability profile. Available at: http://www.malvern.com/en/about-us/press-releases/news/PR2841-Developingbioformulation- stability-profile.aspx. Accessed November 25, 2014.
- AZoM.com Staff. Using Light Scattering and Micro-Capillary Viscometry To Develop Bioformulation Stability Profiles. AZO Network. January 31, 2014. Updated February 3, 2014. Available at: http://www.azom.com/article.aspx?ArticleID=10632. Accessed November 25, 2014.
- Malvern Instruments. Speed your way though your protein formulation screening by automating your measurements. Available at: http://www.malvern.com/en/support/ events-and-training/webinars/W140826ProteinFormulationScreening.aspx. Accessed November 25, 2014.
Author Biography
Stephen Ball is Product Marketing Manager, Nanoparticle and Molecular Characterization, at Malvern Instruments. He holds a degree in Computer Aided Chemistry from the University of Surrey, UK, which included a year in industry working as a research chemist for the Dow Chemical Company in Horgen, Switzerland. Before joining Malvern Instruments, he worked for Polymer Laboratories as an applications chemist, then took on a marketing position as a product manager for light scattering instrumentation at Agilent Technologies.