Introduction
As a result of enormous economic and technological changes in the international trade, globalization has been the new norm over the last few decades. U.S. FDA-regulated products account for about 20% of all imports into the United States, originated from more than 200 countries and territories and pass through more than 300 U.S. ports.1 Globalization has fundamentally altered the economic and security landscape and demands a major change in the way U.S. FDA fulfills its mission to promote and protect the health of the American people.2 Regulators in China (China FDA and Provincial Institutes for Food and Drug Control) are no exception. Medical and food products and their ingredients—which greatly affect Chinese public health and welfare—have been increasingly acquired from abroad. For instance, medical products imported into China have grown rapidly, with an annual rate of more than 10% from 2010 through 2014. In 2014, China FDA-regulated medical products accounted for the total value of $43 billion, with an 11.77% growth compared to 2013.3
According to the China Imported Medical Products Regulation Act, each lot of imported medical products must be inspected by China Coastal Regulatory Laboratories designated by the China FDA. Additional inspections are mandated for every 20 000 batches from the same lot. The China Shanghai Institute for Food and Drug Control (SIFDC) is the largest coastal regulatory laboratory for imported medical product inspections in China. In 2013, China SIFDC alone inspected more than 60 000 batches of imported finished drug products.
The U.S. FDA and China FDA do not and will not have the resources to adequately keep pace with the increasing pressure of globalization.1 Facing challenges that are similar to the U.S. FDA brought by globalization, Chinese regulators, such as SIFDC, have been seeking innovative, efficient, and effective solutions to ensure the product safety and quality in a global marketplace.
In the SIFDC, routine analytical methods used to inspect imported medical products include: high-performance liquid chromatography (HPLC), liquid chromatography-mass spectrometry (LC-MS), thin layer chromatography (TLC), HP-TLC, ultraviolet visible (UV-VIS), gas chromatography (GC), GC-MS, and atomic absorption spectrometry (AAS). Drug product inspection is always time-consuming and has to be performed in a traditional wet laboratory setting.4 In addition, drug product inspection is commonly focused on active pharmaceutical ingredients in the finished drug products instead of the entire dosage form.
The purpose of this study is to explore the feasibility of using rapid detection technologies of modern spectroscopic instruments coupled with offline chemometric data analysis in a regulatory laboratory setting, ie, handheld Raman, handheld near infrared (NIR), and portable Fourier transform infrared (FTIR) analyzers—to differentiate manufacturers of imported and domestic oxcarbazepine drug products in the Chinese market.
Experimental
Materials
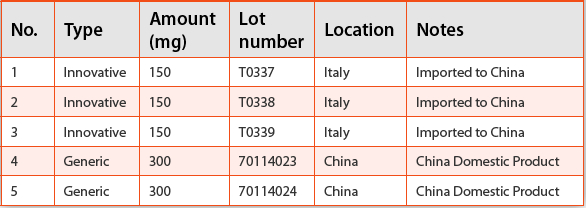
Oxcarbazepine reference standard (RS) (lot number: R02430) was provided by the U.S. Pharmacopeial Convention. Five different lots of oxcarbazepine tablets from 2 different manufacturers were provided by the China Shanghai Institute for Food and Drug Control. These 2 types of oxcarbazepine tablets have the same active pharmaceutical ingredient, oxcarbazepine, but both formulations are unknown, which means the ingredients of excipients in these 2 formulations are likely to be different since one is the innovative drug product while the other is the generic drug product. The sample information for all oxcarbazepine tablets is shown in Table 1.
Table 1. Oxcarbazepine Tablets
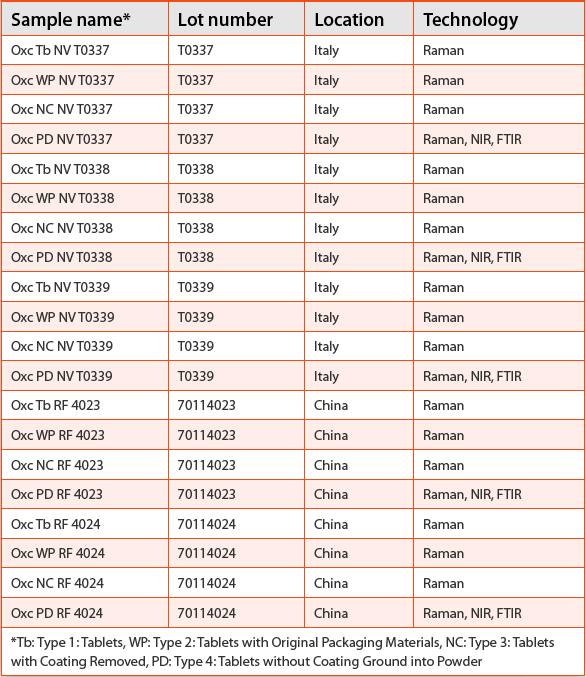
All 5 lots of tablet samples were prepared in 4 different ways before use in order to investigate and evaluate the effects from excipients in the tablet coating, as well as the original packaging materials— Type 1: Tablets, Type 2: Tablets with Original Packaging Materials, Type 3: Tablets with Coating Removed, and Type 4: Tablets without Coating Ground into Powder. A handheld Raman analyzer tested all 4 differently prepared sample types, while portable FTIR and handheld NIR analyzers only tested Type 4. Table 2 displays the rapid detection technologies used for all samples.
Table 2. Sample Preparation and Rapid Detection Technologies
Instruments
- Handheld Raman Analyzer: Raman spectra were acquired on a handheld Raman analyzer using the excitation wavelength at 785 nm. The optical parameters of the analyzer are shown in Table 3.
- Portable FTIR-ATR Analyzer: FTIR spectra were collected using a portable FTIR analyzer equipped with a single bounce diamond attenuated total reflectance (ATR) module. The optical parameters of the analyzer are given in Table 4.
- Handheld NIR Analyzer: Near IR spectra were collected using a pocket-size handheld NIR analyzer. The optical parameters of the analyzer are provided in Table 5.
Table 3. Optical Parameters of Handheld Raman Analyzer
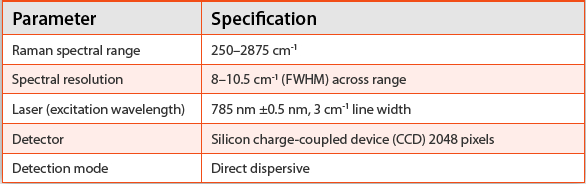
Table 4. Optical Parameters of Portable FTIR-ATR Analyzer
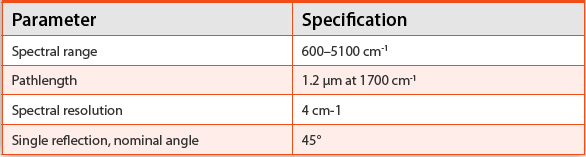
Table 5. Optical Parameters of Pocket-size Handheld NIR Analyzer

Methods
- Handheld Raman Analyzer: Raman spectra were acquired on a handheld Raman analyzer using an excitation wavelength of 785 nm. A cross-testing method was applied to distinguish all the samples from different manufacturers and different lots from the same manufacturer. The reference spectra of all samples were collected from the corresponding finished products. When testing against the reference spectra, all samples were scanned 6 times. The handheld Raman analyzer tested all 4 differently prepared sample types—Type 1: Tablets, Type 2: Tablets with Original Packaging Materials, Type 3: Tablets with Coating Removed, and Type 4: Tablets without Coating Ground into Powder. Raman spectra of Type 1 and Type 3 were collected in a tablet holder, while Type 2 and Type 4 were tested in a nose cone and vial holder, respectively.
- Portable FTIR-ATR Analyzer: Only Type 4 samples were suitable using the portable FTIR-ATR analyzer. Spectra were collected in the range of 4000–650 cm-1 (full range) and 1600–800 cm-1 (fingerprint region) for all samples in Qualitative Search mode. A reference spectral library was established from all the reference spectra. All sample spectra were compared against the reference spectra in the library and a hit-quality index (HQI) value (between 1.00 and 0) was used to indicate the correlation between the reference spectra and the sample spectra.
- Handheld NIR Analyzer: Similar to the portable FTIR-ATR analyzer, only Type 4 samples were suitable for the pocketsize handheld NIR analyzer. Spectra were collected in the range of 900–1700 nm for the samples. A reference spectral library was established from all the reference spectra. Offline data analysis using chemometrics then was applied.
Results and Discussion
Handheld Raman Analyzer Cross-Testing Results
Raman spectra of samples with 4 different preparation types from different manufacturers are shown in Figures 1 and 2. The results from the handheld Raman analyzer are shown in Tables 6–9. “Pass” results were given when a positive match was discovered by the instrument with a statistical assessment of P>0.05 (within the 95th percentile), while “Fail” results were given when no positive match was discovered by the instrument with a statistical assessment of P <0.05 (outside of the 95th percentile). The maximum P-value among the 6 repeated scans were recorded.
 Figure 1. Raman Spectra of Types 1, 2, 3, and 4 Samples from Manufacturer in Italy.
 Figure 2. Raman Spectra of Types 1, 2, 3, and 4 Samples from Manufacturer in China.
As shown in Table 6, when prepared samples of Type 1: Tablets were tested against the corresponding reference spectra, different manufacturers can be differentiated:
Table 6. Cross-Testing Results of Type 1: Oxcarbazepine Tablets
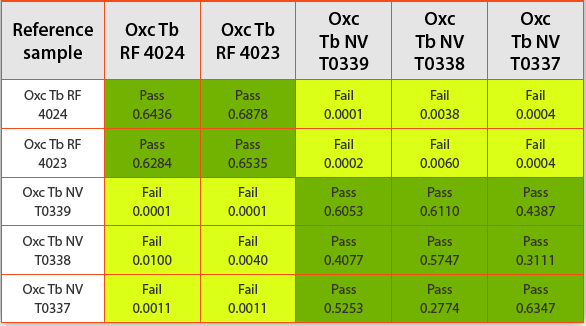
- All sample tests from the manufacturer in China were given “Pass” results when compared against the samples from the same manufacturer but different lot, but given “Fail” results when compared against the samples from the manufacturer in Italy
- All sample tests from the manufacturer in Italy were given “Pass” results when compared against the samples from the same manufacturer but different lot, while given “Fail” results when compared against the samples from the manufacturer in China.
As shown in Table 7, when prepared samples of Type 2: Tablets with Original Packaging Materials were tested against corresponding reference spectra, different manufacturers can be differentiated in most cases but mixed results are still present:
Table 7. Cross-Testing Results of Type 2: Oxcarbazepine Tablets with Original Packaging Materials

- All sample tests from the manufacturer in China were given “Pass” results when compared against the samples from the same manufacturer, but given “Fail” results when compared against the samples from the manufacturer in Italy except the samples of T0339 lot number, which was given both “Pass” for 3 times and “Fail” for 3 times and the sample of T0338 lot number, which was given both “Pass” for 1 time and “Fail” for 5 times
- All sample tests from the manufacturer in Italy were given “Pass” results when compared against the samples from the same manufacturer, but given “Fail” results when compared against the samples from the manufacturer in China, except the samples of T0339 lot number, which was given “Fail” against 4023 and both “Pass” for 5 times and “Fail” 1 time against 4024; T0338 lot number was given “Pass” 1 time and “Fail” 5 times against 4023.
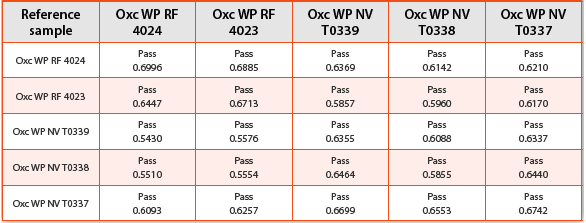
As shown in Tables 8 and 9, when the prepared samples of Type 3: Tablets with Coating Removed and Type 4: Tablets without Coating Ground into Powder, different manufacturers cannot be differentiated using handheld Raman analyzer since all sample tests were given “Pass” results.
Table 8. Cross-Testing Results of Type 3: Tablets with Coating Removed
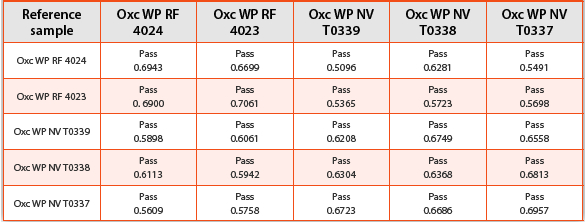
Table 9. Cross-Testing Results of Type 4: Tablets without Coating Ground into Powder
The results of 4 differently prepared types of samples by handheld Raman analyzer demonstrate the selectivity and specificity of Raman spectroscopy towards packaging materials, matrices of excipients in the coating, and tablet and formulations. Different manufacturers can be differentiated for Type 1: Tablets probably due to the different excipients used in the tablet coating where Raman can detect the differences at the excitation of 785 nm. Mixed results of Type 2: Tablets with Original Packaging Materials shows that the original packaging materials can interfere with Raman signal sometimes. The “False Positive” results of Type 3 and Type 4 display that after the removal of the coating, the handheld Raman analyzer cannot differentiate manufacturers probably because APIs in either tablet or powder produce much stronger Raman signals than excipients, which projects that the quality of APIs could be consistent in both finished drug products.
Principal Component Analysis Results
In order to validate the cross-testing results, an offline Principal Component Analysis (PCA) method was applied to the spectra collected by the handheld Raman analyzer. As shown in Figures 3–6, finished drug products from both manufacturers can be differentiated regardless of the sample preparation types. But different lots within the same manufacturers cannot be distinguished from each other. PCA results demonstrate that chemometrics can be powerful in spectroscopic data analysis. Especially in the case of “False Positive” cross-testing results using the handheld Raman analyzer, PCA can extract useful Raman information and build models without being affected by various factors, eg, fluorescence, spectral noise or poorly resolved peaks and others that can influence the “Pass / Fail” results.5
 Figure 3. PCA Results of Raman Spectra of Type 1: Oxcarbazepine Tablets
 Figure 4. PCA Results of Raman Spectra of Type 2: Tablets with Original Packaging Materials
 Figure 5. PCA Results of Raman Spectra of Type 3: Tablets with the Coating Removed
 Figure 6. PCA Results of Raman Spectra of Type 4: Tablets without Coating Ground into Powder
Portable FTIR-ATR Analyzer FTIR-ATR Spectra
Only Type 4: samples were suitable using the portable FTIR-ATR analyzer. FTIR-ATR spectra were collected in the range of 4000–650 cm-1. The fingerprint region of 1600–800 cm-1 was chosen for further data analysis shown in Figure 7.
 Figure 7. IR Spectra of Type 4: Tablets without Coating Ground into Powder
Hit-Quality-Index (HQI) Results
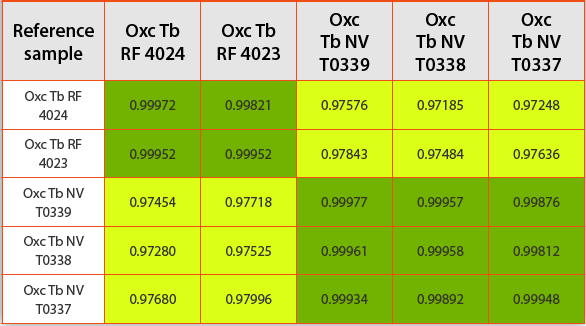
The HQI results of all samples in Type 4: Tablets without Coating Ground into Powder are shown in Table 10. The highlighted green areas display HQI values >0.999, indicating a high correlation, while the highlighted yellow areas display HQI values <0.980, indicating a much lower correlation. Therefore, finished products from 2 manufacturers can be differentiated. But different lots within the same manufacturers cannot be distinguished from each other.
Table 10. HQI Results of Type 4: Tablets without Coating Ground into Powder
Principal Component Analysis Results
In order to validate the HQI results, an offline PCA method was applied to the spectra collected by the portable FTIR-ATR analyzer. Baseline correction, normalization, and the 1st derivative were applied as data pretreatment. As shown in Figures 8 and 9, finished products from 2 manufacturers can be differentiated. But different lots within the same manufacturers cannot be distinguished from each other.
 Figure 8. PCA Results (2D Plot) of IR Spectra of Type 4: Tablets without Coating Ground into Powder
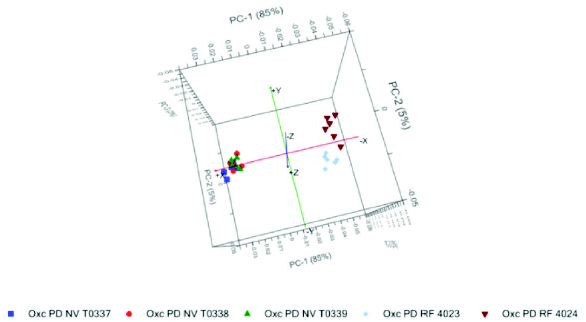 Figure 9. PCA Results (3D Plot) of IR Spectra of Type 4: Tablets without Coating Ground into Powder
Handheld NIR Analyzer NIR Spectra
Only Type 4 samples were suitable using the handheld NIR analyzer. NIR spectra were collected and the fingerprint region of 900–1700 nm was chosen for further data analysis shown in Figure 10.
 Figure 10. NIR Spectra of Type 4: Tablets without Coating Ground into Powder
Principal Component Analysis Results
PCA models were built for all NIR spectra collected by the handheld NIR analyzer. As shown in Figures 11 and 12, different than PCA results based on Raman and FTIR spectra, PCA results based on NIR spectra demonstrate that not only the finished products from 2 manufacturers can be differentiated, but also the different lots within the same manufacturers can be distinguished from each other.
 Figure 11. PCA Results (2D Plot) of NIR Spectra of Type 4: Tablets without Coating Ground into Powder
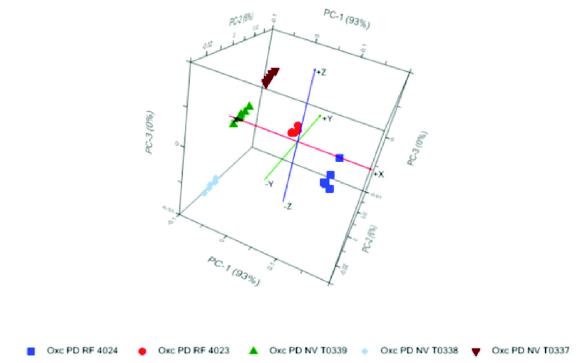 Figure 12. PCA Results (3D Plot) of NIR Spectra of Type 4: Tablets without Coating Ground into Powder
NIR spectroscopy has been used as a quantitative method in pharmaceutical applications, and is a promising tool in Process Analytical Technology (PAT) and Green Chemistry frameworks.6 PCA results from NIR spectra not only validated those of Raman and FTIR spectra, but also revealed the differences among different lots. This demonstrates that NIR is a highly sensitive and effective spectroscopic method for process monitoring solid samples.7
Summary
This study explored an orthogonal approach using handheld Raman, portable FTIR, and handheld NIR analyzers coupled with offline chemometric data analysis to rapidly differentiate different manufacturers of imported and domestic oxcarbazepine drug products in the Chinese market in a regulatory laboratory setting. The active pharmaceutical ingredients in the finished drug products, as well as the original packaging materials, coatings, and the entire solid dosage forms, were tested using this orthogonal approach. The results from Raman, FTIR, and NIR are complementary to each other, and also provide the necessary cross-validations in this study.
Because each spectroscopic technology has its own advantages and disadvantages, users need to be mindful that the use of such technologies is not without limitations, and validation should be in place to obtain reliable results.
All 3 handheld and portable analyzers demonstrate the benefits of using spectroscopic technologies for potentially assisting regulatory agencies in adopting innovative, efficient, and effective solutions while facing the increasing challenges of imported drug product inspections.
References
- U.S. Department of HHS, U.S. FDA. FDA Strategic Priorities 2014–2018, 2014.
- U.S. FDA. A Special Report, Pathway to Global Product Safety and Quality, 2011.
- China Center for Food and Drug Control International Exchange. Regulatory News, 2015.
- Ma B, Huong LTT, Liu Y, Kamel MM, Zhao E. Rapid detection of counterfeit drugs of ethambutol hydrochloride and cefuroxime axetil using handheld Raman, near infrared and portable FTIR technologies. Amer Pharm Rev. July-August 2015:54-61.
- Luczak A, Kalyanaraman R. Portable and benchtop Raman technologies for product authentication and counterfeit detection. Amer Pharm Rev. November 2014.
- Chavez PF, Bleye CD, Sacré PY, Rozet E, Hubert P, Ziemons E. Validation methodologies of near infrared spectroscopy methods in pharmaceutical applications. Eur Pharm Rev. 2013;18:3-6.
- Scheibelhofer O, Sacher S, Khinast JG. Near infrared light spectroscopy: applicability and new developments. Eur Pharm Rev. 2014; 19:3-7.
Author Biographies
Bei Ma provides scientific and business development expertise in identifying and pursuing business opportunities that support the public health mission and global strategy at the United States Pharmacopeial Convention (USP). Her focus has also been in developing and implementing USP global public health initiatives and programs in East Asia and Asia Pacific Region.
She currently serves at APEC Regulatory Harmonization Steering Committee Detection Technology Working Group. She also serves as a scientific board member at the organizing committee and Food Safety Symposium Co-Chair at IFPAC®—2015 Food Quality, Safety & Analysis Symposium. She is a member of American Chemical Society and Society of Applied Spectroscopy.

Linbo Wang has worked at China Shanghai Institute for Food and Drug Control (SIFDC) since 2003. He currently is the director of Free Trade Zone Laboratory at SIFDC, responsible for pharmaceutical research and development.
He obtained his MS and BS degrees in Pharmaceutical Analysis at China Pharmaceutical University in 2003 and 2000. He serves as the National Laboratory Accreditation Auditor (ISO 17025:2005) and National Accreditation Auditor for Food Laboratory for China National Accreditation Service for Conformity Assessment (CNAS).