Introduction
Quality by Design (QbD) concepts described in ICH Q8-101-3 can be applied to understand, reduce, and control sources of variability in pharmaceutical manufacturing processes. As explored in a recent USP stimuli article,4 these same concepts can be applied to an analytical method if the method is considered to be a process with the output being a reportable result. This article provides an example illustrating how QbD concepts can be applied to the optimization of HPLC method conditions.
The QbD approach as applied to analytical methods is a science- and risk-based approach that leverages a broad knowledge base (compared to traditional method development, validation, and transfer) gained throughout the method lifecycle. Recent articles have discussed how to apply QbD concepts to analytical methods.4,5 It begins with establishing criteria for the reportable results that will be generated by the method. These criteria are captured in the Analytical Target Profile, or ATP. Once criteria are established, a technique is chosen that has the potential to meet ATP criteria and method development activities ensue. Method development activities should follow a scientifically sound, systematic process to identify suitable method conditions.6,7,8
Method development activities may include iterations between risk assessments and experimental studies, including designs of experiments, to build a suitable knowledge base that clearly identifies the effect of chromatographic parameters on the performance of the analytical procedure and identifies regions of robust operating conditions. Once method development is complete, the method is verified against the ATP criteria9,10 and a robust control strategy is established based on the wealth of data available. The method is then implemented for routine use where continual verification takes place. The appropriate phase of the lifecycle can be revisited if changes to the analytical procedure are needed.
This article focuses on the method development phase of the lifecycle for an HPLC drug substance assay and purity method. It illustrates how systematic method development, risk assessment tools, and experimental studies, including DoEs, can be leveraged to yield significant method understanding that ultimately leads to a robust control strategy and reduced variability.
Method Design
The method development goal was to identify suitable chromatographic conditions to measure drug substance assay and impurities that could be transferred to the testing laboratory for routine use. The drug substance contains a number of specified and unspecified process related impurities with a range of specification limits. However, the focus of this article is 3 impurities, Compounds 1, 2, and 3, where the separation was identified as critical. In order to ensure the quality of the drug substance, it is important to ensure that proper peak identification and quantification is accomplished.
The initial chromatographic separation of the drug substance and its related substances was developed using a systematic workflow. The development strategy used is an earlier version of the analytical QbD reversed-phase liquid chromatography method development workflow previously published by Reid et al.8 In the first step, a suitable column, mobile phase pH, and organic modifier were chosen from a 3-method screen as shown in Table 1. The selection of initial conditions was based primarily on the specificity and peak shape of the active pharmaceutical ingredient and its related substances. In the second step, gradient and column temperature were optimized. Data generated from a 6-point experimental design (whereby 2 gradient slopes and 3 column temperatures were evaluated) were imported into in-silico chromatographic simulation software. The software was used to optimize the gradient and column temperature conditions for resolution, run time, and robustness. During this exercise it was noted that a number of the impurities were sensitive to temperature, including the 3 impurities that are the main focus of this article. The resolution of 1 of the critical pairs was improved at 65°C; this was chosen as a starting point for further evaluation (Table 1).
Table 1. UHPLC Screening Method Conditions

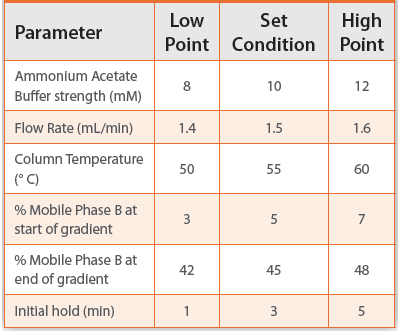
The starting chromatographic conditions were a UHPLC method using the BEH C18 column. Based on business requirements, the method was translated to traditional HPLC by scaling the gradient and flow rate and optimizing the separation. The C18 column was used as it is the HPLC version of the BEH C18. Changing to HPLC required lowering the column temperature as some older HPLC instruments have a maximum temperature of 60°C. The initial set conditions for the HPLC method are presented in Table 2.
Table 2. HPLC Method Initial Set Conditions

Based on the screening work, temperature was identified early as a critical parameter for peak resolution and this information was considered during subsequent risk assessments. Additional potentially critical parameters were identified during the risk assessment process that followed the screening experiments.
Risk Assessment
The quality risk management (QRM) process is detailed in ICH Q9, and presented pictorially in Figure 1. A Risk Assessment Process is comprised of 3 main concepts: risk assessment (RA), risk control, and risk review. The RA involves risk identification, analysis, and evaluation. RAs may be employed throughout various stages in the development of an analytical method. The process can facilitate the identification of area of the analytical method with emphasis on method robustness and ruggedness and the level of risk that the parameter presented to the attributes. An example of the risk assessment is presented in Table 3. These risk assessments guided the experimentation which was intended to de-risk the method and identify method parameters having the greatest effect on method performance. This important information was also used to identify a control strategy for the method.
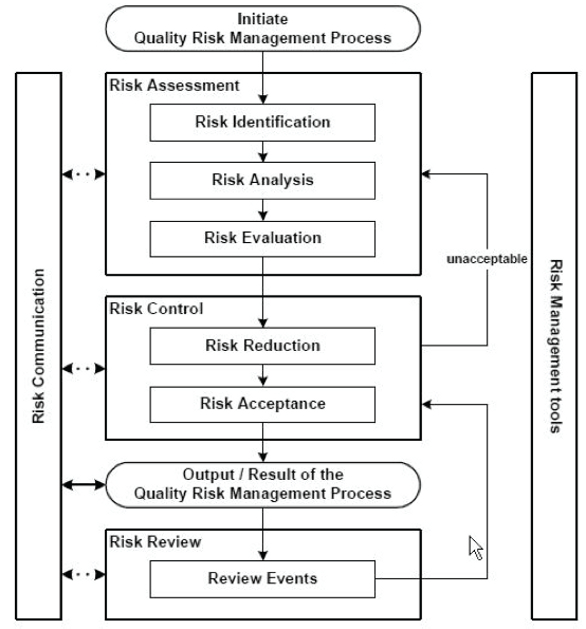 Figure 1. Quality risk management process. Reproduced from ICH Q9: Quality Risk Management.2
Table 3. Risk Assessment for HPLC Analysis Focus Area

Design of Experiment
Based on the method risk assessment analysis, ten chromatographic parameters were identified as having the largest potential to impact the separation performance of critical pairs as indicated by high scores in Table 3. A series of experimental studies, both univariate (4 parameters) and multivariate (6 parameters), were conducted to evaluate the functional relationship between the resolutions of critical pairs and the ten parameters over the explored ranges. Six out of the 10 parameters were evaluated through multivariate study, during which resolution values of 13 critical pairs were collected and analyzed. Over the range explored, most resolutions met acceptance criteria; these will not be discussed further. Co-elution in some conditions was observed for 2 peak pairs: Peak Pair 1 (Compounds 1 and 2) and Peak Pair 2 (Compounds 2 and 3). Resolution of these 2 sets of peaks was determined to be critical. This article focuses on resolution of these peaks.
DoE 1
Table 4. Design Parameters and Ranges Studied in DoE 1
The 6 parameters chosen for further study by multivariate experiments are listed in Table 4 and were incorporated into a 26-2=16-run fractional factorial 4 four replicates at the set condition for a total of 20 experiments. The replicates allow evaluation of experimental error and test the lack-of-fit of the model.
Shown in Figure 2 are the scatter plots of resolutions for Peak Pair 1 (left) and Peak Pair 2 (middle) from DoE 1. Pair 1 at the tentative set condition (Runs 1, 6, 11, and 16) did not meet the resolution criterion of 1.0. Within the range explored, 12 out of 20 conditions the Pair 1 exhibited resolution values < 1.0 with an average of 0.83 at the tentative set condition. Pair 2 met the resolution criteria at all conditions with an average of 3.8 at the tentative set condition.
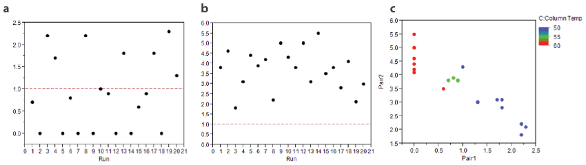 Figure 2. Scatter plots of observed resolutions (y-axis) for (a) Pair 1 (left) and (b) Peak Pair 2 for the conditions evaluated in DoE 1 (x-axis); (c) is a pairwise scatter plot of resolution values for Pair 1 vs Pair 2 measured across the DoE runs. The green points represent temperatures corresponding to the initial set condition of 55°C.
Pair 1 and Pair 2 resolution values are negatively correlated as shown in Figure 2c; Pair 1 resolution increases as Pair 2 decreases. Statistical analysis revealed that there was no significant interaction effect among the studied 6 parameters. The main effect plots in Figure 3 are the graphical representation of the predicted functional relationship between both pairs and the 6 parameters. Buffer strength and flow rate did not seem to impact either resolution, while starting %B, ending %B and initial hold time had detectable impact to Pair 2. Over the range of 50–60°C, column temperature had a dominant effect on both pairs, as illustrated in Figure 3.
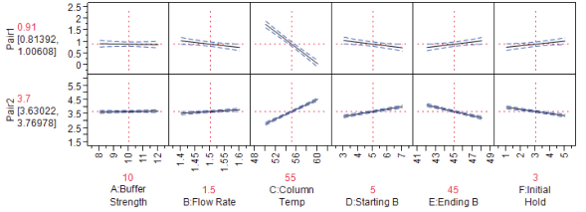 Figure 3. Prediction profi les of resolution (y-axis) of Pair 1 and Pair 2 with main eff ects of 6 parameters over the explored range in DoE 1 (x-axis). The values on the y-axis are the predicted resolution values at the center point (in red) and the associated confi dence intervals (in parentheses).
The results of this DoE confirmed that temperature was a critical method parameter and that the temperature range of 50 to 60°C was not suitable to maintain separation of Pair 1 throughout the ranges of the variables studied. The DoE suggested that decreasing the temperature would improve resolution of Pair 1, although at some point the resolution of Pair 2 would be compromised. Further studies were required to identify a suitable temperature for both peak pairs.
Temperature Univariate Study
In order to further investigate the effect of temperature and identify suitable temperature ranges, a univariate experiment was performed where the temperature was varied from 35 to 65°C and all other parameters were run at the set condition. Retention time and elution order of the 3 impurities were determined (Figure 4).
 Figure 4. Temperature and retention time plots for the 3 compounds of interest and the drug substance.
The data show the reversal of elution order of Compound 1 and Compound 2 around 55°C. The retention behavior of Compounds 1 and 3 is similar to the drug substance, while the retention of Compound 2 is more sensitive to temperature. Based on these univariate data, the temperature range was refined for a subsequent DoE (DoE 2). The region below 40°C was not desirable since Compound 2 coeluted with Compound 3 and the backpressure below 35°C was near the upper limits of the instrument. Therefore, the range of 40–50°C was selected for further study in DoE 2.
DoE 2
DoE 1 results showed how changes to 6 parameters affected the separation. Statistical analysis and the temperature univariate study recommended moving column temperature to a lower range of 40–50°C to improve Pair 1 resolution without significantly compromising Pair 2 resolution. The revised column temperature range, 40–50°C, was explored in a subsequent study, DoE 2, with 45°C as the revised set temperature. The ranges for the remaining five parameters were maintained the same as in DoE 1 (Table 4).
The same type of design (20 runs = 26-2 fractional factorial + 4 replicates) was applied to the 6 parameters. The scatter plots of the observed resolutions in Figure 4 demonstrated that the new column temperature range had improved separation performance for Pair 1 but had some effect on Pair 2. But both pairs at the new set condition 45°C had resolution around 2.0 and had met the resolution criteria of 1.0.
As shown in Figure 5c, Pair 1 and Pair 2 were highly correlated over the ranges in DoE 2. Statistical analysis revealed that ending %B also had a detectable influence on both pairs with temperature being the dominant parameter. The contour plots in Figure 6 graphically depict the functional relationship of the predicted Pair 1 and Pair 2 resolution with column temperature and ending B%. Pair 1 resolution increased as temperature decreased and ending %B increased; the 2 parameters had the opposite effect on Pair 2. Given these opposite effects, a trade-off was required. A good balance was achieved at 45°C.
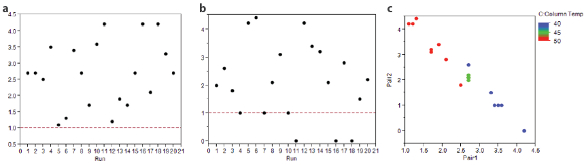 Figure 5. Scatter plots of observed resolutions (y-axis) for (a) Peak Pair 1 and (b) Peak Pair 2 for the conditions evaluated in DoE 2 (x-axis); (c) is a pairwise scatter plot of resolution values for Pair 1 vs Pair 2 measured across the DoE runs. The green points represent temperatures corresponding to the revised set condition of 45°C.
 Figure 6. Contour plots showing resolution of Pair 1 (a) and Pair 2 (b) as a function of column temperature (x-axis) and end %B (y-axis) over the ranges explored in DoE 2.
Instrument Variability and Temperature
The data from DoE 2 confirmed that the region of 40–50 °C would provide sufficient resolution between each of the critical pairs within the ranges studied for the majority of the conditions. It was noted, however, that there was a slight difference between the set condition data collected during the DoEs and additional development data collected on a different instrument. Due to the sensitivity of the resolution between these peaks to temperature, an instrument- to-instrument comparison experiment was conducted.
An impurity mixture was prepared containing a number of known drug substance impurities and degradation products. This mixture was analyzed on 7 systems, 4 from one company, and 3 from another with the same column and instrument parameters.
Three systems were used for the DoEs while four systems were used for most of the development work and the univariate temperature study shown in Figure 4. Figure 7 shows chromatograms obtained using the 3 DoE systems. The critical pairs are shown in the box. Pair 2 is fully resolved in the bottom chromatogram, coeluting in the middle, and slightly resolved in the top chromatogram.
 Figure 7. Resolution of impurity Pairs 1 and 2 on 3 separate DoE systems.
Chromatograms from the 4 development work and univariate temperature study systems are shown in Figure 8. While there is more varibility in the retention time of the peaks, the resolutions of the peaks of interest are more consistent. This consistency is maintained if the temperature setting of the instrument was varied ±5°C.
 Figure 8. Resolution of impurity Pairs 1 and 2 on 4 separate development work and univariate temperature study systems.
Pre-column Tubing
In order to prevent the end user from being limited on the HPLC platform, further work to understand this source of instrument variability was conducted. The previous DoEs and univariate experiments identified temperature as a critical parameter for this separation. As such it was determined that temperature variability must be playing a role. The DoE data suggested that the accuracy of the column heater would need to deviate by more than 5°C to show the type of variability observed; this was not likely given the calibration schedules of the instruments. Therefore, an intrinsic parameter of the instrument was the most likely source of the differences.
While both sets of instruments contain heated column compartments, the mechanism of heating the column and mobile phase is different. The development work and the univariate temperature study systems contain a solid-state heating block with a built-in flow path designed to heat the mobile phase prior to entering the column. The DoE systems have an oven with an indirect heater and no mobile phase preheater. In addition, the amount of capillary tubing present in the oven and before the column varied significantly between the 3 DoE instruments, with the best resolution produced by the instrument with the most tubing inside the oven and the worst resolution produced on the instrument with very little tubing in the oven.
A 600 mm length of 0.17 mm interior diameter stainless steel capillary tubing was attached to the front of the column and placed inside the oven of the worst case DoE system. The resulting chromatogram yielded baseline resolution of the 3 critical peaks. Further, the development work and the univariate temperature study system was plumbed to remove the mobile phase flow path from the column heater block. Once injected the elution order of Compounds 2 and 3 was shown to reverse. Thus it was shown that pre-heating the mobile phase is critical to the separation in order to maintain the correct column temperature. This is illustrated in Figure 9.
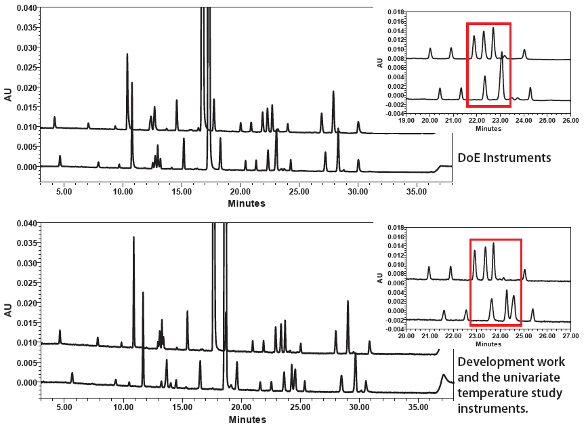 Figure 9. Impact of preheated mobile phase on chromatograms obtained from development work and the univariate temperature study instruments. Top chromatograms: preheated mobile phase; bottom chromatograms: without mobile phase pre-heating.
Adding this precolumn to three separate DoE systems produced chroma-tograms having essentially identical resolution between the two impurity pairs and essentially identical resolution when compared to the development work and univariate temperature studysystem (Figure 10).
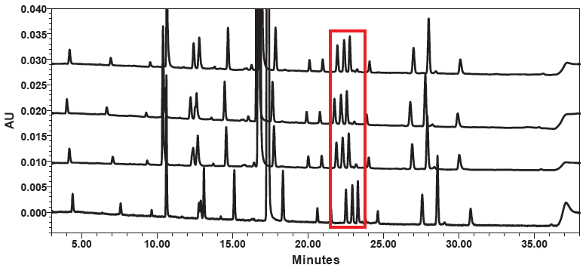 Figure 10. Resolution of impurity Pairs 1 and 2 on 4 separate DoE systems (top) and 1 development work and univariate temperature study system (bottom) after preheating the mobile phase.
Control Strategy
The results of the univariate and multivariate studies show that temperature is critical to maintain resolution of the Pairs 1 and 2. Improper heating of the mobile phase will result in the loss of resolution of Pair 2. In order to ensure proper method performance, the resolution of Pair 2 will be included in the method system suitability requirements. Proper instrument setup and platform selection should ensure resolution, and therefore guidance will be included in the method and training will be provided as part of the method transfer to the testing labs.
Conclusion
This example illustrates how QbD concepts can provide a science- and risk-based framework for developing enhanced understanding of analytical methods. In this example, a wealth of information about the effect of method parameters, including the sensitivity of the method to temperature, was obtained and leveraged to optimize method conditions and develop a control strategy. The elements applied include (1) a systematic chromatographic development approach with in-silico modeling, (2) structured risk assessments used to guide experimental plans, and (3) statistically sound experimental plans that included designs of experiments (DoEs) and targeted univariate studies. The main purpose of applying these concepts and tools is to obtain enhanced understanding about the method in order to reduce and control sources of variability.
Author Biographies
Kimber Barnett, PhD is a Research Fellow working in Analytical Research and Development at Pfizer Inc. in Groton, CT. In her current role, Kimber serves as a team leader responsible for late stage analytical development of drug substances and products as well as the late stage LC Method Development Group. Kimber obtained her PhD in Analytical Chemistry from the University of Missouri under the guidance of Professor Daniel Armstrong. She is also a member of the USP Validation and Verification Expert Panel.
Kevin Doyle is a Senior Scientist working in Analytical Research and Development at Pfizer Inc. in Groton, CT. In his current role as analytical project leader, his major responsibilities are method development, validation, and transfer for late stage drug substance candidates, raw materials, and process intermediates. Kevin obtained his BS in Chemistry from Michigan State University.
James Morgado is a Principle Scientist working in Analytical Research and Development at Pfizer Inc. in Groton, CT. In his current role, James serves as a team member of the LC Method Development Group responsible for late stage analytical development of drug substances and products methods. James obtained his BS in Chemistry from the University of South Florida.
Ke Wang, PhD,is an Associate Director working in the Pharm Sci – PGS Statistics group at Pfizer Inc. in Groton, CT. Her primary responsibility is to provide statistical support to Chemical Research and Development in Groton and Sandwich as well as the Analytical Development of drug substances. Ke obtained her PhD in Statistics from Colorado State University, and MS and BS in Chemistry from Wuhan University in China.
Jeffrey Harwood is a Senior Scientist working in Analytical Research and Development at Pfizer Inc. in Groton, CT. Jeffrey obtained his BS in Chemistry from the University of Rhode Island.
References
- ICH, Q8 (R2). Pharmaceutical Development (2009).
- ICH, Q9. Quality Risk Management (2005).
- ICH, Q10. Pharmaceutical Quality Systems (2008).
- Martin GP, et al. Lifecycle Management of Analytical Procedures: Method Development, Procedure Performance Qualification, and Procedure Performance Verification Pharmacopeial Forum. 2013;39(5).
- Colgan S, et al. Using Quality by Design to Develop Robust Chromatographic Methods. Pharm Tech. 2014;38 (9):48–64.
- Szucs R, et al., ‘’Pharmaceutical Analysis,’’ in Liquid Chromatography: Fundamentals and Instrumentation, Fanali S, Haddad PR, Poole CF, Schoenmakers P, and Lloyd D (eds.) (Elsevier, Amsterdam, 2013), pp 431–453.
- Reid GR, et al. Reversed-Phase Liquid Chromatographic Method Development In An Analytical Quality By Design Framework. J Liq Chrom & Rel Tech. 2013;36(18): 2612–2638.
- Tattersall P, Li L, Wang Q. A Fast, Generic and Systematic Approach to vHPLC Impurity Method Development. Amer Pharm Rev. 13 (7).
- Rozet E, et al. Quality by Design Compliant Analytical Method Validation. Anal Chem. 2012;84 (1):106–112.
- Ermer J, Nethercote P. Quality by Design for Analytical Methods: Implications for Method Validation and Transfer. Pharm Tech. 2012;36 (10):74–79.