What’s the Point?
Environmental Monitoring (EM) generates a large amount of data. Even relatively small programs can generate hundreds of data points, however, raw data is not useful until it has been analyzed and yields information. This is a key question that must be addressed: How can we extract information from a mound of EM data? Trending of the EM data is one way that FDA recommends extracting the relevant information and this short review will look at different methods to trend data from an operational perspective. That is to say, we will first establish the purpose and goals of the EM program and then discuss how trending of the EM data supports that program with relevant information.
The requirement that the facility have “A system for monitoring environmental conditions” is stated in 21 CFR 211.42 although the reasons for this system are not provided. An excellent source for FDA background information in the area of EM is the FDA Aseptic Processing Guidance document where it states:
“This program provides meaningful information on the quality of the aseptic processing environment (e.g., when a given batch is being manufactured) as well as environmental trends of ancillary clean areas…”
and:
“Environmental monitoring should promptly identify potential routes of contamination, allowing for implementation of corrections before product contamination (211.42 and 211.113).”
So we are not monitoring aspects of product quality, but rather the state of control of the manufacturing environment. This focus on EM as a system to monitor the facility control rather than on finished product quality is reinforced by Hussong and Madsen2 and by Farrington3 in a pair of excellent review articles.
As noted in a recent article by the author4, this monitoring activity must be linked to appropriate responses to unwanted events. For example, the validated sanitization program will include periodic rotation of the sanitizer with a sporicidal agent5. However, if there is an increase seen in bacterial spore forming bacteria in the facility, then this should be addressed by a responsive sporicidal treatment.
Given the purpose of EM as a means to evaluate the state of control of the facility, what value is there in trending the data?
The Reason for Trending
Most regulatory documents provide prescribed number levels (CFU/ plate, CFU/L3, etc) for recommended Alert and Action Levels, operationally defining clean rooms of different classifications. This approach has the advantage of being easy to audit as CFU measured are either over or under the regulatory limits. However, this only provides a snapshot in time of what is occurring in the clean room. Trending of the data allows a review of the “steady state” conditions in the facility. In other words, is the facility operating consistently or do the numbers and types of microorganisms fluctuate? Are excursions associated with an operator? A day of the week? A particular product? A particular location?
As an aside, we should recognize that it is impossible to trend EM data by location if the locations are not defined. These sample sites are identified and qualified during the validation protocol for the EM program as those most likely to show contamination under dynamic conditions. Once identified, the sample sites should be sampled consistently unless the facility or process changes (in which case the EM program may need to be requalified).
Trending Methods
There are a variety of methods to trend EM data. One of the simplest involves tracking Alert Level and Action Level excursions in a given period of time. However, there are fundamental scientific problems with this approach.
Basic Science of Plate Counts
We must remember that a CFU is not the same as a bacterial cell. A CFU (colony forming unit) is a collection of bacterial cells. The CFU becomes visible to the naked eye when there are sufficient microbial cells present in the biomass mound (generally in the range of 107 – 108 cells). Did this biomass of 100 million cells arise from a single cell or a mass of cells in aggregation? We don’t know. Did this biomass of 100 million cells arise from one species of bacteria or more than one that happened to land close to each other on the plate? We don’t know. All we really know is that microbes grew in that spot until there was enough accumulated biomass to see with the naked eye.
The CFU is at best an estimate of the numbers of cells present originally. This estimate becomes even more imprecise at low numbers of CFU per plate6.
LOD vs LOQ
All quantitative analytical methods have a lower Limit of Quantification. This can be roughly defined as the point at which the linearity of the method degrades. In analytical chemistry the range below this value (and before the Limit of Detection) is rightfully considered noise and not valid for quantitative analysis.
The Limit of Quantification for the plate count assay has been determined to be from 30 CFU/plate7 to 25 CFU/plate8. Realistically, any counts below this level should be viewed with the greatest suspicion. It is useful to review the currently enforced cleanroom regulatory Action Levels with this in mind. Shown in Table 1 (based on information from reference 9).
Table 1.
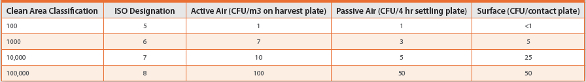
Virtually all clean room Action Levels, as set by regulation, are deep in the noise range of the plate count method.
Trending Numbers
Scientifically defensible methods to trend EM by plate count recognize the fundamentally poor quality of the data at these low numbers of CFU/plate as noted in USP <1116> which states “Both the lack of precision of enumeration methods and the restricted sample volumes that can be effectively analyzed suggest that environmental monitoring is incapable of providing direct quantitative information about sterility assurance10.”
USP <1116> recommends calculating “Contamination Recovery Rate” as a measure of control which is defined as the percentage of plates that show any microbial recovery irrespective of number of CFU. Basically this is calculating the frequency of “non-zero” results. Of course, these rates should be analyzed to allow examination of those same factors (operator, location, day of week, season, product, etc.) as with any trending program.
There are other published recommendations for trending “non-zero” values. For example, Caputo and Huffman presented a trending methodology using non-standard statistical control charts to analyze “nonzero” EM data11.
An excellent treatment was presented by Sun et al. who described the use of the MPN methodology to analyze these “non-zero” values12. This approach has the significant advantage of not requiring normally distributed data (which relieves us from the need to demonstrate the normality of our EM data) and of being a familiar statistical treatment for regulatory agencies and for many microbiologists.
All of these “non-zero” trending methodologies have a significant, and obvious, weakness in that there is no allowance for recognizing repeated occurrence of an unusually large CFU count. This limitation is discussed in USP <1116> and must be addressed if one of these methods is to be used.
Trending Microbial Species
Finally, there must be a method in place to track the identities of microorganisms in the facility, at least periodically, to allow for recognition of a problem in the cleaning program or recognition of a facility issue. The level of identification should be sufficient to meet trending needs at your facility (whether to gram stain, genus, or species level). This company decision should recognize that many regulatory agencies world wide expect regular information to the species level.
However often you trend microbial identities, it is prudent to retain those EM plates showing growth. These plates may be discarded when the batch is released and it is certain that the plates will not be needed in an investigation.
Meeting Your Facility’s Needs
It should be obvious that while trending of EM data is required by regulatory agencies and is a very good idea, there is no universally accepted method. Therefore the choice of how to conduct your EM program and trend the data should be geared to meet the needs of your program, facility and company. All companies want to produce high quality products that are safe and effective using an effective Quality program. However, unless the goals of the different systems are kept clearly in mind it is relatively easy to create unnecessary and useless “quality” requirements. One example may help to illustrate this point.
There has been a recent spate of 483 observations (available on the FDA website) citing failure to identify or investigate “objectionable organisms” in the aseptic process’ EM program13. It is unclear from the 483 reports if these are cases of some over-enthusiastic inspectors or a self-inflicted wound with the company having assigned themselves the pointless task of identifying “objectionables” in a system that does not relate to product quality (especially pointless in a sterile product). However, it is clear that there is no CGMP requirement for this activity as 21 CFR 211 mentions objectionables only in three passages (21 CFR 211.84(d)(6); 21 CFR 211.113(a); and 21 CFR 211.165(b) ) and nowhere is it linked to facility monitoring, only to incoming raw materials and finished product quality of non-sterile products. These observations seem to be a clear example of an attempt to increase “compliance” of the EM trending program (on the part of the company or the inspector) without a clear understanding of the scientific, cGMP and business needs of the program.
The data trending program must achieve the established and described goals of the EM program. It also must be a rational and reasonable company program within the company’s business framework. There is no one right answer to this challenge – it is up to us to develop the compliant program that works in our facility.
References
- FDA. 2004. Guidance for Industry: Sterile Drug Products Produced by Aseptic Processing - Current Good Manufacturing Practice.
- Hussong, D and RE Madsen. 2004. Analysis of Environmental Microbiology Data From Cleanroom Samples. Pharm Technol. Aseptic Proc:10-15
- Farrington, JK. 2005. Environmental Monitoring in Pharmaceutical Manufacturing - A Product Risk Issue. Amer Pharm Rev. 8(4):26-30
- Sutton, S. 2015. Bioburden Contamination Control: A Holistic Overview. American Pharmaceutical Review Endotoxin Detection Supplement Part III(July/ August):20-24.
- Disinfectant Rotation – A Microbiologist’s View; Controlled Environments. 8(7):9-14. 2005
- USP. 2015. <1227> Validation of Microbial Recovery from Pharmacopeial Articles
- Breed, R and WD Dotterrer. 1916. The Number of Colonies Allowable On Satisfactory Agar Plates. J Bacteriol. 1:321-331
- Tomasiewicz, D.M.et al. 1980. The Most Suitable Number of Colonies On Plates for Counting. J Food Prot. 43(4):282-286
- PDA. 2014. PDA Tech Report #13 (Revised): Fundamentals of an Environmental Monitoring Program
- USP. 2015. <1116> Microbiological Control and Monitoring of Aseptic Processing Environments
- Caputo, RA and A Huffman. 2004. Environmental Monitoring: Data Trending Using a Frequency Model. PDA J Pharm Sci Tech 5:254-260.
- Sun, X et al. 2006. The Expanded Application of Most Probable Number to the Quantitative Evaluation of Extremely Low Microbial Count. PDA J Pharm Sci Tech 60(2):124-134
- http://www.fda.gov/AboutFDA/CentersOffices/OfficeofGlobalRegulatoryOperationsandPolicy/ORA/ ORAElectronicReadingRoom/default.htm
Author Biography
Scott Sutton, PhD is the Principal of Microbiology Network, Inc (http://microbiologynetwork.com/) a company he started in 1996 as a means to encourage training and communications within the microbiological community. With over 90 publications and hundreds of presentations, Scott is a recognized consultant and trainer having over 30 years experience with emphasis in CGMP, investigations, environmental monitoring and contamination control as well as microbiology laboratory operations/audits. Scott has helped companies in pharma, compounding pharmacies, personal care products with questions and product development issues in both sterile and non-sterile production. Dr. Sutton is an adjunct faculty member of the Wegman’s School of Pharmacy at St. John Fisher University (Rochester, NY) and is a longtime USP volunteer.