Introduction
Counterfeit drugs pose a significant and fast-growing threat to public health and safety1. The incident of counterfeit Avastin® in the United States demonstrates the vulnerability of the supply chain even in developed countries2. Government health agencies and pharma-ceutical manufacturers are finding ways to fight counterfeit and substandard drugs by identifying them from manufacturing, throughout the supply chain, and eventually when they reach the public in the retail pharmacies3.
In 2009, Pharmaceutical Security Institute (PSI) reported 1,700 counterfeiting incidences worldwide out of which 60 incidences were biologics, compared to only 10 incidences in 20064. With the recent FDA guideline for biosimilar approval5 and the counterfeit Avastin® reported in the United States, it is becoming increasingly important that pharmaceutical companies find ways to rapidly screen and detect counterfeit biologics6.
Counterfeit biologics are, in a way, difficult to detect since they are administered by injection (white powder or clear liquid) and cannot be distinguished by smell, taste, and appearance. This, along with the sizeable cost, makes counterfeiting biologics an attractive illegal business.
This article demonstrates that Drop Coat Deposition (DCD) technique for the biologics drug product sample, coupled with confocal Raman spectroscopy can be effectively used to fingerprint protein based biologics pharmaceuticals. These spectral fingerprints can be used routinely to screen and detect biologics counterfeits. In order to develop Raman spectral fingerprints for protein based biologics drugs, two model proteins, namely, Bovine Serum Albumin (BSA) and Ovalbumin were first fingerprinted followed by Immunoglobulin G (IgG) antibody.
IgGs are proteins found in human blood. These proteins are called “antibodies” and are an important part of the body’s defense against disease. In the past 30 years, more than 45 IgG proteins and their derivatives have been approved for medical use for various indications7. Therefore, it is important that pharmaceutical companies find ways to fingerprint these types of drug products so that biologics counterfeits can be detected.
Raman Spectroscopy of Proteins
Raman spectroscopy is an inelastic light scattering technique in which quanta of energy are transferred from the incident excitation laser to the target molecule, in this case, proteins. The quanta of energy gained by the protein molecule is in the form of discrete vibrational energy, which constitute the Raman frequencies. These frequencies, along with the scattered intensities, are the Raman spectral fingerprint for a given protein, and can provide a wealth of information on protein structure and its environment8.
The term structure, when used in relation to proteins, takes on a much more complex meaning than it does for small molecules. Proteins are large macromolecules and have four different levels of structure; namely primary, secondary, tertiary, and quaternary. In this article we only focus on extracting a qualitative secondary structure prediction of a given protein from the Raman Amide I vibrational band, which is typically in the region of 1620 to 1720 cm-1. The Amide I vibration is hardly affected by the nature of the side chain amino acid residues and is mainly from the C = O (carbonyl) stretch of the amide group, coupled with the in-plane N-H bending and C-N stretching vibration from the polypeptide chain in the protein9. It depends mainly on the secondary structure of the protein backbone and can potentially be used as a fingerprint of a given protein; and therefore, for a biologics based drug such as IgG.
Secondary structure for proteins are mainly characterized by periodic motifs such as α-helices, β-sheets, bend, turns, and random coil10. Circular dichroism (CD) spectroscopy, X-ray crystallography, Nuclear Magnetic Resonance (NMR), and Infrared (IR) spectroscopy have been used extensively in the past to determine the secondary structure distribution of proteins11-14. CD spectral data has to be processed with mathematical algorithms to extract the secondary structures of proteins, and often fail to provide acceptable results when the proteins are a mixture of α-helices and β-sheets; and also when they are β-sheet rich proteins15. X-ray crystallography is considered to be the gold standard method but it requires the proteins to form well-ordered crystals which is not always the case for all proteins16. NMR requires large amounts of sample and in addition, the protein needs to be stable at room temperature under a rather long data acquisition time17. Even though IR spectroscopy has several advantages, i.e., spectra can be collected for small soluble proteins to large membrane proteins, and low amounts of sample required (10 – 100 μg), the omnipresent water absorption around the Amide I band requires spectral subtraction18.
In this article, we present a direct and straightforward approach of using Drop Coat Deposition (DCD) technique coupled with confocal Raman spectroscopy to measure the Raman spectra and hence to determine the secondary structure of proteins. Both the DCD and the confocal Raman spectra are collectively referred as Drop Coat Deposition Raman (DCDR) technique19.
Three different proteins, namely BSA, Ovalbumin, and Immunoglobulin G (IgG) were chosen for this study. These three proteins are known to have different secondary structure distribution, i.e., BSA, predominantly α-helices20, Ovalbumin21, an equal mixture of α-helices and β-sheets, and Immunoglobulin G (IgG), predominantly β-sheets22. The correlation between the Amide I Raman band frequency and the secondary structure of the protein arises from the fact that the hydrogen bond between the carbonyl from the polypeptide bond is different for α-helices, β-sheets, turns and random coil, respectively. Therefore, these three types of proteins should have differences in Amide I band frequencies and characteristics.
Drop Coat Deposition Raman (DCDR)
Drop Coat Deposition (DCD) is a method in which micro volume (1 – 10 μL) from a single drop of a sample solution is manually dropped onto a hydrophobic substrate (commercially available shiny stainless steel plate with a thin layer of Teflon coating) followed by solvent evaporation23. If the drop contains protein with buffer salts and sugar in water, which is a typical formulated biologics drug, the protein gets pre-concentrated on the hydrophobic substrate during the solvent evaporation by forming a “coffee ring” (Figure 1). The “coffee ring” is formed from the protein solution by the interplay of contact line pinning, water evaporation, and capillary flow in the hydrophobic substrate which creates a high concentration of protein in the “coffee ring”24. This enables the DCDR spectral measurement of the protein in the “coffee ring” with much higher signal-to-noise ratio than in solution, and without sacrificing the solution protein conformation25. The pre-concentration process produces protein deposits that are in a glassy like state in the “coffee ring” and they are known to be well hydrated, thus maintaining the protein in its native structural form26. The confocal Raman microscope provides a highly resolved visual image of the “coffee ring,” and offers the spatial resolution to collect the Raman spectrum of the protein in the ring, in its native state.
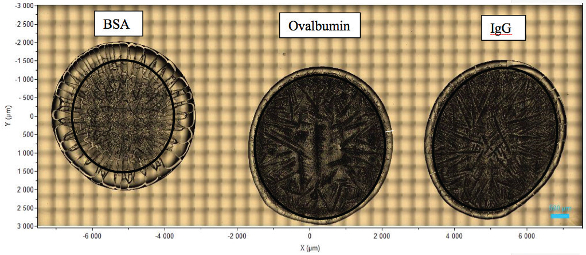 Figure 1. DCD and “Coffee Ring” for BSA, Ovalbumin and IgG Samples
Protein Sample Preparation
BSA, Ovalbumin, and IgG were commercially purchased and used without any further purification. BSA (50 mg/mL) and Ovalbumin (10 mg/mL) were prepared in Phosphatebuffered Saline (PBS) solution. PBS is a waterbased salt solution (pH = 7.4) containing sodium dihydrogen phosphate, sodium chloride, potassium chloride, and potassium hydrogen phosphate. The osmolality and ionic concentration of the solution matches that of the human body (isotonic)27. IgG (11.5 mg/mL) is a liquid sample purchased from the supplier and was used as is.
About 10 μL of each sample was dropped onto the hydrophobic substrate plate and allowed to air dry for about 30 minutes before collecting the Raman spectra. Refer to Figure 1 for the DCD sample for all the three proteins and the “coffee ring” formed from each one of them. The black oval/circular inner line is drawn manually in Figure 1 for each sample to show the “coffee ring” more clearly. The thickness of the “coffee ring” ranged between 125 to 500 μm and it is known to depend on the concentration and volume of the protein solution spotted on the hydrophobic substrate28. In this study, the volume used is the same for all the three proteins (~ 10 μL) and therefore, it is the concentration difference that has resulted in different thickness for the “coffee ring”. For BSA the “coffee ring” was about 500 μm and it is almost four times the size compared to other two proteins, namely Ovalbumin and IgG.
Confocal Raman Spectral Acquisition Parameters
Table 1. Raman Spectral Acquisition Parameters

Refer to Table 1 for the spectral acquisition parameters used to collect the DCDR spectra for BSA, Ovalbumin, and IgG from their corresponding “coffee ring”.
Raman Spectral Fingerprinting
The measured Raman spectrum (between 300 – 1800 cm-1) for BSA, Ovalbumin, and IgG from the “coffee ring” and the protein band assignments are given in Figure 2. The bands labelled as Tyr, Phe, and Trp are from the Tyrosine, Phenylalanine, and Tryptophan amino acid residues, respectively, in the protein29.
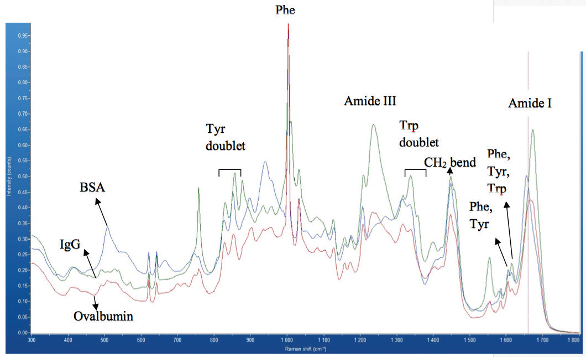 Figure 2. Raman Spectrum for BSA, Ovalbumin and IgG from their Corresponding “coffee ring”
Even though there are spectral differences in other regions of Raman spectra, for the secondary structure determination only the Amide I band was used and is shown in Figure 3. Tyr, Trp, and Phe amino acid residue peaks are also shown in the figure to depict the baseline around Amide I region.
 Figure 3. Raman Spectral Region of Amide I Band Along with Tyr, Trp and Phe Peaks for BSA, Ovalbumin and IgG
From Figure 3, it is clear that the Amide I band is centered at different positions for each of these three proteins, i.e., BSA around 1655 cm-1 (α-helices), IgG around 1675 cm-1 (β-sheets) and Ovalbumin with a flat peak centered between BSA and IgG, and around 1665 cm-1 (~equal mixture of α-helices and β-sheets). This is expected since the secondary structure for these proteins are markedly different, i.e., BSA, predominantly α-helices20, IgG, predominantly β-sheets22, and Ovalbumin21, an equal mixture of α-helices and β-sheets. This, in fact, was the reason for choosing these three proteins for the DCDR study. Confirmation of these known differences, in our spectrum, shows the first signs of accurate secondary structure prediction using DCDR.
Protein Secondary Structure Prediction
The results shown from the raw Raman spectrum (Figures 2, and 3) clearly indicate differences between BSA, Ovalbumin, and IgG. To further decipher the secondary structure predictions for these proteins for fingerprinting purposes, second derivative on the Raman spectral data was performed to determine the number of possible peaks (different secondary structure motifs, i.e., α-helices, β-sheets, turns, and random coil) within the Amide I band. Typically, the second derivative spectra will magnify the subtle differences noticed in a peak such as, shoulder, doublet, etc. which accounts for different secondary structure motifs. The second derivative Raman spectra was smoothed to 18 data points and fitted to a second order polynomial so as to maintain the spectral features from the raw spectral data. Based on the known crystal structures for these proteins30, 31 and from the number of peaks from the second derivative spectra, the secondary structures were predicted for all three proteins. A qualitative and quantitative prediction for different secondary structure motifs from the Amide I band is possible since the Raman absorption cross section is the same for these different types of delocalized vibrations (α-helices, β-sheets, turns, and random coil) in a given protein32.
BSA
The second derivative spectrum (red) shown in Figure 4 for BSA shows three peaks in the Amide I region (1620 – 1720 cm-1). The peaks from the aromatic residues are not considered for discussion in the secondary structure prediction.
 Figure 4. Raw (Blue) and Second Derivative (Red) Raman Spectrum for BSA
The three peaks from the second derivative Raman spectrum from the Amide I band are located around 1635 cm-1, 1655 cm-1 and 1690 cm-1. These peaks are accounted for by different secondary structure motifs, i.e., random coil, α-helices, and turns, respectively. It is noted that the α-helices peak at 1655 cm-1 is predominant when compared to the other two peaks. The crystal structure for BSA also accounts for approximately 70% of the amino acid residues as α-helices30,31.
Ovalbumin
The second derivative Raman spectrum (red) shown in Figure 5 for Ovalbumin shows four peaks in the Amide I region (1620 – 1720 cm-1), and again multiple peaks derived from the aromatic residues, which are not considered for discussion in the secondary structure prediction.
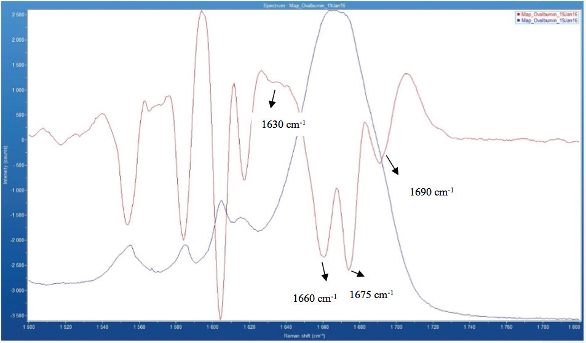 Figure 5. Raw (Blue) and Second Derivative (Red) Rama Spectrum of Ovalbumin
The four Amide I peaks in the second derivative Raman spectrum are located around 1630 cm-1, 1660 cm-1, 1675 cm-1, and 1690 cm-1. These peaks are accounted for by different secondary structure motifs, i.e., random coil, α-helices, β-sheets, and turns, respectively. It is noted that the α-helices peak at 1660 cm-1 and the β-sheets peak at 1675 cm-1 are almost equally distributed in intensity. The crystal structure for Ovalbumin also accounts 30% of the amino acid residues, each, to α-helices and β-sheets30,31. The remaining 40% of the residues are accounted for by random coil and turns30,31. As mentioned before, a semi quantitative estimate for these different secondary structures is possible since the Raman absorption cross section is the same for these different types of vibrations in a given protein32.
IgG
We have already shown that DCDR can predict the secondary structure of a protein that is a predominantly α-helices protein (BSA), and a protein with an equal mixture of α-helices and β-sheets (Ovalbumin), but the overall goal is to be able to use DCDR to fingerprint biologics drugs and to detect drug product counterfeits. The majority of current and upcoming biologics on the market are IgG based derivatives; and therefore, the real test is to find out if DCDR can predict the secondary structure of an IgG, and if this can be used as a fingerprint.
The second derivative Raman spectrum (red) shown in Figure 6 for IgG shows three peaks in the Amide I region (1620 – 1720 cm-1), and again multiple peaks derived from the aromatic residues, which are not considered for discussion in the secondary structure prediction.
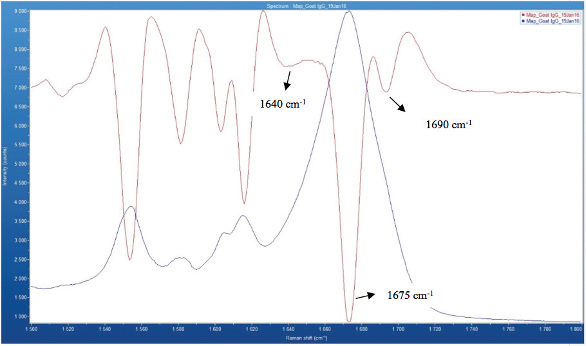 Figure 6: Raw (Blue) and Second Derivative (Red) Raman Spectrum of IgG
The three peaks under the Amide I band are around 1640 cm-1 (broad peak), 1675 cm-1, and 1690 cm-1 which can be accounted for by random coil, β-Sheets, and turns, respectively. The β-sheets peak at 1675 cm-1 appears to be more predominant in the second derivative Raman spectra, and correlates with the crystal structure for IgG that accounts for about 50% of the amino acid residues as β-Sheets30,31. The broad peak in the second derivative Raman spectra around 1640 cm-1 is reflected from a rather less steep feature in the raw Raman spectra around this region. This could be due to the fact that the random coil and possibly another peak is overlapped in this region. We account this additional peak to bends vibration, which is another type of known motifs in such proteins. A more detailed quantitative secondary structure prediction is currently underway for all the three proteins studied here using peak fitting procedures.
The studies that were conducted on BSA, Ovalbumin, and IgG all have shown that DCDR can be an extremely effective tool for protein secondary structure prediction. This study shows that DCD allows for pre-concentration of protein in the “coffee ring” without denaturing the protein; and the confocal Raman microscope enables the acquisition of high quality spectra of the proteins. Also, there is no spectral interference (spectra not shown in this article) in the Amide I region from the hydrophobic substrate, water, or from the PBS buffer used in this study.
Conclusion
Biologics are becoming an ever increasing population of the drugs entering the pharmaceutical marketplace. This, along with the high price of biological drug products, makes these drugs extremely attractive to counterfeit, and as each year passes a larger number of illegitimate biological drugs are infiltrating the global market. As such, the need to quickly and accurately fingerprint biological drug products becomes ever increasing. The results in this article detail an effective way to fingerprint biological drug products for counterfeit detection using Drop Coat Deposition Raman (DCDR) Spectroscopy. DCDR offers many distinct advantages including limited or no sample preparation, low sample requirement, and no spectral subtraction for secondary structure predictions for biological drug product, such as IgG. The fingerprint provides a wealth of structural information, and secondary structure classification through the Amide I band in Raman spectra. Therefore, DCDR can be effectively used to screen counterfeit biologics.
References
- Food and Drug Administration (FDA) website, “Counterfeit Medicine”, http://www.fda.gov/Drugs/ResourcesForYou/Consumers/BuyingUsingMedicineSafely/CounterfeitMedicine/
- Food and Drug Administration (FDA) website, “Counterfeit Version of Avastin in U.S. Distribution”, http://www.fda.gov/Drugs/DrugSafety/ucm291960.htm
- R. Cockburn et al., “The Global Threat of Counterfeit Drugs: Why Industry and Governments must communicate the Dangers”, PLoS Medicine (2005) e100, http://journals.plos.org/plosmedicine/article?id=10.1371/journal.pmed.0020100
- http://www.psi-inc.org/counterfeitsituation.cfm
- Quality Considerations in Demonstrating Biosimilarity of a Therapeutic Protein, Guidance for Industry, http://www.fda.gov/downloads/Drugs/GuidanceComplianceRegulatoryInformation/Guidances/UCM291134.pdf
- Scientific Considerations in Demonstrating Biosimilarity to a Reference Product, Guidance for Industry, http://www.fda.gov/downloads/Drugs/GuidanceComplianceRegulatoryInformation/Guidances/UCM291128.pdf
“Screening and Detecting Counterfeit Biologics Drugs”, Ravi Kalyanaraman, Mitesh Chauhan, C. J. Madarang, Michael Ribick and George Dobler, BioPharma Asia, pp. 58-64 (January/ February 2013). - “Immunoglobulin Fc-Fusion Proteins – Part 1: Their Design and Manufacture”, Angela L. Linderholm and Steven M. Chamow, BioProcess International, 12(9), pp. 30-35 (October 2014).
- “Raman Spectroscopy of Proteins: A Review”, A. Rygula, K. Majzner, K. M. Marzec, A. Kaczor, M. Pilarczyk and M. Baranska, Journal of Raman Spectroscopy, 2013, 44, 1061 – 1076.
- “What vibrations tell us about Proteins”, Andreas Barth and Christian Zscherp, Quarterly Reviews of Biophysics, 35, 4 (2002), pp 369 – 430.
- Biochemistry, 5th edition, Jeremy M Berg, John L Tymoczko and Lubert Stryer, Chapter 3: Protein Structure and Function, ISBN-10,0-7167-3051-0.
- “Accurate Secondary Structure Prediction and Fold Recognition for Circular Dichroism Spectroscopy”, Andras Micsonai, Frank Wien, Linda Kernya, Young-Ho Lee, Yuji Goto, Matthieu Refregiers and Jozsef Kardos, PNAS, published online, June 2, 2015, http://www.ncbi.nlm. nih.gov/pmc/articles/PMC4475991/pdf/pnas.201500851.pdf
- “Structure Determination by X-ray Crystallography – Analysis by X-ray and Neutrons”, 5th Edition, Mark Ladd and Rex Palmer, Chapter 10, Proteins and Macromolecular X-Ray Analysis, pp 489 – 546, ISBN 978-1-4614-3954-7 (eBook).
- “Relationship Between Nuclear Magnetic Resonance Chemical Shift and Protein Secondary Structure”, D. S. Wishart, B. D. Sykes and F. M. Richards, Journal of Molecular Biology, Vol. 222, issue 2, 20 November 1991, pages 311 – 333.
- “Obtaining Information About Protein Secondary Structures in Aqueous Solution Using Fourier Transform IR Spectroscopy”, Huayan Yang, Shouning Yang, Jilie Kong, Aichun Dong and Shaoning Yu, Nature Protocols, Vol. 10, No. 3, 2015, pages 382 – 396.
- “Circular Dichroism Spectroscopy has Intrinsic Limitations For Protein Secondary Structure Analysis”, Sergei Khrapunov, Analytical Biochemistry, Volume 389, Issue 2, 15 June 2009, pages 174 – 176.
- “Limitations and Lessons in the Use of X-ray Structural Information in Drug Design”, Andrew M. Davis, Stephen A. St-Gallay and Gerard J. Kleywegt, Drug Discovery Today, Volume 00, Number 00, July 2008, pages 1 – 11.
- “Protein NMR Spectroscopy: Principles and Practice”, 2nd edition, John Cavanagh, Wayne J. Fairbrother, Arthur G. Palmer III, Mark Rance and Nicholas J. Skelton, ISBN 13:978-0-12- 164491-8.
- “Methods in Molecular BioPhysics: Structure, Dynamics, Function”, Igor N. Serdyuk, Nathan R. Zaccai and Joseph Zaccai, Cambridge University Press.
- “Raman Detection of Proteomic Analytes”, Dongmao Zhang, Yong Xie, Melissa F. Mrozek, Corasi Oritz, V. Jo Davisson and Dor Ben-Amotz, Anal. Chem., 2003, 75, 5703-5709.
- “Secondary Structural Change of Bovine Serum Albumin in Thermal Denaturation up to 130 degree C and protective effect of sodium dodecyl sulfate on the change”, Moriyama. Y, Watanabe. E, Kobayashi. K, Harano. H, Inui. E, Takeda. K, J. Phys. Chem. B, 2008, Dec. 25, 112(51), 16585-9.
- “Comparison of changes in the Secondary Structure of Unheated, heated, and highpressure- treated beta-lactoglobulin and Ovalbumin Proteins Using Fourier Transform Raman Spectroscopy and Self-Deconvolution”, Ngarize. S, Herman. H, Adams. A, Howell. N, J. Agric. Food Chem., 2004, Oct 20;52(21), 6470-7.
- “Comparison of the Secondary Structures of Human Class I and Class II Major Histocompatibility Complex Antigens by Fourier Transform Infrared and Circular Dichroism Spectroscopy”, Joan X. Gorga, Aichun Dong, Mark C. Manning, Robert W. Woody, Winslow S. Caughey and Jack L. Strominger, Proc. Natl. Acad. Sci., USA, Vol. 86, pp 2321-2325, April 1989.
- “Validation of the Drop Coating Deposition Raman Method for Protein Analysis”, Ortiz. C, Zhang. D, Xie. Y, Ribbe. A. E., Ben-Amotz. D., Anal. BioChem., 2006, 15, 353(2), 157-66.
- “Drop Coating Deposition Raman (DCDR) for Microcystin-LR Identification and Quantitation”, Halvorson. R. A, Vikesland. P. J., Environ. Sci. Technol. 2011, July 1:45(13), 5644-51.
- “Rapid and Nondestructive Method For Evaluation of Embryo Culture Media Using Drop Coating Deposition Raman Spectroscopy”, Z. Huang, Y. Sun, J. Wang, S. Du, Y. Li, J. Lin, S. Feng, J. Lei, H. Lin, R. Chen, H. Zeng, Journal of Biomedical Optics, 18(12), 127003-1, Dec. 2013.
- “Raman Spectroscopy Adds Complementary Detail to the High Resolution X-ray Crystal Structure of Photosynthetic PsbP from Spinacia oleracea”, V. Kopecky Jr., Jaroslava Kohoutova, Mikalai Lapkouski, Katerina Hofbauerova, Zofie Sovova, Olga Ettrichova, Sergio Gonzalez- Perez, Alexander Dulebo, David Kaftan, Ivana Kuta Smatanova, Jose L. Revuelta, Juan B. Arellano, Jannette Carey, Rudiger Ettrich, PLOS ONE, October 2012, Vol. 7, Issue 10e46694.
- https://en.wikipedia.org/wiki/Phosphate-buffered_saline
- “Characteristic Size for Onset of Coffee-Ring Effect in Evaporating Lysozyme-Water Solution Droplets”, Heather Meloy Gorr, Joshua M. Zueger and John A. Barnard, J. Phys. Chem. B, 2012, 116 (40), pp 12213–12220.
- “Raman Spectroscopy of Protein Pharmaceuticals”, Zai-Qing Wen, Journal of Pharmaceutical Sciences, Vol. 96, No. 11, November 2007, pp 2861- 2878.
- http://www.compbio.dundee.ac.uk/jpred/
- http://www.rcsb.org/pdb/home/home.do
- “Determination of the Secondary Structure of Proteins from the Raman Amide I Band: The reference Intensity Profiles Method”, M. Berjot, J. Marx and A. J. P. Alix, Journal of Raman Spectroscopy, Vol. 18, 289-300 (1987).
Author Biographies
Jeremy Peters, is an Associate Scientist in Global Analytical Technology group in Global Manufacturing and Supply at Bristol-Myers Squibb Company. He is currently involved in developing new and novel techniques for Biological Drug Product Characterization and Structure determination. Prior to joining Global Analytical Technology, Jeremy worked at the Syracuse site of BMS where he was responsible for QC testing of Raw Materials used for Drug Substance batches. Jeremy has a Bachelor’s degree in Chemical Engineering from the New Jersey Institute of Technology.

Anna Luczak, PhD, is a Scientist at Bristol-Myers Squibb Company in the Global Analytical Technology group with Global Manufacturing and Supply and is currently working on development of novel spectroscopic method for detection of counterfeit biologics. She received her Ph.D. in Analytical Chemistry from New Jersey Institute of Technology under the direction of Prof. Zafar Iqbal where she explored Raman spectroscopy for various pharmaceutical applications. Before joining BMS in 2014, she worked at Johnson and Johnson where she was responsible for process improvements of existing products including scale-up and transfer to the supplier site.

Varsha Ganesh is an Associate Scientist at Bristol-Myers Squibb Company in the Global Analytical Technology group with Global Manufacturing and Supply. She received her Masters in Biotechnology from Pennsylvania State University and has been with Bristol-Myers Squibb since 2013. She works on spectral authentication of suspect counterfeits, method development for counterfeit biologics, raw material qualification using vibrational spectroscopic techniques and also on analytical method transfers.

Eugene Park, is a Senior Scientist at Bristol-Myers Squibb Company in Global Analytical Technology with Global Manufacturing and Supply and is currently working on developing NIR and Raman techniques along with the use of chemometrics and other statistical tools to assess quality and performance of Biological Raw materials. He received his B.S. from University of Illinois Urbana-Champaign, and is currently pursuing a PhD in chemistry at the University of Rutgers, Newark. Before joining BMS in 2014, he worked at Merck as a Solid State Chemist in Drug Product Process development where he was responsible for process development and control strategy development/implementation for drug product process risk during commercialization.

Ravi Kalyanaraman, PhD, is an Associate Director at Bristol- Myers Squibb Company in the Global Analytical Technology group with Global Manufacturing and Supply. He received his Ph.D. from the University of Idaho in 1995 and did his postdoctoral work at the University of Puerto Rico. He served as a faculty member in the department of chemistry at Bemidji State University in Minnesota from 1996 to 2001. He has been with Bristol-Myers Squibb since 2002. His laboratory work in the past with Bristol-Myers Squibb was primarily in developing and validating chromatographic methods for Quality control laboratories. In the last seven years he has focused on developing new and novel techniques to detect pharmaceutical counterfeits and raw material identification using vibrational spectroscopic techniques, such as Raman, mid-, and near-infrared (NIR). Currently, he leads a team of analytical scientists that are involved in the forensic and manufacturing investigation for products received from product complaints, corporate security and also from various manufacturing sites including third party manufacturing. Also, his laboratory is currently developing new and novel Raman spectral fingerprint techniques for biologics drugs which can be used to screen counterfeit biologics.