Introduction
Chemical and post-translational modifications, including crystallizable fragment (Fc) glycosylation, that occur in the marketed IgG1 antibody trastuzumab have been extensively reviewed.1-6 Glycosylation of therapeutic proteins is crucial for their biological activity.7,8 Glycosylation profiles vary depending on, for example, production cell type used, fermentation process, or even production scale.9,10 Variance in glycan patterns based on manufacturing variability was described also for marketed antibody products.11,12 This variability might be even more pronounced during development of monoclonal antibodies as a result of multiple changes implemented during process optimization. In the present report, an approach employing reduced trastuzumab samples combined with electrospray ionization mass spectrometry (ESI-MS) analysis for the accurate and robust quantification of Fc glycosylation is presented. This test system provides a routine method for monitoring Fc galactosylation of trastuzumab in a quality control environment.
Experimental Procedures
The recombinant IgG1 antibody Trastuzumab was expressed in a chinese hamster ovary cell system and manufactured at Roche Diagnostics, Penzberg, Germany using standard cell culture and purification technology. Trastuzumab was formulated at a concentration of 25 mg/mL in a His-HCl buffer system (5 mM) at pH 6.0.
ESI-QTOF MS of reduced Trastuzumab
Trastuzumab samples (50 µl, corresponding to 1.25 mg) were denatured by adding 250 µl 6 M guanidinium-hydrochloride and reduced with additional 30 µl 0.1 M Tris(2-carboxyethyl)phosphine hydrochloride for 1 h at 37°C. Buffer exchange to 500 µl ESI- solvent (1% formic acid in 20% acetonitrile) was performed using affinity chromatography columns. For this purpose the columns were equilibrated with 10 ml of the above described ESI-solvent, 300 µl of the reduced Trastuzumab sample was applied and then washed with 350 µl of ESI-solvent. Next,500 µl of ESI-buff er was applied to the columns and the eluate was collected for further analysis. Mass spectrometric analysis of reduced Trastuzumab light and heavy chain variants was performed on a mass spectrometer system. The spectra were recorded in positive ion mode and the m/z range for acquisition was set to 700-2200. Cone voltage was set at 30 V, capillary voltage to 2800 V, and desolvation temperature to 120 °C. Data acquisition was controlled with the mass spectrometry software. The individual data evaluation steps were controlled by an in-house array basic program. Raw data were converted into spc-Files (spectra format), smoothed and 4th deviation spectra were calculated using a Savitzky–Golay fi lter. Molecular masses and relative intensities for the main heavy chain signals (G0F, G1F, G2F, NG) using selected charge states were determined with the spectroscopy software.
Results and Discussion
At the Roche Pharma site for Technical Development in Penzberg (Germany) matrix assisted laser desorption ionization mass spectrometry (MALDI-MS) and electrospray ionization mass spectrometry (ESI-MS) are routinely applied for the detailed structural characterization of therapeutic proteins. Often in combination with liquid chromatography, mass spectrometry (LC-ESI-MS) is utilized to verify the primary structure of proteins and to assess chemical and post-translational modifi cations such as glycosylation, oxidation, deamidation, isomerization, and glycation events.1, 4, 13 Moreover, sensitive mass spectrometry is used to identify low-abundant product related variants (e.g. sequence variants) or process related impurities (e.g. host cell proteins).14
In addition, hydrogen/deuterium exchange and near native mass spectrometry has been emerging as an excellent analytical tool in the analysis of protein structural and size variants.15, 16 For the extended characterization of clinical development and marketed products, mass spectrometry is regularly applied to support batch comparability, protein isoform characterization, formulation and bio-process development studies, and for a range of analytical troubleshooting activities, as required in a good laboratory practice (GLP) environment.

The use of mass spectrometry in a quality control (QC)/good manufacturing practice (GMP) setting is presently being controversially discussed in the field of pharmaceutical analysis of therapeutic proteins. Mass spectrometry based methods with quantitative data evaluation are typically applied in Quality by Design (QbD) studies, host cell protein profi ling, and sequence variant analysis.13,17-19 Consequently, this raises the question of whether mass spectrometric test procedures (e.g. for multi-attribute testing at peptide level) should be added to the conventional electrophoretic and chromatographic methods currently used for the product release of bio-therapeutic proteins.20
At Roche Pharma Technical Development in Penzberg (Germany) mass spectrometry has been in routine use for the QC testing of marketed bio-therapeutic proteins since 2002, as outlined in Table 1. Tryptic peptide mapping combined with LC-MS analysis was introduced for the identity testing of Peginterferon alfa-2a drug substance in 2002. Subsequently, ESI-MS analysis of reduced antibody samples was established in 2004 to monitor Fc galactosylation of trastuzumab heavy chain as bio-process consistency parameter. In 2009, identity testing by MALDI-TOF MS for tryptic peptide or released glycan analysis was deployed for clinical development products.

The ESI-MS analysis of Trastuzumab introduced here involves quantitative assessment of mass spectrometric data for application in QC testing with defi ned specifi cations. Here we describe the test principle, the method validation and application results in more detail. Prior to the ESI-MS analysis, the Trastuzumab samples are denatured and reduced using guanidinium hydrochloride and tris(2-carboxyethyl)phosphine.
Subsequently, desalting and buff er exchange to a solvent suitable for ESI-MS is achieved with gel filtration columns. ESI-MS analysis of Trastuzumab by direct infusion is then performed on an ESI-QTOF instrument as described in the experimental procedures section. The determination of the molecular masses and relative contents of the main heavy chain Fc glycosylation variants is achieved with an inhouse array basic data processing program. Figure 1 illustrates a raw mass spectrum of reduced Trastuzumab (upper spectrum) and the smoothed derivative spectrum used for further quantitative determination of heavy chain Fc glycosylation at asparagine 297 (lower spectrum). The complex type bi-antennary core fucosylated oligosaccharide structures G0F (without galactose), G1F (with one galactose), and G2F (with 2 galactose moieties) represent the main glycan variants of Trastuzumab. In addition the non-glycosylated heavy chain variant (NG) was also identifi able by the developed ESI-MS approach. These results are consistent with recent studies reporting detailed characterization of immunoglobulin G Fc-glycosylation by mass spectrometry and separation based methods.4, 5
The described ESI-MS test system was validated according to the International Conference on Harmonization (ICH) guideline on Validation of Analytical Procedures (Q2A and Q2B)21 Accuracy of mass determination and relative quantification of the heavy chain variants, precision (repeatability, intermediate precision), robustness, linearity of quantification, and the lower limits of detection and quantification were assessed by analyzing Trastuzumab batches with different galactosylation content and by utilizing enzymatic approaches for deglycosylation and de-galactosylation. The validation parameters and respective results are summarized in Table 2. In addition, the obtained data for the Fc galactosylation levels from the ESI-MS methodology and the results from an alternative separation-based method, namely high performance anion exchange chromatography with pulsed amperometric detection (HPAEC-PAD) were highly comparable (data not shown).
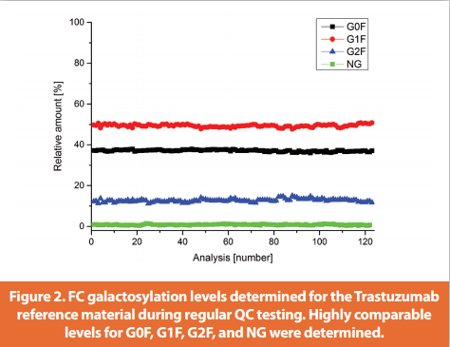
The robustness of the ESI-MS test system was further demonstrated by retrospective comparison of the FC galactosylation determined for the Trastuzumab reference material during regular QC testing. As depicted in Figure 2 highly comparable levels for G0F, G1F, G2F, and NG were determined for >120 analysis (over a period of five years).
More than 500 drug substance batches have been released since the introduction of ESI-MS analysis in the Trastuzumab control system in 2004. Only three system suitability deviations for the test method were observed, and the data presented demonstrates the robustness of the method and its applicability to a quality control (QC)/good manufacturing practice (GMP) environment.
Conclusion
The applicability of mass spectrometry in a quality control setting is presently being controversially discussed in the field of pharmaceutical analysis of therapeutic proteins. However we have demonstrated in detail here the successful application of ESI-MS analysis of reduced antibody samples for quantitative monitoring of the heavy chain Fc galactosylation of trastuzumab as part of the drug substance release testing for over a decade at the Roche Pharma site for Technical Development in Penzberg (Germany). Likewise, MALDIMS and LC-ESI-MS methods are also in routine use for release identity testing schemes.
Due to the high sensitivity and resolution of modern mass spectrometric systems, the application of LC-MS peptide mapping for multi-attribute testing enables the site specific assessment of product variants which is essential to investigate structure-function relationships of protein modifications. This raises the question of whether LC-MS peptide mapping should at least partially replace low resolution electrophoretic and chromatographic methods currently used for the product release of bio-therapeutic proteins.
On the other hand. Release testing by LC-MS peptide mapping with quantitative aspects needs to be carefully evaluated and established with respect to long-term robustness and method transferability to different mass spectrometric systems. Accordingly, the definition of meaningful acceptance criteria for system suitability and batch release (e.g. relative instead of absolute values) is essential. More importantly, it is not quite clear, from a biological relevance point of view, if the definition of acceptance criteria for multiple low abundant productrelated variants derived from naturally occurring chemical and posttranslational amino acid modifications adds value to the control strategy for biologics.
The method introduced here, involving direct application of highresolution electrospray ionization mass spectrometry for monitoring relevant intact therapeutic protein variants, without proteolytic fragmentation and liquid chromatography separation prior to MS analysis, represents a more robust and therefore QC compatible approach for release testing.
Acknowledgements
We are indebted to all members of the Laboratories in Penzberg for valuable discussions.
References
- Diepold K, Bomans K, Wiedmann M, et al. Simultaneous assessment of Asp isomerization and Asn deamidation in recombinant antibodies by LC-MS following incubation at elevated temperatures. PLoS One 2012;7:e30295.
- Harris RJ. Heterogeneity of recombinant antibodies: linking structure to function. Dev Biol (Basel) 2005;122:117-27.
- Harris RJ, Kabakoff B, Macchi FD, et al. Identification of multiple sources of charge heterogeneity in a recombinant antibody. J Chromatogr B Biomed Sci Appl 2001;752:233-45.
- Reusch D, Haberger M, Falck D, et al. Comparison of methods for the analysis of therapeutic immunoglobulin G Fc-glycosylation profiles-Part 2: Mass spectrometric methods. MAbs 2015;7:732-42.
- Reusch D, Haberger M, Maier B, et al. Comparison of methods for the analysis of therapeutic immunoglobulin G Fc-glycosylation profiles--part 1: separation-based methods. MAbs 2015;7:167-79.
- Shen JF, Kwong, M.Y., Keck, R.G., Harris, R.J. The application of tertbutylhydroperoxideoxidation to study sites of potential methionine oxidation in a recombinant antibody. In: DR Marshak (Ed), Techniques in Protein Chemistry VII Academic Press Inc 1996:275-84.
- Jefferis R. Recombinant antibody therapeutics: the impact of glycosylation on mechanisms of action. Trends Pharmacol Sci 2009;30:356-62.
- Jenkins N, Murphy L, Tyther R. Post-translational modifications of recombinant proteins: significance for biopharmaceuticals. Mol Biotechnol 2008;39:113-8.
- Ahn WS, Jeon JJ, Jeong YR, Lee SJ, Yoon SK. Effect of culture temperature on erythropoietin production and glycosylation in a perfusion culture of recombinant CHO cells. Biotechnol Bioeng 2008;101:1234-44.
- Pacis E, Yu M, Autsen J, Bayer R, Li F. Effects of cell culture conditions on antibody N-linked glycosylation--what affects high mannose 5 glycoform. Biotechnol Bioeng 2011;108:2348-58.
- Raju TS, Jordan RE. Galactosylation variations in marketed therapeutic antibodies. MAbs 2012;4:385-91.
- Schiestl M, Stangler T, Torella C, Cepeljnik T, Toll H, Grau R. Acceptable changes in quality attributes of glycosylated biopharmaceuticals. Nat Biotechnol 2011;29:310-2.
- Haberger M, Bomans K, Diepold K, et al. Assessment of chemical modifications of sites in the CDRs of recombinant antibodies: Susceptibility vs. functionality of critical quality attributes. MAbs 2014;6:327-39.
- Bomans K, Lang A, Roedl V, et al. Identification and monitoring of host cell proteins by mass spectrometry combined with high performance immunochemistry testing. PLoS One 2013;8:e81639.
- Haberger M, Heidenreich AK, Schlothauer T, et al. Functional assessment of antibody oxidation by native mass spectrometry. MAbs 2015;7:891-900.
- Haberger M, Leiss M, Heidenreich AK, et al. Rapid characterization of biotherapeutic proteins by size-exclusion chromatography coupled to native mass spectrometry. MAbs 2016;8:331-9.
- Doneanu CE, Xenopoulos A, Fadgen K, et al. Analysis of host-cell proteins in biotherapeutic proteins by comprehensive online two-dimensional liquid chromatography/mass spectrometry. MAbs 2012;4:24-44.
- Schenauer MR, Flynn GC, Goetze AM. Profiling the effects of process changes on residual host cell proteins in biotherapeutics by mass spectrometry. Biotechnology progress 2013.
- Zeck A, Regula JT, Larraillet V, et al. Low level sequence variant analysis of recombinant proteins: an optimized approach. PLoS One 2012;7:e40328.
- Rogers RS, Nightlinger NS, Livingston B, Campbell P, Bailey R, Balland A. Development of a quantitative mass spectrometry multi-attribute method for characterization, quality control testing and disposition of biologics. MAbs 2015;7:881-90.
- Walfish S. A statistical perspective on the ICH Q2A and Q2B guidelines for validation of analytical methods. Biopharm Int 2006;19:28-+.