Abstract
Raw material variability can impact lifecycle of a biopharmaceutical manufacturing process as it could dictate operational and business strategy chosen to mitigate raw material associated risks. Differences from lot-to-lot could affect growth and productivity, create purification problems that could lead to operation issues and even delay or prevent product release. Understanding the source and degree of impact of raw material variability prior to use in the manufacturing process could prevent deleterious events from unfolding. It is possible to monitor lot- to-lot variability of incoming materials by creating multivariate models using Raman spectra.
Introduction
There are many uses of Raman spectroscopy in the biopharmaceutical and pharmaceutical industry. 1-7 Raman Spectroscopy is a spectroscopic technique based on inelastic scattering of monochromatic light from a laser source. Photons from the laser are absorbed by the raw material bonds and then reemitted at a different frequency. The frequency which the reemitted photons are shifted in comparison with the original laser frequency is called Raman shift. The Raman scans provide unique information about each molecule. Once configured, the Raman instruments can be used to identify incoming raw materials. 8 Sample preparation is not needed for Raman spectroscopy as Raman can penetrate plastic bags and clear/amber colored glass bottles thereby maintaining the integrity of the material. Compared to traditional testing and identification methods, the non-invasive Raman Spectroscopy is faster and less intrusive while providing detailed information about the sample.
Beyond identification, multivariate models can be built based on Raman data to monitor trends among raw material lots by detecting impurities and track subtle property differences for incoming lots within a specific raw material. This method of raw material monitoring is an enhancement to traditional way of monitoring based mostly on data found on certificate of analysis. As the industry moves towards electronic data transfer, data from electron certificate of analysis can be combined with spectroscopy data to monitor raw material variability in a holistic fashion. 9 A case study using glucose will be demonstrated to illustrate the application.
Discussion
Figure 1 shows raw Raman scans from 5 different lots of glucose denoted by color. Each lot has been scanned multiple times. The intensity difference is due to different instrument settings. In order to normalize the different scans observed for the same material, pre- processing of Raman scans is necessary. 10

Figure 1. Five Glucose Raman Scans shows intensity difference due to variable Raman instrument settings.
The glucose dataset shown in Figure 2 is preprocessed with two filters: Standard Normal Deviate (SNV) and 1st derivative filters. SNV is applies a mathematical filter to give individual spectrum a zero mean value and a variance equal to one, independent of original Raman intensity values. First derivative helps eliminate noise and smooth out the spectra. The derivatives were calculated from moving quadratic submodels, each with 15 data points long. The distance between each data point (Raman shift) was 1. Edge effects are excluded from the model and all variables are centered. To further capture the most significant characteristics of spectra, contribution scores between signature and result spectra are inspected, which revealed the weighted difference between the average of the signature and the result data.

Figure 2. Pre-processed Raman data.
Once the data has been pre-processed, a multivariate model such as Principal Component Analysis (PCA) model can be built to evaluate relationships between the raw material lots. All the spectra are trimmed to only include the 350-1800 cm -1 range to eliminate the contribution from plastic bags and noise (system and environment).
PCA gives an overview of how each observation are related to one another – in this case, how each lot of glucose relates to each other. In addition, PCA also provides understanding of the relationships among the variables.
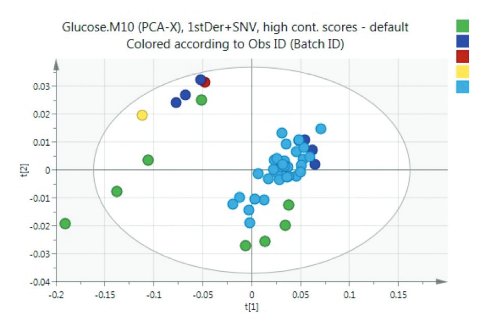
Figure 3. Scores Plot of PCA Model.
Figure 3 shows a scores plot of a glucose model. The scores t1 and t2 are new variables summarizing the X variables and they are orthogonal to each other. In this model, there are only 2 components and hence only 2 scores. In theory there can be as many scores as components in the model. Observations near each other on the scores plot are similar, observation far away from each other are dissimilar. This plot shows the possible presence of outliers, groups, similarities and other patterns in the data. The lots are scattered all across the four quadrants, which is ideal and expected from the training set.

Figure 4. Hotelling T
2 plot of glucose model.
Figure 4 shows a Hotelling T 2 plot displaying higher variability of scans from the green glucose lot. Hotelling T 2 plot is ideal for identifying variation of similar observations.
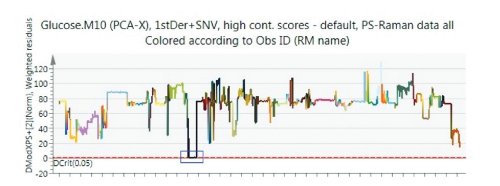
Figure 5. istance to Model X plot of other raw materials projects onto the glucose model. The box highlighted in blue shows that only the glucose lots are not identified as outliers.
Distance to Model X (DModX) plot is another analysis that is useful in evaluating raw material lot variability. DModX is a measure of the residual standard deviation of the X observation. This analysis is ideal at detecting outlier lots that do not correlate well with the model. Figure 5 shows when other raw material Raman scans are projected onto the glucose model, DModX flagged them as outliers. This could be used as an advanced method to perform identification testing when receiving raw materials into facilities.
Conclusion:
Building multivariate models using Raman spectral data is a simple yet effective way to trend raw materials variability. These powerful models can take spectral information from different lots of the raw material and use the information to quantify variability. When properly implemented with quality control procedures, these models could be used in Quality to Supply Chain to detect conforming lots. Additional process and supplier information can also be added to the PCA models to enable end-to-end trending of raw material variability.
References
- Wen Z-Q 2007. Raman spectroscopy of protein pharmaceuticals. J Pharm Sci 96(11):2861-2878
- Sasic S. 2008. Pharmaceutical Applications of Raman Spectroscopy. 1st ed.: John Wiley & Sons, Inc
- Cao X 2013. Raman spectroscopy in support of biotherapeutic production: applications in protein formulation and purification. European Pharmaceutical Review. 18 (5): 34-38
- Wen Z-Q, Cao X, Phillips J 2010. Application of Raman spectroscopy in biopharmaceutical manufacturing. Am Pharm Rev 13(4):46, 48, 50-53
- Jayawickrama D, El Hagrasy A, Chang S-Y 2006. Raman applications in drug manufacturing processes. Am Pharm Rev 9(7):10, 12-15, 17
- Fini G 2004. Applications of Raman spectroscopy to pharmacy. J Raman Spectrosc 35(5):335-337
- Vankeirsbilck T, Vercauteren A, Baeyens W, Van der Weken G, Verpoort F, Vergote G, Remon JP 2002. Applications of Raman spectroscopy in pharmaceutical analysis. TrAC, Trends Anal Chem 21(12):869-877
- Wang, T.Y., Meriage, D., Craig, L., Parks, K., Cao X., Wen, Z. and C. Undey 2015, Development consideration of adapting Raman spectroscopy for raw material fingerprinting. Am Pharm Rev 18(7), Sep/Oct2015, 54-58
- Wang T., Looze, B, Wang T.Y., Low D., and Undey C. An electronic format for data exchange between raw material suppliers and end users enables superior knowledge management. Pharmaceutical Engineering, Aug, 2015, pp 71-78
- Huang, J., Romero-Torres, S. and M. Moshgbar 2010 Practical considerations in data pre- treatment for NIR and Raman spectroscopy. Am Pharm Rev Sep/Oct 2010, 116-127
Author Biographies
Tony Wang is a Principal Engineer in Process Development at Amgen. He is responsible for multivariate data analysis, computer simulation and modeling including model predictive control and furthering PAT with Raman technology. Tony holds a B.Sc. in chemical engineering and a M.Sc. in biomedical engineering from University of Calgary, Canada. Tony is also a certified Professional Engineer (P.Eng) with APEGA.
Weiqi (Vicky) Wang was a summer undergraduate intern in Process Development at Amgen. She worked mainly on multivariate data analysis and empirical modeling with Raman technology and production process variables. Vicky is a M.Sc. candidate in biomedical engineering at Washington University in St. Louis.
Gregg Schorner is an Associate Scientist in Process Development at Amgen. He performs data gathering and analytics, process optimization, multivariate data analysis, computer simulation and modeling including model predictive control and supports furthering Process Analytical Technology (PAT ) with Raman technology. Gregg holds a B.Sc. in Molecular Biology, with a Microbiology Minor from the Pennsylvania State University.
Myra Coufal, Principal Scientist at Amgen, leads Process Analytics within Digital Integration and Predictive Technologies group of Process Development. Her responsibilities include developing mathematical models and Process Analytical Technology (PAT ) tools for commercial manufacturing and process improvement. Myra earned a Biochemistry B.A. from Harvard University, and a Biology Ph.D. from the Massachusetts Institute of Technology.