Abstract
While freeze-drying modeling is well established and documented, the extent of its application to routine operations, including development and manufacture, has not yet been fully realized. A survey, conducted by the BPOG collaboration of major pharmaceutical companies, revealed that only a few companies use modeling for scale up and transfer. For the last year, the collaboration has been combining individual company efforts with the aim of harmonizing best practices and helping to define minimum regulatory standards. This paper outlines different applications of modeling to freeze-drying of biopharmaceutical products at commercial scale. It also signals the intent of the BPOG collaboration to champion a wider adoption, and realize the full potential of modeling across the industry to standardize lyophilization practices, accelerate technology transfers and optimize operational performance.
Introduction
Freeze-drying (aka lyophilization) is a well-known process which has been used for many years for the conservation of food, pharmaceuticals and biological products.1 Lyophilization is a very complex process that requires unique knowledge of engineering, chemistry and biology. In the past, the lyophilization process was largely developed through trial and error which led to lengthy and costly development efforts, at both laboratory and commercial scales. Primary drying, which is the longest and most complicated step, has always been the focus of cycle optimization since it has the greatest economic impact.2 One of the first notable attempts in understanding the impact of process parameters and product properties on primary drying was published by M.Karel3 who applied basic heat and mass transfer principles to the calculation of primary drying time and product temperature profile for product dried as a slab. Later, Liapis and co-workers4-7 made significant contribution to the understanding of the process by modeling primary and secondary drying stages for vial and tray held product. Substantial efforts to improve the modeling of freeze-drying processes were also made by groups of researchers from Italy8-10 and France.11 The most influential, in the opinion of the authors, was work published by M.Pikal and co-workers on one-dimensional steady-state modeling of vial freeze-drying.12-13 This foundational work by them showed how pressure and shelf temperature impact both product temperature and drying time for some pharmaceutical excipients and provided some guidance for the process design. Later, Pikal et al14 introduced a non-steady state two-dimensional model of vial drying which was used as a basis for primary and secondary drying modeling software (Passage). While modeling of primary and secondary drying steps is, apparently, very well established in the literature, the use of modeling in process development and scale up by the pharmaceutical industry is not extensively reported. Few references can be found in literature 16-19 that discuss the use of modeling in process scale up and transfer. It is also not clear how well recent advances in modeling have been implemented across industries for routine product development and manufacture.

Use of Modeling in The Lyophilization Process Design and Scale Up: Results of Industry Survey
While conferences, publications, and on-line forums offer opportunities for industry and academia to share experiences in modeling of freeze-drying, the authors believe there is more that can be done in this area to advance the uptake of modeling. A recently established collaboration is the BioPhorum Operations Group’s Lyophilization Workstream, which provides opportunities for fifteen pharmaceutical companies to discuss gaps in the different areas of freeze-drying in biopharmaceutical manufacturing. The work stream started by establishing a harmonized lyophilization model for process design, technology transfer, scale up and deviation management, in a way that would be acceptable to regulatory agencies.
In 2015 a survey of eleven companies was conducted to understand how modeling is used for freeze-drying operations in each company. No modeling of the freezing step was reported by these companies even though the companies were aware of the work published on this topic.15 Given that software11-14 is available it was surprising to learn that secondary drying modeling was also not commonly used. For primary drying, which is the most complicated step and the most impactful to product quality, Passage14 and few variants of the steady state models of primary drying were commonly used. The applications of primary drying models in various companies included process development and optimization, scale up and technology transfer, and deviation analysis. The results from the survey are shown in Table 1.
Table 1. Results of survey: Five companies (listed by numbers) out of 11 surveyed, were using modeling in freeze-drying operations
The survey shows that, of the eleven companies surveyed, five companies use primary drying models to assist in process development, cycle optimization and scale up. Two out of eleven companies use modelling to assess deviations during freeze-drying process. Only one company reported of use of modeling in regulatory submissions but did not provide any modelling details (inputs, model description, etc.) to the regulatory agency. The survey also revealed that companies use a variety of lyophilization modeling approaches even though they are all based on the same underlying theory. To facilitate movement towards a shared adoption of best practices across the industry, the group decided to use a common model, a steady state model of primary drying which includes characteristics of lab scale, pilot scale and commercial dryers to facilitate the process of scale up. Also, the model is incorporated into an Excel® based tool which makes it easier to use and adopt across all industries without the need for special software and licenses.
Description of the Primary Drying Model
The primary drying model adopted by the BPOG workstream is based on the work published by M.Pikal12-13 and is modified to be implemented in Excel. The members of the workstream are currently developing recommendations for minimum standards and best practices to use the model. These efforts will take some time and in the meantime, for on-going manufacturing and development needs, companies continue to use variants of this model and different tools which they consider appropriate. The Excel® platform was chosen to facilitate ease of use and adoption by scientists and engineers across all companies.
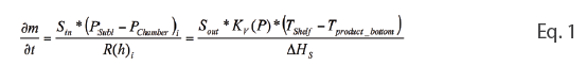
The heat and mass transfer balance during sublimation is described by Equation 1.
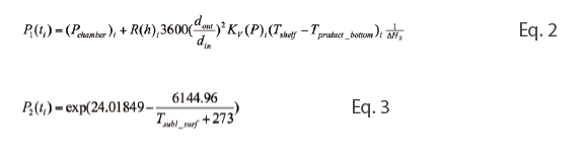
By re-arranging equation 1, the pressure over the sublimation surface can be estimated from Equation 2. At the same time, the pressure over the sublimation surface can be calculated from Equation 3 (P-T diagram for ice.20)
Where temperature at sublimation surface is calculated using Equation 4

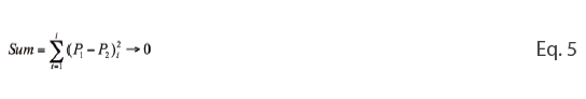
To initiate calculations, the product temperature at the bottom of the vial is entered in to the Excel® template. The algorithm calculates the pressure over the sublimation surface using equations 2 and 3. Using Excel® Solver, the difference between pressure values at each step of the sublimation process is minimized by varying temperature at the bottom of vial (Equation 5).
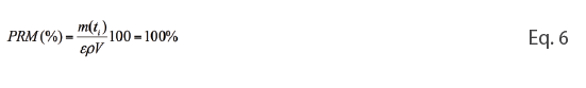
The calculations are assumed to be complete at the time point where the proportion of removed water (ratio of mass of sublimed water, calculated by integration of sublimation rate, over total amount of ice in formulation) reaches 100% (Equation 6).
A description of all the terms used in equations 1-6 is given below.

Two assumptions were made in this model: i) all the heat received by the product is used for sublimation; ii) the vial heat transfer coefficient at a certain pressure is constant within a wide range of shelf temperatures.
An illustrative example of the Excel® interface is shown in Figure 1 (not related to any product).
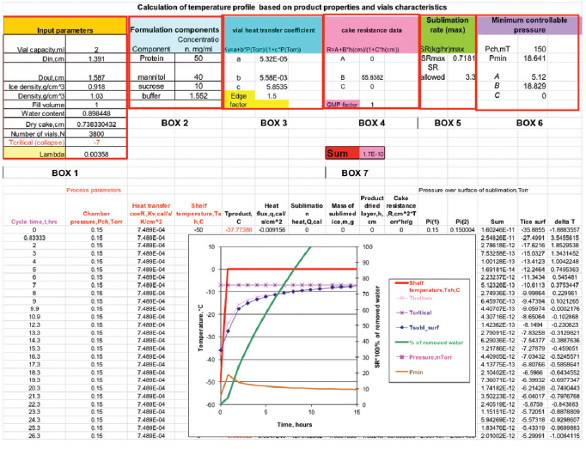 Figure 1. Primary drying template/interface. Box 1 includes vials dimensions, densities of ice and solution, solids content, number of vials and heat conductivity of frozen material. Box 2 is product formulation. In Box 3 are coefficients in Kv=f(P) equation and edge effect. Box 4 comprises cake resistance coefficients. Box 5 has the calculated sublimation rate and maximum sublimation rate for a dryer. Box 6 are coefficients for the estimation of the minimum controllable pressure. Box 7 shows the solutions.
The model requires a few input parameters: characteristics of product and container closure, characteristics of freeze-dryer for which cycle is calculated. The Excel template is also very flexible: one could design multistep shelf temperature and pressure profiles (assuming steady state conditions at each step) and assess the feasibility and performance of a freeze dryer.
Vial heat transfer coefficients as a function of pressure and cake resistance as a function of dry cake height are calculated using equations taken from literature.12,13. Heat transfer coefficients as a function of pressure should be measured for the vial of interest for the particular dryer. Edge effects (amount of heat received by edge vials divided by the amount of heat received by an average center vial) should also be measured or calculated. Cake resistance could be estimated by microbalance21 or other alternative techniques.22-24 The GMP factor, shown in Box 4, accounts for the increase in cake resistance when the product is transferred from a laboratory to GMP-like conditions. The increase in cake resistance during aseptic manufacture is attributed to lowering of ice nucleation temperature in low particulate conditions typical of GMP environments.25
The Excel model, calculates the product temperature profile as a function of process parameters (time, shelf temperature and pressure) and compares the calculated temperature to the maximum allowed temperature (typically collapse temperature) for a particular product. Several iterations are typically required to optimize cycle parameters so that product temperature is kept safely below the maximum allowable temperature. The sublimation rate (product of number of vials and sublimation rate of individual vial) at each step and minimum controllable pressure (Pmin) associated with this sublimation rate are also calculated. The algorithm then compares the calculated value of minimum controllable pressure and pressure set point at each step. The model has the capability to highlight conditions where the minimum controllable pressure is higher than the chamber pressure set point for any given cycle design. The user is expected to adjust the set point and repeat the calculations until the condition Pmin ≤ Pchamber is satisfied.
The values of minimum controllable pressure as a function of sublimation rate can be measured during sublimation tests18 for a particular dryer. The values are typically fit to the first or second order polynomic equation whose coefficients A, B and C are inputs into the model.
The maximum sublimation rate is considered to be a rate at which condenser temperature exceeds -40°C. The error in product temperature prediction from the model is typically +/- 1°C, while the error in drying time prediction is typically +10-30% when compared to experimental times.
Industry Perspective on Application of Modeling
Despite its apparent simplicity, the model described above, can be used for several applications. A few important applications of the model that have been successfully implemented by some companies are listed below.
- Cycle Design and Optimization (Figure 2);
- Process Scale-up and Transfer (Figure 3);
- Increase Process Understanding and Assist in Deviation Analysis (Figure 4)
- Asses Product Quality impact during Primary Drying (collapse, Figure 5)
- Evaluate Process Design Space (shelf Temperature vs pressure vs sublimation rate vs product temperature: example of design space diagram shown in (26))
 Figure 2. Application of model for process design and optimization
Figure 2 shows an example of process design and cycle optimization for a clinical size dryer. In this example, the shelf temperature during the initial stage of primary drying is increased as fast as is practically possible for a fully loaded dryer (about 0.5°C/min) while keeping pressure set point above Pmin (minimum controllable pressure). Then, both shelf temperature and pressure were decreased so that the product temperature remained close to the maximum allowed temperature and the chamber pressure remained above the calculated value of Pmin at all points during primary drying. Note that cycle parameters for laboratory scale dryers may be different from that shown in Figure 2 but the main principle applies: product temperature profiles should be very similar in both laboratory and commercial dryers.18
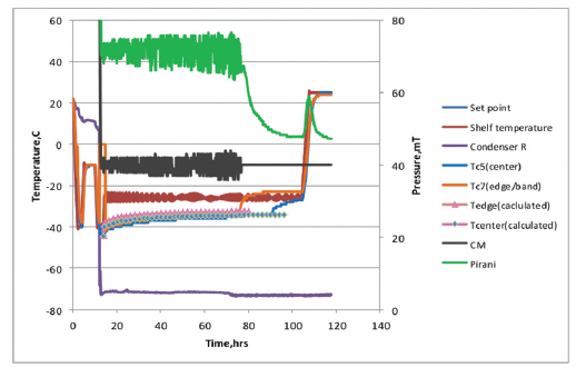 Figure 3. Application of model for process transfer and scale up
In the second example (Figure 3) a typical scale up application is used. The model was used to calculate product temperatures for edge and center vials for a protein- containing formulation with a relatively low collapse temperature (about -32°C). In this example the edge effect was assumed to be about 50%, and the GMP factor set to 1.5. First, cycle parameters for edge vial were calculated ensuring that the product temperature does not exceed the maximum allowed value. Then, using the same process parameters, a product temperature profile for the center vial was calculated. In this example, the calculated drying time was only 10% shorter than actual drying time used (estimated as the time when the product temperature reaches shelf temperature). For practical reasons during engineering runs, a more conservative approach could be taken (20-30% increase from the calculated values) since cake resistance values in GMP conditions may vary.
 Figure 4. Application of model for analysis of process deviations
In example 3 (Figure 4), the model was used to assist in increased process understanding and assess the potential impact on product quality during a process deviation. During this example of a commercial run, the valve between the condenser and pump was accidentally closed resulting in the chamber pressure exceeding the upper alarm limit. When the upper limit was reached, the shelf was automatically chilled to the safe temperature of -30°C. Since those cycle conditions were never tested during robustness studies, conditions in the primary drying cycle were evaluated using the model. It was estimated that product temperature never exceeded the collapse temperature of -9°C during entire process. Based on the model results, it was concluded that this deviation could not affect product quality (as was confirmed later by product testing). This example demonstrates how quick calculations could support investigations, typically initiated after a process deviation.
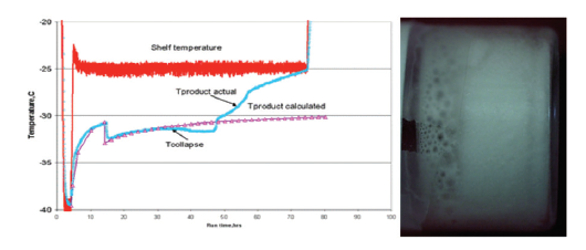 Figure 5. Application of model for assesment of product impact (collapse)
Example 4 (Figure 5), shows how the model was used to understand product quality impact during primary drying. A lyophilization process was designed using data from similar protein formulations. It was assumed that the maximum allowable temperature for this product would be about -30°C. While the actual product temperature at the beginning of process was well aligned with the calculated product temperature profile, the temperature began to deviate from calculated values when the product temperature passed -32°C. Visual inspection revealed that the product underwent visual collapse approximately at the same time. The deviation of the actual product temperature from the calculated value was therefore attributed to the product collapse during which resistance of product and, possibly, vial heat transfer coefficient deviated from the values used in the model. The authors speculate that the cake was slightly separated from the vial toward the end of drying producing a gap and reducing overall heat transfer from the vial to the cake which was indicated by a quick temperature decrease (Figure 5).
In addition to the above examples the model can also be used to proactively describe the design space of a lyophilization process, Nail et al.26 The above examples demonstrate the power of the model to help better understand the primary drying process and assist with various freezing drying operations like development, scale up and transfer. However, one should keep in mind that model would not work without generating accurate inputs on: i) vial heat transfer coefficients as a function of pressure and edge effect values for a particular dryer; ii) cake resistance for a particular product and accurate estimate of GMP factor; and iii) the minimum controllable pressure for a dryer as well as maximum sublimation rate.
Collaborative sharing of these three vital model inputs for different dryers in the BPOG group has been particularly helpful. The collaboration will continue to share with each other, estimates for these input parameters and intend to set-up and publish a database covering representative dryers, container closures and products.

About the BioPhorum Operations Group (BPOG)
The BioPhorum Operations Group (BPOG) is a cross industry collaboration that aims to share and develop operational best practices across manufacturing, process development, IT and supply chain. Established in 2008, the BPOG community currently comprises more than 1,800 active participants from 48 companies. Subject-matter experts from BPOG member companies come together to develop common solutions to current and developing industry challenges, facilitate the sharing of knowledge in biopharmaceutical manufacturing and accelerate thinking and practices within the industry.
Summary
While modeling of the lyophilization process, with a special emphasis on primary drying, is well establish in the literature, the actual application in day-to-day operations is not yet common place. The 2015 BPOG survey demonstrated that few companies are using models for scale up, transfer and optimization. Work is required to ensure the value of modeling is fully exploited in the industry and best practice approaches are developed and adopted. Several companies in the BPOG collaboration are currently investing in the characterization of dryers and container-closures to estimate the three key model parameters: vial heat transfer coefficients; minimum controllable pressure; and maximum sublimation rates. Subject matter experts are also developing a user-friendly, standard modelling interface and a database of input parameters for various freeze dryers and container closures. The collaboration plans to publish later in 2017, a more comprehensive manuscript that includes more examples, a refreshed survey of current practices, detailed recommendations on best practices and advice on how some of practical challenges to implementation and regulation could be overcome.
Acknowledgements
The views expressed in the paper are those of the authors and do not reflect policies of any company.
We are grateful for the for the contribution to discussions in the BPOG Lyophilization and work stream from the following people: Ted Tharp, Feroz Jameel (Abbvie); Gioval Scalzo (Amgen); Sajal Patel (AstraZeneca); Stefan Schneid (Bayer); Cherie Parkhurst, Geeta Govindan, Mehak Mehta (Biogen); Xiaodong Chen, Melissa Bentley (BMS ); Alessadra Del Rio (EMD Serono); Benjamin Brel, Vincent Delmotte, Benoit Moreau, Juan J. Diaz (GSK Biologics); Simon Mills (Ipsen); Shailaja Gupta, Melissa Lash (Janssen); Susanne Joerg (Lonza); David Hamilton, Mohamed Abdel Rahim, Jo Schaller, Prakash Sundaramurthi (Merck & Co); David Hiebert, Klas Risveden, Brian Wilbur, Frank Kanka, Jim Searles, Ekneet Sahni (Pfizer ); Charlie Tang (Regeneron); Stuart Wang, Sophie Sun, Michael Deckner and Joris Hoefinghoff (Shire).
References:
- Willams NA, Polli GP. The lyophilization of pharmaceuticals: a literature review. J of Parenteral Science and Technology. 1984; (38)2: 48-59.
- Tang X, Pikal M. Design of freeze-drying processes for pharmaceuticals: practical advice. Pharmaceutical research, 2004; 21(2): 191-200.
- Karel M. Heat and mass transfer in freeze drying. Freeze Drying Adv Food Technol, [Int Course]. 1975; 177-202.
- Liapis A, Bruttini R. A theory for the primary and secondary drying stages of the freeze drying of pharmaceutical crystalline and amorphous solutes: comparison between experimental data and theory. Sep. Technol. 1994; 4:144-155.
- Liapis AI, Bruttini R. Freeze-drying of pharmaceutical crystalline and amorphous solutes in vials: dynamic multi-dimensional models of the primary and secondary drying stages and qualitative features of the moving interface. Drying technology. 1995;13 (1&2): 43-72.
- Sadikoglu H, Liapis AI, Crosser OK. Optimal control of the primary and secondary drying stages of bulk solution freeze-drying in trays. Drying technology. 1998; 16(3-5): 399-431.
- Sadikoglu H, Liapis AI, Crosser OK, Bruttini R. Estimation of the effect of product shrinkage on drying times, heat input and condenser load of the primary and secondary drying stages of the lyophilization process in vials. Drying technology. 1999;17(10): 2013-2035.
- Barresi AA, Pisano R, Fissore D, Rasetto D, Velardi SA, Vallan A, Parvis M, Galan M. Monitoring of the primary drying of a lyophilization process in vials. Chemical Engineering and Processing: Process Intensification. 2009; 48(1):408-423.
- Fissore D, Pisano R, Barresi AA. Advanced approach to build the design space for the primary drying of a pharmaceutical freeze-drying process. J Pharmaceutical Sciences. 2011, 100:1, 4922-4933
- R Pisano, D Fissore, AA Barresi, Freeze-drying cycle optimization using model predictive control techniques. Industrial & Engineering Chemistry Research. 2011; 50(12): 7363-7379.
- Trelea IC, Passot S, Fonseca F, Martin M. An interactive tool for the optimization of freezedrying cycles based on quality criteria. Drying Technology. 2007; 25:741-751
- Pikal MJ. Use of laboratory data in freeze drying process design: Heat and mass transfer coefficients and the computer simulation of freeze drying. J Parenter Sci Technol. 1985; 39(3):115-139.
- Pikal MJ, Roy ML, Shah S. Mass and heat transfer in vial freeze-drying of pharmaceuticals: Role of the vial. J Pharm Sci. 1984; 73(9):1224-1237.
- Pikal MJ, Cardon S, Bhugra C, Jameel F, Rambhatla S, Mascarenhas WJ, Akay HU. The nonsteady state modeling of freeze drying: In-process product temperature and moisture content mapping and pharmaceutical product quality applications. Pharm Dev Technol. 2005;10(1):17-32.
- Nakagawa K, Hottot A, Vessot S, Andrieu J. Modeling of freezing step during freeze-drying of drugs in vials. AIChE Journal. 2007; 53(5): 1362-1372.
- Tsinontides S, Rajniak P, Pham D, Hunke W, Placek J, Reynolds S. Freeze drying-principles and practice for successful scale-up to manufacturing. International J Pharmaceutics. 2004; 280: 1-16.
- Kuu W, Hardwick L, Akers M. Correlation of laboratory and production freeze drying cycles. International J Pharmaceutics. 2005; 302: 56-67.
- Tchessalov S, Dixon D, Warne N. Principles of lyophilization cycle scale-up. American Pharmaceutical Review. 2007; March-April: 88-92.
- Pisano R, Fissore D, Velardi SA, Barresi AA. In-line optimization and control of an industrial freeze-drying process for pharmaceuticals. J Pharm Sci. 2010;99(11):4691-709.
- Rambhatla S, Pikal M. Heat and mass transfer issues in freeze-drying process development. In: Constantino H, Pikal M, eds. Lyophilization of Biopharmaceuticals. APPS Press: 2004:75-109.
- Pikal MJ, Shah S, Senior D, Lang JE. Physical chemistry of freeze-drying: measurement of sublimation rates for frozen aqueous solutions by a microbalance technique. J Pharm Sci. 1983;72(6):635-650.
- Milton N, Pikal MJ, Roy ML, Nail SL. Evaluation of manometric temperature measurement as a method of monitoring product temperature during lyophilization. PDA J Pharm Sci Technol. 1997;51(1):7-16.
- Hottot A, Vessot S, Andrieu J. Determination of mass and heat transfer parameters during freeze-drying cycles of pharmaceutical products. PDA J. of Pharm.Sci. and Technol. 2005; 59(2):138-153.
- Kuu W, McShane J, Wong J. Determination of mass transfer coefficients during freeze drying using modeling and parameter estimation technique. International J. Pharmaceutics. 1995;124:241-252.
- Rambhatla S, Ramot R, Bhugra C, Pikal M. Heat and mass transfer scale-up issues during freeze drying: II. Control and characterization of the degree of supercooling. AAPS PharmSciTech. 2004;5(4 article 58):1-9.
- Nail, SL, Searles JA. Elements of quality by design in development of freeze-dried parenterals, BioPharm Int 2008;21(1):44-52
Author Biographies
Dr. Serguei Tchessalov is an Associate Research Fellow at Pfizer Bio Therapeutics R&D (Andover, MA). He received his Ph.D. from Institute of Applied Biochemistry (Moscow) on development of novel methods for formulation and process control during lyophilization. For the past 20 years (in Russia and US) he was working on formulation and lyophilization process development of bacterial and viral vaccines, proteins and different biological materials. His current research is focused on lyophilization process scale up as well as processing of parenteral dosage forms (filtration, filling, freezing/thawing and etc).

Dawood Dassu has been a BPOG Facilitator for 2 years. He initially trained as a statistician at the University of London and worked as an internal and external consultant in pharmaceutical R&D and operations. Dawood has worked in regulatory pre-clinical safety assessment and on evaluation of new R&D technologies. He has led various operational excellence and innovation programs in the industry for the last 10 years.

Dave Latshaw II is a Scientist within Janssen Supply Chain at Janssen Pharmaceuticals (J&J) with a Ph.D. in Chemical Engineering and a minor in Biotechnology from North Carolina State University. His graduate research examined protein aggregation in the presence of macromolecular crowding, aqueous-organic interfaces, and small molecule aggregation inhibitors using computational biophysics. During his time at Janssen Dave is focusing on utilizing large scale data analysis and modeling to optimize and enhance all aspects of the pharmaceutical development pipeline from development to commercial manufacturing.

Suresh Nulu is a Sr. Engineer within the Drug Product, Engineering and Technology Organization in Biogen Inc. He has over 10 years of experience in applying Computational Fluid Dynamics and other first principle models to Biopharmaceutical processes and equipment. At Biogen, he develops and implements fit –for-purpose models to ensure rapid and efficient Drug Product development and tech transfers. He passionately advocates for the use of high fidelity models across all aspects of biopharmaceutical processing, to ease resource and fiscal burdens on organizations.