Introduction
Nuclear Magnetic Resonance (NMR) spectroscopy is an indispensable tool in the pharmaceutical industry, with uses in drug discovery, development, and manufacturing. The majority of NMR performed in drug discovery is one-dimensional (1D) 1 H, 13C, and 19F NMR, used by synthetic chemists to quickly confirm a structural modification to a familiar molecule, and an NMR instrument configured for “walk-up” service can measure hundreds of such spectra daily. In more challenging cases, for example when the structure of a molecule is unfamiliar or the structure of a familiar molecule must be elucidated more completely, two-dimensional (2D) NMR is used. There are a great variety of 2D experiments, which can correlate atoms in a molecule according to chemical bonds or according to the distance between them in space. One practical consequence is that the structure of most small molecules can be determined completely from a few 2D measurements. Another consequence is that from the variety of experiments available, there is generally some combination of 2D measurements that will allow elucidation of even the most complex molecules.
The drawback of 2D NMR is measurement time, since these experiments commonly take 10 to 1000 times longer than typical 1D experiments. Since walkup instruments at many pharmaceutical companies are often configured with a “day queue” for quick experiments, many 2D experiments are run in an overnight queue, slowing the structural analysis. Non-Uniform Sampling (NUS) is an acquisition method for NMR experiments with two or more dimensions that skips some fraction of data that would usually be measured.1-3 NUS is already widely familiar in biomolecular NMR, and can benefit other NMR applications as well. For example, with no special effort, NUS can reduce measurement times by a factor of two for routine 2D small molecule NMR, potentially allowing 2D measurements that would normally be deferred for overnight collection to be delivered on the same day instead. For more advanced measurements, greater improvements can be achieved, making it possible to resolve signals that would not be practical to see otherwise, so that structure elucidation is faster and more effective.
While the benefits of NUS seem obvious, its use in pharmaceutical applications is not as widespread as it might be. In part, this is because NUS is still an active research topic in biomolecular NMR, and there continue to be numerous publications about choosing the pattern of points that will be skipped in an NUS measurement (the sampling schedule), and about the special reconstruction methods needed to convert NUS data into a spectrum.4-15 As a result, it’s easy to get the impression that NUS is not a mature technique. However, current research on NUS is focused primarily on protein structure applications, where spectra have many hundreds or thousands of signals, three to four dimensions or even more, relatively low signal to noise, and measurement times that can span days.
So, while there are many NUS sampling schemes and reconstruction methods, the differences between them are more critical for extreme cases: high spectral complexity, high dynamic range, low signal to noise, and three or more dimensions. We show here that for an example small molecule 2D application, where NUS is used to reduce measurement time by a factor of 8, there is no practical impact of NUS sampling schedule type or reconstruction method. As we show, when employed properly, NUS can generate spectra without artifacts, and without influencing quantification. NUS is a robust technique, and pharmaceutical applications can benefit from its regular use.
One and Two Dimensional NMR
In a 1D NMR experiment, a sample is placed in a magnetic field, stimulated with a sequence of one or more radio-frequency (RF) pulses, and RF signals are emitted as the sample returns to equilibrium. The signals are sampled as uniformly-spaced points separated by time Δt2, collected up to a time t2max, and this directly-detected time series is Fourier transformed to generate a spectrum. In this uniformly-spaced time series, the spacing between points determines the spectral bandwidth (smaller spacing Δt2 gives larger spectral width) and the duration of the series determines the resolution (larger t2max gives higher resolution).
An overview of 2D NMR is shown in Figure 1. In a 2D experiment, an indirect time-series dimension is created by repeating a 1D NMR experiment using two or more RF pulses. The time between pulses, the evolution time, is systematically incremented by a fixed amount Δt1 at each 1D measurement, up to a maximum evolution time between pulses of t1max. Since the 2D measurement proceeds by incrementing an evolution time, the 1D measurements comprising a 2D experiment are referred to as “increments.” The effect of this systematic incrementation is that signals in the 1D experiment are modulated according to desired chemical information.
 Figure 1. Two-Dimensional NMR.
The series of 1D measurements forms a 2D matrix. The rows of this matrix are the directly-detected 1D experiments, each a uniformly spaced time series. The columns comprise the indirect dimension, which also behaves like a uniformly-spaced time series, because the evolution time has been incremented by a fixed amount Δt1 at every 1D measurement. The rows of the resulting 2D matrix are Fourier transformed to generate an interferogram, and the columns of the interferogram are Fourier transformed to give a 2D spectrum.
In the directly-detected dimension, the amount of measurement time needed depends on the duration t2max, regardless of how many points are sampled over that span of time. For example, if a signal is sampled for a duration of one second, it does not matter how many or few points are measured, the measurement will still take one second to complete.
For the indirect dimension, the situation is different. In the indirect dimension, spectral width is determined by the size of the fixed time increments Δt1, and resolution is determined by the largest evolution time used, t1max. However, in the indirect dimension, overall measurement time depends on the number of increments measured, rather than on the duration t1max. So, in the indirect dimension, we have the potential to influence measurement time independently of the desired resolution. In NUS, a subset of the 1D measurements between the first and last are skipped. Since the maximum duration t1max is still the same, the resolution is unchanged. But since fewer 1D measurements are acquired, the overall 2D measurement time is reduced.
Non-Uniform Sampling Schedules
Since NUS skips some subsets of the 1D measurements in a 2D spectrum, the indirect dimension contains “gaps” relative to a conventional measurement. As a result, the Fourier transform, widely relied upon in NMR, is no longer appropriate, and other reconstruction methods must be used. Therefore, there are two key aspects to applying NUS: choice of sampling schedule (the pattern of increments to measure or to skip) and choice of reconstruction method.
Since NMR signals decay exponentially, an early suggestion was to use schedules with exponentially-weighted density, so that more samples would be collected earlier in the time series where the signal was strongest, leading to a spectrum with improved signal to noise.1,16 Another alternative is a simple uniform random sampling schedule, particularly appropriate for measurements where the signal has little or no decay.2 More recently, Poisson-gap sampling schedules have been employed, arranged to make gaps more likely in the center of the schedule (sine-weighted Possion-gap sampling) or at the end of the schedule (cosine-weighted Possion-gap sampling).5,9
An Example Small-Molecule Application of NUS
To illustrate the value of NUS, we demonstrate its use on 2D 1 H/13C correlation spectra of Glycoursodeoxycholic acid (G-UDCA), a bile acid-glycine conjugate. The structure of G-UDCA is shown in Figure 2. In the 2D 1 H/13C correlation experiment, each signal from a 1 H atom in the sample is modulated according to the signal from the 13C atom to which it is covalently bonded. A collection of such spectra for G-UDCA (6 mg in 0.04 ml DMSO in a 1.7mm NMR tube) with and without NUS are shown in Figure 3. Spectra were measured at 600 MHz with a 1.7mm cryogenic probe, using spectral widths of 6600 Hz 1 H, 25000 Hz 13C, and 512 complex points acquired in 1 H. A graphical representation of the 13C sampling schedule used is shown below each spectrum, with the positions sampled over 1024 increments colored in blue. Spectra were processed using NMRPipe17, with cosine-squared apodization in 1 H, cosine apodization in 13C, and zero filling to 1024 1 H x 4096 13C real points.
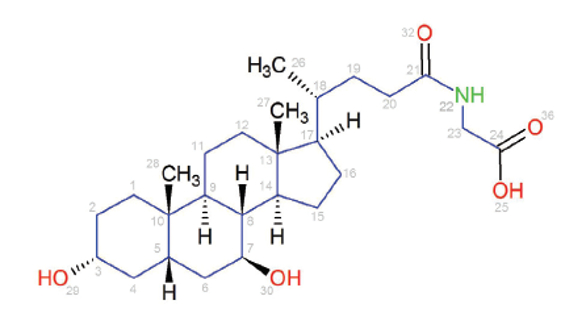
Figure 2. The Structure of Glycoursodeoxycholic Acid (G-UDCA), C
26H
43NO
5 .
By convention, NMR peak positions, also called chemical shifts, are reported in parts per million (ppm), a normalized difference between a signal’s frequency and that of a signal from a reference compound. As presented in Figure 1, a peak’s positon along the horizontal dimension corresponds to an H atom, and its position in the vertical dimension corresponds to the covalently bonded C atom. As a consequence, signals from non-equivalent H atoms bonded to the same C atom will lie along the same vertical position (that is, at the same 13C chemical shift).
The conventional spectrum of G-UDCA measured with 1024 complex increments (Figure 3A), has a pair of peaks centered at 1 H = 3.32ppm, 13C = 70.10ppm, shown expanded in an inset. Since these peaks clearly have different 13C positions, we can conclude they represent signals from H atoms bonded to different C atoms. However, in a conventional measurement with only 128 increments (a factor of 8 shorter measurement time), these two signals are no longer resolved, as shown in Figure 3B. Corresponding 1D 1 H spectra would show that this unresolved signal represents two H atoms, but it is no longer possible to decide whether the two H atoms are bonded to the same C atom, or to different C atoms that have similar chemical shifts. With NUS, the outcome is better. NUS spectra with roughly 128 increments, using sine-weighted, cosine-weighted, and uniform random schedules are shown in Figures 3C, 3D, and 3E. All of these spectra are visually comparable to the conventional spectrum in Figure 3A, and all the NUS spectra can resolve the signals of interest. These NUS spectra were reconstructed by the Iterative Soft Thresholding method (IST)9,12 as implemented in NMRPipe.17Figure 3F shows the uniform random NUS data, reconstructed by the SMILE method instead.14 There is no critical visual difference between the SMILE spectrum and the ones reconstructed by IST. All of the NUS spectra are qualitatively similar to the fully sampled spectrum, but the NUS spectra use a factor of 8 less measurement time.
 Figure 3. 1 H/13C 2D Correlation Spectra of G-UDCA, with and without NUS.
The quantitative behavior of the NUS spectra is shown in Figures 4 and 5. In Figure 4, the relative volumes of peaks in the NUS spectra are compared to corresponding peak volumes from the fully sampled spectrum. As an additional reference, results are also included for the fully sampled data truncated to 512 increments and extended with Linear Prediction (LP), a common processing technique for conventional NMR data.18 As shown, the volumes of all spectra agree with the volumes from the fully-sampled spectra to better than 4%. This error is not due to NUS, but instead due primarily to small systematic distortions caused by factors such as inhomogeneity of the magnetic field. This is in keeping with the fact that agreement of volumes from the conventional LP spectrum (2.5% RMS) is comparable to the agreement of volumes from the NUS spectra (1.4% to 3.1% RMS). Figure 5 shows the reproducibility of peak positions between the NUS and fully sampled spectra. In all cases, 1 H positions agree to an RMS of 0.003ppm or better, and 13C positions agree to an RMS of 0.02ppm or better. This is comparable to expected errors when determining peak positions.
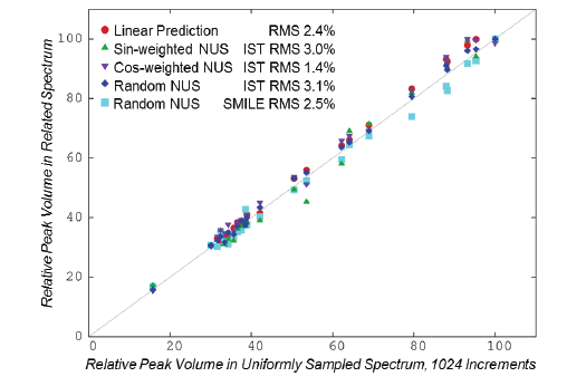 Figure 4. Reproducibility of Peak Volumes with and without NUS
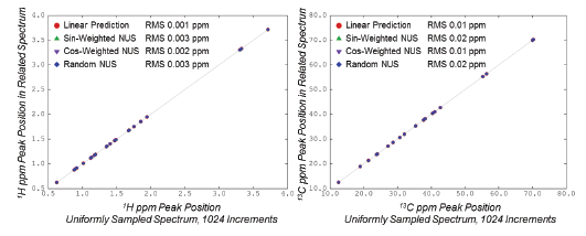 Figure 5. Reproducibility of Peak Positions with and without NUS
Comments and Conclusions
NUS sampling schedules are often characterized in terms of “sparsity”, meaning the ratio of the number of NUS points sampled compared to the number of points in the corresponding fully-sampled schedule. The G-UDCA NUS schedules have roughly 128 points, and the fully sampled schedule has 1024 points, for a sparsity of 12.5%. That said, the sparsity value is misleading on its own, misunderstanding about it has led to mistaken interpretations, and this in turn has hampered adoption of NUS. For example, a NUS schedule with 16 points out of 128 fully sampled points would also have a sparsity of 12.5%, even though it is in no way equivalent to a NUS schedule of 128 points out of 1024.
For 2D measurements, the situation is simple and common-sense: there should be more samples than peaks. The number of samples should be at least several times greater than the largest number of peaks expected in a band from the spectrum. This is true for any schedule, conventional or NUS. Forgetting this point has led some to erroneously imply that NUS at or below a certain sparsity will distort results.19 If the number of samples is too small compared to the number of signals, spectral quality will be poor, regardless of sparsity. In the G-UDCA example, the most crowded band in the spectrum, at 1 H = 1.34ppm, has roughly 8 peaks along the 13C dimension, so that the 128 point NUS schedules have roughly 16 times as many points.
Measuring fewer increments means less signal will be captured. While weighted sampling schemes might enhance signal to noise for decaying signals, as a conservative rule of thumb, expect that if the number of samples is reduced by a factor of N, the signal will be reduced by this factor too. In our example, the conventional spectrum with 128 increments has signals 3600 times larger than the random thermal noise in the spectrum. In this case, small systematic distortions commonly found in NMR spectra are much larger than the random noise, on the order of 1% to 5% of the largest peaks. So even if the ratio of signal to random noise were 10 times worse, it would have little practical impact on interpretation of the spectrum. This is why there was no strong influence of sampling scheme type on the G-UDCA results.
Our example shows that in small molecule applications which are not limited by signal to noise, and where the number of increments measured is sufficient for the expected number of signals, NUS can provide a substantial reduction of measurement time, and results are robust with respect to choice of sampling schedule and reconstruction method.
NUS can be employed on instruments from all major superconducting NMR vendors, and on benchtop NMR instruments as well. Tools for reconstructing NUS data are available in commercial NMR software, and the reconstruction methods for routine data are robust and don’t require manual parameter settings. NUS gives us the opportunity to set the number of increments independently of the desired resolution, to improve resolution with a given amount of measurement time or retain resolution with a shorter measurement time. In addition to these measurement benefits, the improved resolution that NUS can provide helps make spectral correlations beautifully obvious, and since spectra are usually interpreted visually, this can have a substantial impact on the ease of structure elucidation. When used appropriately, NUS can and should be a routine tool for pharmaceutical NMR.
Acknowledgements
JCH and FD acknowledge support of NIH P41 grant GM111135.
References
- Barna JCJ, Laue ED, Mayger MR, Skilling J, Worrall SJP. Exponential sampling, an alternative method for sampling in two-dimensional NMR experiments. J Magn Reson. 1987; 73: 69–77.
- Schmieder P, Stern AS, Wagner G, Hoch JC. Improved resolution in triple-resonance spectra by nonlinear sampling in the constant-time domain. J Biomol NMR. 1994; 4: 483–490.
- Hyberts SG, Arthanari H, Robson SA, Wagner G. Perspectives in magnetic resonance: NMR in the post-FFT era, J Magn Reson. 2014; 241: 60-73.
- Coggins BE, Zhou P. High resolution 4-D spectroscopy with sparse concentric shell sampling and FFT-CLEAN. J Biomol NMR. 2008; 42: 225–239.
- Hyberts SG, Takeuchi K, Wagner G. Poisson-gap sampling and forward maximum entropy reconstruction for enhancing the resolution and sensitivity of protein NMR data. J Am Chem Soc. 2010; 132: 2145-2147.
- Orekhov V, Jaravine VA. Analysis of non-uniformly sampled spectra with Multi-Dimensional Decomposition. Progress in Nuclear Magnetic Resonance Spectroscopy. 2011; 59: 271-292.
- Coggins BE, Werner-Allen JW, Yan A, Zhou P. Rapid Protein Global Fold Determination Using Ultrasparse Sampling, High-Dynamic Range Artifact Suppression, and Time-Shared NOESY. J Am Chem Soc. 2012; 134: 18619-18630.
- Kazimierczuk K, Orekhov V. A comparison of convex and non-convex compressed sensing applied to multidimensional NMR. J Magn Reson. 2012; 223: 1-10.
- Hyberts SG, Milbradt AG, Wagner AB, Arthanari H, Wagner G. Application of iterative soft thresholding for fast reconstruction of NMR data non-uniformly sampled with multidimensional Poisson Gap scheduling. J Biomol NMR. 2012; 52: 315-327.
- Hoch JC, Maciejewski MW, Mobli M, Schuyler AD, Stern AS. Nonuniform sampling and maximum entropy reconstruction in multidimensional NMR. Acc Chem Res. 2014; 47: 708-717.
- Stern AS, Hoch JC. A new approach to compressed sensing for NMR. Magn Reson Chem. 2015; 53: 908-912.
- Sun S, Gill M, Li Y, Huang M, Byrd RA. Efficient and generalized processing of multidimensional NUS NMR data: the NESTA algorithm and comparison of regularization terms. J Biomol NMR. 2015; 62: 105-117.
- Worley B, Powers R. Deterministic multidimensional nonuniform gap sampling. J. Magn. Res. 2015; 261: 19-26.
- Ying J, Delaglio F, Torchia DA, Bax A. Sparse multidimensional iterative lineshapeenhanced (SMILE) reconstruction of both non-uniformly sampled and conventional NMR data. J Biomol NMR. 2016; doi:10.1007/s10858-016-0072-7
- Kosiński K, Stanek J, Górka MJ, Żerko S, Koźmiński W. Reconstruction of non-uniformly sampled five-dimensional NMR spectra by signal separation algorithm. J Biomol NMR. 2017; doi:10.1007/s10858-017-0095-8
- Palmer MR, Suiter CL, Henry GE, Rovnyak J, Hoch JC, Polenova T, Rovnyak D. Sensitivity of Nonuniform Sampling NMR. J Phys Chem B. 2015; 119: 6502−6515.
- Delaglio F, Grzesiek S, Vuister GW, Zhu G, Pfeifer J, Bax A. NMRPipe: a multidimensional spectral processing system based on UNIX pipes. J Biomol NMR. 1995; 6: 277-293.
- Zhu G, Bax A. Improved linear prediction of damped NMR signals using modified “forwardbackward” linear prediction. J Magn Reson. 1992; 100: 202-207.
- Sidebottom PJ. A new approach to the optimisation of non-uniform sampling schedules for use in the rapid acquisition of 2D NMR spectra of small molecules. Magn Reson Chem. 2016; 54: 689–694.
Author Biographies
Frank Delaglio is a Principal Investigator for the National Institute of Standards and Technology (NIST) at the Institute for Bioscience and Biotechnology Research (IBBR), a joint research institute of NIST and the University of Maryland. Frank has over 25 years of experience developing computational methods for NMR structural biology, characterization of protein therapeutics, and pharmaceutical applications.
Gregory S. Walker is Associate Research Fellow at Pfizer Inc. with 30 years of experience in pharmaceutical science and drug metabolism, and over 50 external publications and presentations. Greg currently manages the Pfizer drug metabolism NMR facility, establishing NMR as a global analytical resource for the Pfizer drug metabolism division.
Kathleen Farley is a Principal Scientist in the R&D division at Pfizer Inc. with over 25 years of experience providing NMR support for medicinal chemistry research. Kathleen has two patents and over 30 publications. Her current research includes structural characterization of small molecules and peptides using residual dipolar coupling.
Raman Sharma is a Senior Scientist at Pfizer Inc. with over 15 years of experience in drug metabolism, with expertise in both Mass Spectrometry and NMR. Raman currently works in the biotransformation lab at Pfizer and has authored and co-authored over 40 peer reviewed publications in the field of drug metabolism.
Jeff Hoch is Professor of Molecular Biology and Biophysics at UConn Health, where he heads the National Center for Biolmolecular NMR Data Processing and Analysis. He is chair-elect of the 2018 Experimental NMR Conference and the 2017-2018 Joseph Meyerhoff Visiting Professor of Chemical Physics at the Weizmann Institute of Science.
Luke Arbogast is a research chemist for NIST IBBR. He received his Ph.D. in Chemistry from the Johns Hopkins University and served as a National Research Council postdoctoral fellow. His research focuses on the development NMR methods to characterize protein therapeutics.
Robert Brinson currently serves as a research chemist for NIST IBBR. His research interests include the development and application of high resolution NMR and other biophysical tools for the characterization of biomolecular structure at the interface of biopharmaceutical and regulatory sciences.
John P. Marino is leader of the NIST Biomolecular Structure and Function Group, and Associate Director of the IBBR. His research is focused on developing NMR and other biophysical methods to advance precision measurement of biomolecular structure and dynamics.