Polarization-resolved Raman spectroscopy has great potential as a means of process analytical technology in pharmaceutical applications. Recent progress has even enabled enantioselective measurements, which were previously believed to be impossible. The present article compares experimental approaches to polarization-resolved Raman spectroscopy and discusses them with regards to their pros and cons.
Background
Raman spectroscopy is an established analytical tool in the pharmaceutical sector. Beyond the analysis of products in the lab, Raman techniques find more and more applications as a means of process analytical technology (PAT). However, the full potential is currently, by far, not tapped. A key feature that is rarely exploited in routine Raman analysis is the sensitivity of Raman scattering to the polarization properties of the incident light. If the laser is linearly polarized, the majority of the Raman signal will be polarized in the same way. A certain fraction of the scattered light, however, will be polarized orthogonally with respect to the incident light. This fraction is referred to as the depolarized signal. The ratio of the depolarized and polarized signal components is the depolarization ratio ρ. Its value ranges from zero for highly polarized signals to 0.75 for the fully depolarized case.
The depolarization ratio allows deriving valuable information about the symmetry of a vibrational mode. Symmetric vibrations are usually highly polarized and anti-symmetric modes are depolarized. Consequently, acquiring both the polarized and the depolarized Raman spectrum permits an improved structural analysis and a more accurate assignment of the observed peaks. This is particularly true for overlapping vibrational bands. Another advantage of polarization-resolved detection is the determination of the isotropic and anisotropic Raman intensities. In the context of pharmaceutical analysis, however, the recent development of enantioselective Raman (esR) spectroscopy, which is based on polarization-resolved detection, is a promising tool.1,2
Experimental Approaches
There are several common experimental approaches to acquire polarization-resolved Raman spectra. Four general concepts are illustrated in Figure 1. The main components, i.e. a linearly polarized laser, a spectrograph and a camera (or a spectrometer with an integrated detector), and lenses for focusing and collimating radiation, are similar in all four. The simplest setup (Figure 1a) employs a polarization filter, either a thin film polarizer or a polarizing prism, in the signal collection path. To obtain the vertical or the horizontal signal component, the polarizer is oriented accordingly. This approach is experimentally simple, but it has two disadvantages, i.e. the two spectra must be recorded sequentially and a polarization scrambler is required to compensate for the polarization-dependent efficiency of the optical components in the spectrograph. Such a scrambler may also reduce the signal intensity and hence calls for longer acquisition times. A different experimental option is depicted in Figure 1b. In order to avoid polarization-dependent effects in the spectrograph, the polarization direction of the laser is adjusted using a halfwave plate. However, again, the two spectra must be recorded in sequence.
 Figure 1. Schematic experimental setups for polarization-resolved Raman spectroscopy. P = polarizer, L = lens, spec = spectrograph, Sc = polarization scrambler, λ/2 = half-wave plate, WP = Wollaston prism, PP = polarizing beam splitter.
For many process monitoring applications, however, temporal resolution is crucial. Therefore, recording the two spectra sequentially is not an option as the sample may have changed between the two measurements. Acquiring both the polarized and depolarized signal components simultaneously is possible using a polarizing beam splitter in the signal path and two spectrometers. This is illustrated in Figure 1d. Unfortunately, this approach is inherently expensive and requires significant alignment effort, and the detectors must be synchronized. A suitable alternative technique for acquiring both spectra at the same time has recently been demonstrated.3 The schematic setup is displayed in Figure 1c. The key components are the half-wave plate and the Wollaston prism. The half-wave plate is used to control the laser polarization such that it is rotated by 45°. This means that half of the intensity of the beam is vertically and the other half is horizontally polarized. The Wollaston prism splits the two polarization components into two individual beams, see enlarged detail in Figure 1c. The lens focusses the two beams to two spatially separated spots in the sample. The resulting Raman scattering from both spots is imaged onto the entrance slit of an imaging spectrograph equipped with a two-dimensional detector, e.g. a sensitive charge-coupled device camera. The camera eventually records both spectra simultaneously as they appear on separated parts on the chip. Basically, this concept makes use of the approach in Figure 1b, but enables the recording of the polarized and depolarized Raman signals at the same time. The disadvantage of the method is the spatial separation of the measurement volumes inside the sample. In other words, the sample must be homogenous on the length scale of this separation. This length scale can be less than a millimeter, depending on the optical alignment of the setup.
Comparison and Conclusion
All the experimental approaches described above have their pros and cons. As mentioned before, temporal resolution is a main criterion in process monitoring. Further important points are experimental simplicity and robustness as well as cost. The setups in Figures 1a and 1b are experimentally simple but they share the disadvantage of requiring sequential acquisition of the two spectra. Moreover, one component needs to be adjusted between the measurements. The rotation of polarizers and half-wave plates can be made automatic, but it still means a source of error. The setups in Figures 1c and 1d are more complicated, but they do not need to be touched and hence are more robust.
The costs of a setup for polarization-resolved Raman spectroscopy can vary significantly depending on the individual components. Only a few commercial Raman instruments are capable of recording both polarization components. Most devices on the market utilize fiber-optics, e.g. in immersion probes for process monitoring. The fibers usually do not maintain the polarization. Hence, custom-made solutions are needed. Considering simple and cheap options, the four setups can be compared with each other. They all contain a laser and a minimum of three lenses. Setup 1a in addition exhibits two polarizers, a scrambler and a spectrograph with detector. The cheapest option would be to replace the spectrograph, camera, and scrambler by a fiber-coupled miniature spectrometer with an integrated backilluminated detector. The fiber will act as polarization scrambler. Setup 1b contains a half-wave plate and two polarizers. The spectrograph and camera can again be replaced by a fiber-couple spectrometer. This is not possible in setup 1c, as the concept is based on the functionality of an imaging spectrograph and a two-dimensional detector. In addition, a Wollaston prism is necessary. Setup 1d, on the other hand, requires two spectrographs and detectors. Both can be implemented as fiber-coupled spectrometers.
The pros and cons of all four setups are compared in Table 1. The costs underlying the ratings have been estimated on the basis of current catalog prices. Setups 1a and 1b are almost identical in price, while the costs for setup 1d is almost the double amount as the spectrometers (incl. detector) represent the main cost drivers. The recently proposed setup 1c places itself in between and thus represents a true alternative, in particular when temporally resolved measurements are needed. In conclusion, polarization-resolved Raman spectroscopy is an emerging analytical technique and has great potential in the field of pharmaceuticals. The enantioselective Raman (esR) method is of particular interest in this context. The present article evaluated the current experimental possibilities for acquiring the polarized and depolarized Raman spectra. Four concepts were compared with respect to experimental simplicity, alignment effort, temporal and spatial resolution as well as cost. The recent development of an approach3 that allows the recording of both spectra simultaneously turns out to exhibit experimental as well as economic advantages. Thus, its further development towards a robust analytical tool will open up Raman spectroscopy for new applications in monitoring pharmaceutical processes.
Table 1. Pros and cons of the different setups.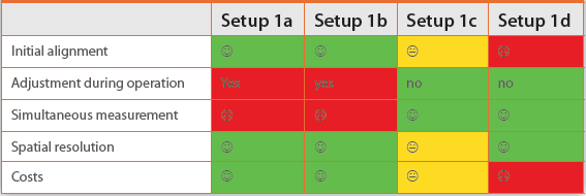
Acknowledgement
Part of this work was funded by the Deutsche Forschungsgemeinschaft (DFG) through grant KI1396/4-1.
References
- J. Kiefer, K. Noack, Universal enantiomeric discrimination by Raman spectroscopy, Analyst 140, 1787-1790 (2015).
- J. Kiefer, Enantioselective Raman Spectroscopy – A new tool for process monitoring in the pharmaceutical industry?, American Pharmaceutical Review 19, 52-54 (2016).
- J. Kiefer, Simultaneous acquisition of the polarized and depolarized Raman signal with a single detector, Analytical Chemistry 89, 5725-5728 (2017).
Author Biography
Prof. Dr. Johannes Kiefer is Chair Professor and Head of the division Technische Thermodynamik at the University of Bremen, Germany. In addition, he is an Honorary Professor at the University of Aberdeen, Scotland, and he holds a guest professorship of the Erlangen Graduate School in Advanced Optical Technologies (SAOT) at the University Erlangen-Nuremberg, Germany. His research interests are the areas of developing and applying spectroscopic techniques for the characterization of advanced materials and processes.