Complex generics are of significant commercial interest. Defined by the FDA as products having complexity associated with an active pharmaceutical ingredient(s) (API), formulation process, route of delivery, or drug-device combination,1 they are particularly challenging to replicate. This can mean limited commercial competition and considerable economic reward for those that receive approval for their Abbreviated New Drug Application (ANDA).
The provision of safe, cost-efficient treatments for conditions such as asthma and chronic obstructive pulmonary disease is a powerful global driver for generic orally inhaled product (OIP) development. However, OIPs are complex products, with drug delivery governed by the properties of the drug formulation, by the characteristics of the delivery device, and by how the two interact. Dispersion to a particle size of less than around five microns is required for penetration to the lung. This means that particle characterization techniques have an essential role to play in generic OIP development, in deformulation and for demonstrating bioequivalence (BE).
In this article, we examine three analytical techniques with a proven and complementary role in the development workflow for generic OIPs: laser diffraction, automated imaging and Morphologically Directed Raman Spectroscopy (MDRS). The speed of laser diffraction makes it uniquely suitable for examining the dynamics of dose dispersion, while automated imaging and MDRS provide particle size, shape and chemical identification data to track and fully elucidate the behavior of an API within a blend. Case study data for nebulizers and dry powder inhalers (DPIs) illustrates how these techniques can be combined to accelerate generic OIP development.
The Complexity of OIPs
A drug introduced into the body via a tablet is held in a stable matrix, in which both the dosage and the physical form/properties of the API are closely controlled. With an OIP, the situation is somewhat different since the formulation is in a dynamic state of dispersion. More specifically, the size of delivered API particles, which directly influences deposition and consequently bioavailability, depends on interactions between the formulation and device. To ensure comparable clinical efficacy, the particle size distribution of the delivered dose of a generic OIP must replicate that of the reference product. Successful development relies on understanding how interactions between the device and formulation influence dispersion, and of how to control these interactions to meet the target particle size specification, and ensure bioequivalence.
Each class of OIP achieves dose dispersion and delivery via a different mechanism. For example, with a nebulizer, the energy needed to aerosolize the liquid formulation comes from a compressed gas supply (jet nebulizers) or a power source (ultrasonic/mesh nebulizers). The impact of this energy on a specific formulation – the extent to which it can break the liquid up into discrete, respirable droplets – depends on physical properties of the formulation, such as viscosity. The resulting droplets are inhaled by the patient as they breathe normally, or tidally, through a mask. The amount of drug received is therefore impacted by the patient’s inhalation capacity and by treatment duration.
In contrast, dry powder inhalers (DPIs) are typically passive devices, with delivery of the API driven solely by the inhalation effort of the patient. During inhalation, air is drawn through a powder dose held within the device, dispersing it to a respirable size. The energy applied therefore depends on such variables as patient lung capacity, inhalation strength and device operating technique, as well as device design. The subsequent impact of this energy depends on formulation properties such as flowability and cohesion. This means that with a DPI, both the amount of drug delivered (how well the device empties) and the particle size of the delivered dose are influenced by the device, the formulation and the strength and effectiveness of the patient’s inhalation maneuver.
The correlation between particle size, regional deposition in vivo, and the likely success of drug delivery makes particle size data central to generic OIP development. However, the associated need to understand the dispersion mechanisms that govern product performance and determine delivered particle size call for additional particle characterization. Different techniques answer optimally to these demands.
Laser Diffraction: Rapid Particle Size Measurement For Dynamic Studies
Laser diffraction is a fast, highly automated, non-destructive particle sizing technique that can be applied to both wet and dry samples, including sprays. Particles passing through a collimated laser beam scatter light over a range of angles. Larger particles scatter at high intensity at relatively narrow angles to the incident beam, while smaller particles scatter at lower intensity at much wider angles. Laser diffraction analyzers detect the angular dependence of the resulting scattered light pattern and calculate the size of particles that produced it via application of an appropriate theory of light behavior, typically the Mie theory.
In OIP studies, laser diffraction is particularly useful for studying the dynamics of dose dispersion because it offers:
- Rapid measurement – data acquisition rates are sufficiently high (up to 10 kHz) to monitor the changing size of droplets or particles in an aerosol cloud, in real-time, during the course of a spray event
- A broad measurement range – both coarse and fine particles can be measured simultaneously to track the delivery and progressive break up of larger droplets and/or agglomerated material
Laser diffraction is also an extremely efficient technique for routine, comparative particle sizing, for BE studies for example. The following case studies illustrate the application of laser diffraction to investigate nebulizer and DPI performance.
Case Study 1: Investigating the Impact of Driving Gas Flow Rate on Delivered Particle Size
With a jet nebulizer, the flow rate of the compressed gas supply, typically air, directly impacts the energy available for aerosolization of the formulation, and consequently the particle size of the delivered dose. Figure 1 shows measured particle size as a function of driving gas flow rate for a jet nebulizer; driving gas flow rate varied from 5 to 13 L/min, and particle size data were measured using a Spraytec laser diffraction particle size analyzer.
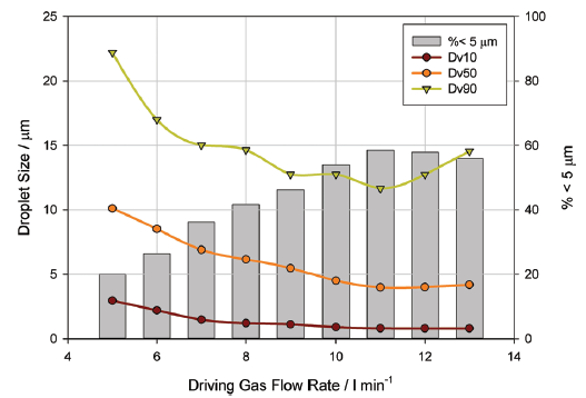 Figure 1. Showing measured particle size as a function of driving gas flow rate for a jet nebulizer
As driving gas flow rate is increased from 5 L/min to 11 L/min, particle size as defined by Dv10, Dv50 and Dv90, reduces, where Dv10, Dv50 and Dv90 is the particle size below which 10%, 50% and 90% respectively of the particle population lies on the basis of volume. The respirable fraction, defined as the fraction of the dose below 5 microns in size, increases. This expected trend is attributable to more effective liquid break-up as energy input rises.
However, at flow rates in excess of 11 L/min, Dv50 and Dv90 begins to increase, and there is a slight reduction in the sub-5 µm fraction. At this point, the flow rate through the device has become so high that larger droplets are being forced through the baffle/orifice designed to prevent their delivery. Clearly, this type of analysis efficiently identifies optimal and suboptimal operating conditions for the nebulizer.
Case Study 2: Using Laser Diffraction to Investigate Drug Delivery Characteristics
Minimizing the forces between API particles in the sub-5 µm range is essential for the development of carrier-free formulations, and reducing the contact area between particle surfaces is one way to achieve this. The presence of leucine on drug particles has been shown to aid aerolization6,7 and recent studies have shown the ability of a L-leucine crystals to enhance the flow and dispersion behavior of API particles,8 and Figure 2 shows the results of experiments carried out using three samples of salbutamol sulphate, coated with different proportions of L-leucine crystals, via physical vapor deposition in an aerosol flow reactor.2 A micronized salbutamol sulphate was also characterized for comparison.
 Figure 2. Each of the coated samples shows good, reproducible dispersion to a respirable size at each flow rate
The aerosolization properties of both coated and uncoated samples were evaluated using a laser diffraction system. Tests were carried out at 30 L/min, 60 L/min and 90 L/min for each formulation, using a passive inhaler device. The data show good, reproducible dispersion to a respirable size at each flow rate for each of the three coated samples (Figure 2), with the proportion of the emitted dose in the sub-10 µm range varying from 78%-93%. The percentage of fine particles produced reaches its maximum at 60 L/min for all three samples, with less efficient dispersion occurring at 90 L/min. As shown on the chart, the performance of the MSS sample increases steadily as flow rate increases.
The three coated samples exhibited rapid entrainment, giving a high initial particle concentration likely to be of greatest benefit in API delivery to the lungs. As Figure 3 shows, MSS gives an initial peak before displaying a steady delivery with low concentration. The coated samples demonstrated good dispersion behavior, independent of flow rate across the range tested. In contrast, MSS, the uncoated reference, displayed poor dispersion characteristics, in terms of slow entrainment and flow-rate-dependent emitted dose. These results suggest that coating the API with L-leucine may have improved the dispersion of carrier-free formulations from passive DPIs by modifying particle properties. Coating reduces the energy required for dispersion, increasing fine particle levels and improving reproducibility. Although all coated formulations demonstrated a degree of agglomerate dispersion, the properties of high L-leucine samples appear to offer notable advantages for drug delivery.
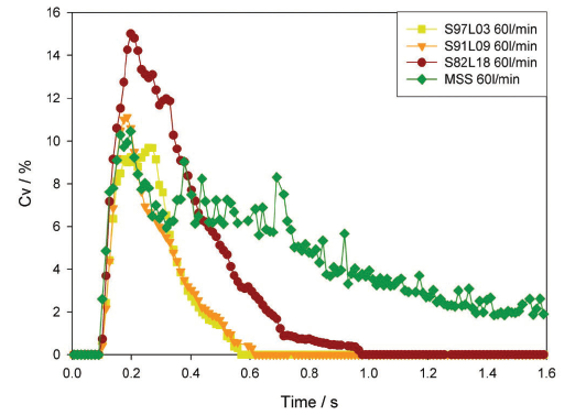 Figure 3. Concentration profiles (recorded at a flow rate of 60 L/ min) for the samples highlight differences in entrainment behavior
Automated Imaging: Objective Size and Shape Measurement Quantifies Dispersion
Over the last decade, automated imaging has progressively displaced microscopy in a range of pharmaceutical applications that require the assessment of particle morphology – principally particle size and shape. Automated imaging systems capture images of tens of thousands of individual particles in just a few minutes. These images are then used to generate statistically significant, number-based distributions of a wide range of particle size and shape metrics that can be used to differentiate particles that are: spherical and nonspherical; rough or smooth; opaque or transparent; agglomerated or dispersed (see Figure 4). Compared with manual microscopy methods, automated imaging is significantly faster and less subjective.
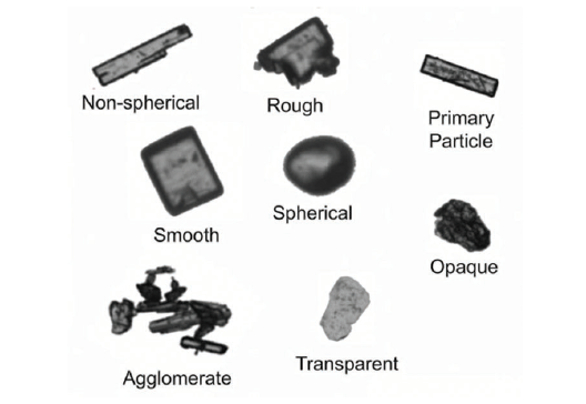 Figure 4. Automated imaging can be used to differentiate particles that are opaque or transparent, agglomerated or dispersed, smooth or rough, spherical or non-spherical
For OIP studies, it is the ability of automated imaging to quantify the state of dispersion of a formulation, and/or a suspended API within it, that is particularly valuable, as the following case study demonstrates.
MDRS: Focusing on the API Using Component-Specific Particle Characterization
The API is typically the chief focus of deformulation studies and certain aspects of BE testing. Laser diffraction measures particle size data for the formulation in its entirety, while automated imaging provides data for individual particles which can often be assigned as either API or excipient on the basis of size or shape. However, certain applications call for the secure differentiation of API from particles that are morphologically similar. This requires robust chemical identification.
Morphologically-Directed Raman Spectroscopy (MDRS) combines the morphological characterization delivered by automated imaging with Raman spectroscopy for chemical identification. Raman is widely used for compositional analysis within the pharmaceutical industry and is applicable for the identification of most APIs and excipients. Applying a preliminary morphological screen to a sample makes it possible to focus Raman on just those particles of interest, because of their size, shape or both, thereby accelerating overall measurement times and improving specificity. The following case studies show how MDRS can be used to investigate the dispersion behavior of a DPI and also as a deformulation tool.
Case Study 3: Investigating the Amount and Form of the APIs in Dual Active DPI
To illustrate the potential of MDRS in deformulation studies, consider the example of a DPI containing two APIs – both of which are delivered in the respirable size range. Key information required to replicate the performance of such a product is the amount and particle size distribution of each active, in the respirable dose. MDRS can deliver this information via a simple workflow involving: dispersion of the dose, collection of particle images, collection of Raman spectra for individual particles, and assignment of particles as either API(1) or API(2) by comparison of the gathered data with reference spectra. Once this workflow is complete, it is straightforward to determine a component-specific particle size distribution for each API, and measure their relative amounts within the formulation.
Figure 5 shows the correlated spectral scores for each API, highlighting particle populations that can be securely assigned as API(1) or API(2). The color density on this plot relates to the number of particles of each API that were detected, so even at this stage of the measurement, it is becoming evident that there is significantly more API(2) in the formulation than there is API(1). It is also interesting to note that some of the particles have mixed correlation scores. This suggests they may have been delivered in an undispersed state, possibly in the form of agglomerates consisting of both APIs.
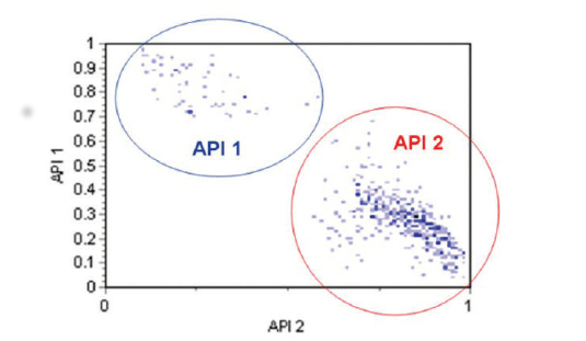 Figure 5. The correlated spectral scores for each API, highlighting particle populations that can be securely assigned as API(1) or API(2)
Using the chemical identification data as a filter, it is possible to generate a particle size distribution for each API (see Figure 6). These results indicate that both APIs have a similar particle size and shape, and are present in the formulation as micronized particles with a particle size distribution that peaks between 2 and 3 microns. Looking at the number of particles assigned to API(1) or API(2) makes it possible to determine a relative percentage of each API in the formulation (see Figure 7). In this case, around 90% of the particles present are API (2) and around 10% are API (1).
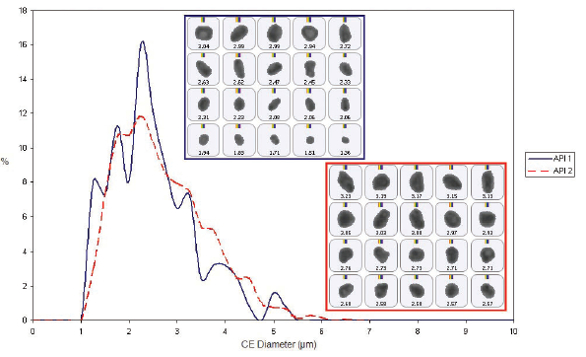 Figure 6. Once particles have been identified as either API(1) or API(2), it is possible to generate component-specific particle size distributions for each API within the formulation
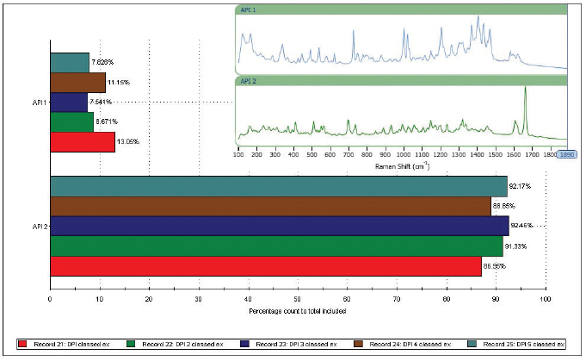 Figure 7. Based on the number of particles assigned as API (1) or API (2), it is possible to determine the proportion of each active within the formulation
Some variability is evident between replicates (measurements were made for five aliquots of the sample), but the analysis is sufficiently reproducible to support a generic drug development program.
Case Study 4: Using Automated Imaging to Compare Particle Agglomeration
Particle shape data, obtained by automated imaging techniques, is highly beneficial for differentiating agglomerates from primary particles. It’s for this reason that the technique is often used when developing nebulizer formulations, particularly as it can help demonstrate BE in line with FDA guidance.
An experimental study used automated imaging to examine the particle size and state of agglomeration in samples of innovator (reference) and generic (test) budesonide nebulizer formulations, before and after the application of ultrasound. Applying ultrasound reduced the overall particle size of the reference formulation. Images showed that the larger particles assumed to be agglomerated material in the original formulation were not present in the samples after ultrasound was applied (see Figure 8).
 Figure 8. Particle size distribution data for the reference formulation indicates the presence of agglomerates, which are dispersed by application of ultrasound
In contrast, ultrasound had little effect on the particle size of the test formulation, which showed no evidence of agglomerates or agglomerate dispersion (see Figure 9).
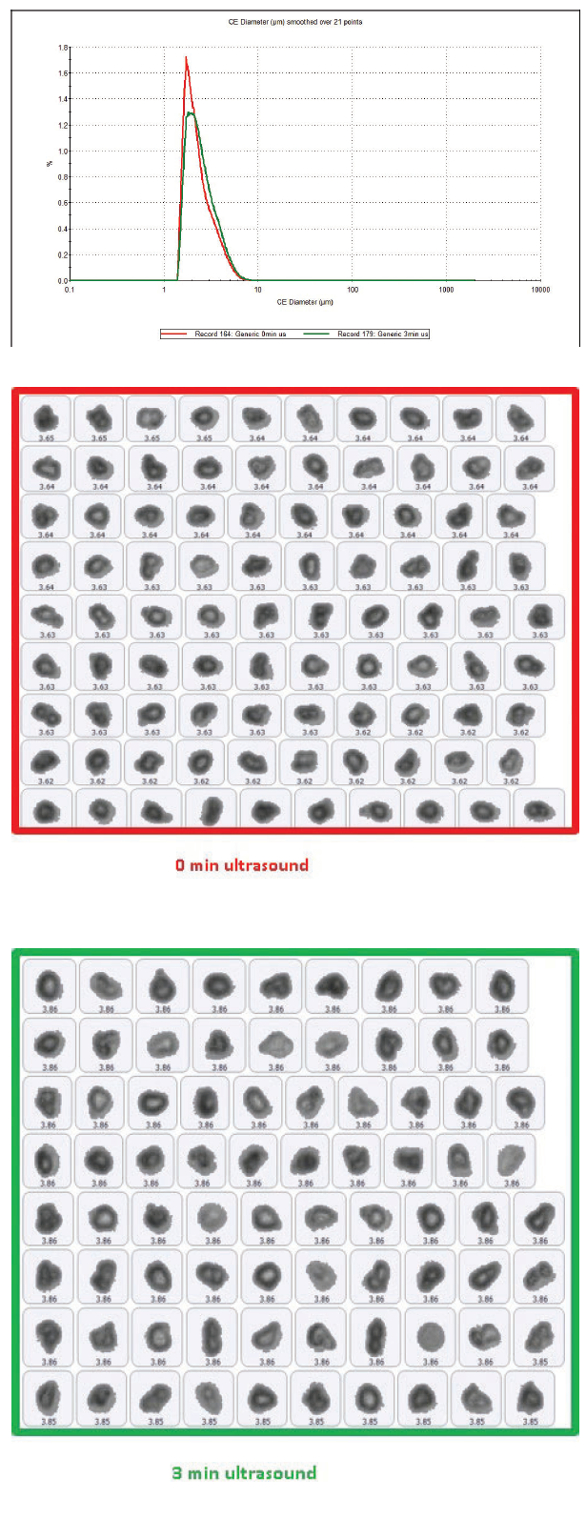 Figure 9. Particle size data for the test formulation shows that particle size is relatively unaffected by ultrasound
It’s clear that the two formulations have different properties, with the comparison suggesting that the innovator may be less stable than the generic, as it forms loose agglomerates that are easily dispersed. However, the dispersed particle size in both formulations is quite similar. The results of this study successfully highlight automated imaging as an effective tool for detecting agglomerated particles and how it could be used to assess the ease of dispersion, which is key to supporting claims of BE.
Conclusion
Effective particle characterization is essential for generic OIP development. The size of particles delivered to the patient by an OIP directly impacts in vivo deposition behavior and consequently clinical efficacy. Demonstrating that the particle size distribution of a test product matches that of the reference is therefore a critical aspect of BE testing. However, OIPs are complex products with delivered particle size a function of the characteristics of the device, the properties of the formulation and, in some instances, the strength and inhalation technique of the patient too. Learning how to control particle size to meet a target specification therefore calls for techniques that provide insight into the dispersion mechanisms that govern product performance. Laser diffraction, automated imaging and MDRS, in combination, directly answer to key regulatory requirements for in vitro BE testing and can be used to accelerate deformulation and extend product understanding to drive highly efficient generic development.
References:
- R. Lionberger “Developing new bioequivalence approaches for complex products”. Presentation delivered at GPhA Fall Technical Meeting. Oct 29 2014.
- Kamlag, Y., Kippax, P. and Morton, D.A.V., (2006). “Uncovering the secrets of a dry powder inhaler plume.” Proceedings of Aerosol Society Drug Delivery to the Lungs 17, Edinburgh, UK.
- FDA draft guidance on Budesonide. Sept 2012. Available to download at: https://www.fda. gov/downloads/Drugs/.../Guidances/UCM319977.pdf
- FDA draft guidance on Indacaterol Maleate. Apr 2016. Available to download at: https:// www.fda.gov/downloads/Drugs/GuidanceComplianceRegulatoryInformation/Guidances/ UCM495054.pdf
- FDA draft guidance on Umeclidinium Bromide. Oct 2016. Available to download at: https:// www.fda.gov/downloads/Drugs/GuidanceComplianceRegulatoryInformation/Guidances/ UCM520285.pdf
- Staniforth, J. N., (1997). “Improvements in and relating to powders for use in dry powder inhalers.” International Patent Application WO1997/03649
- Rabbani, N. R. and Seville, P. (2005). “The influence of formulation components on the aerosolisation properties of spray-dried powders.” J. Controlled Release, Vol. 110, No. 1, pp 130-140
- Raula, J., Lähde, A., Kauppinen, E.I., 2009. ”Aerosolization behavior of carrier-free L-Leucine coated salbutamol sulphate powders.”Int. J. Pharm., 365, 18–25.