Introduction
The term “biosimilars,” which is widely used in the biopharmaceutical industry, refers to a generic version of a therapeutic protein. Biosimilars are recombinant proteins produced by genetically modified cells and are made to be a copy of the original biotherapeutic reference product or “innovator” and to share quality attributes with the innovator. Unlike small molecule drugs, biotherapeutics are larger and more complex molecules, which are produced by living cells. The selection of the cell type used in the manufacturing process is primarily driven by consideration of post translational modifications (PTMs) that occur to the protein, with glycosylation being the most common and important PTM.1 Since prokaryotes cells are unable to provide the appropriate glycosylation for their therapeutic effect, animal cells have been the predominant platform of manufacture. The most widely used is the Chinese hamster ovary (CHO), and others include baby hamster kidney (BHK), mouse myeloma (NS0) and hybridoma (SP2-0).2
The production of biosimilars requires a series of steps that range from transfection of the heterologous gene into a cell line to optimization of the culture conditions (E.G. dissolved O2, dissolved CO2 , temperature, pH, availability of nutrients, etc.).3-5 All of these aspects play a role in the quality of the product, since variations in these conditions can lead to differences in the glycan profile. In the manufacturing process, even the selection of the same cell line as the innovator does not guarantee the same PTMs in the final product because of the heterogeneity of the transfection process and clone selection.6
The establishment of a production cell line begins with the insertion of the heterologous gene into the host cell chromosome and gene amplification followed by clone selection. In this process, there are two commonly used selection strategies applying nutritional auxotrophs. The use of a dihydrofolate reductase mutant allows for screening and amplification of the heterologous gene using methotrexate.7 The second strategy requires the use of glutamine synthetase mutant with methionine sulfoximine as an amplification factor.8 Other important aspects in the clone selection are the growth rate, viability, productivity, and stability,9 since these play an important role in the feasibility and economics of the process.
Because of the necessity of high production rates, most commercial biotherapeutic cell cultures are carried out by fed batch or perfusion bioreactors.10 Fed batch cultures are a robust process with lower failure rates, while perfusion cultures present a higher productivity but utilize smaller bioreactors, increasing the complexity of the process.11 Traditionally, large scale processes have utilized stainless steel stirred tank bioreactors,12 but recent improvements in the single-use systems have made this technology a viable alternative, lowering capital cost and enabling more flexibility in facilities.13-15 As biosimilar manufacturing expands across the market, the predominant technical challenge remains in replicating the glycan profile of the innovator molecule.
Two years after the passage of the Biologics Price and Competition and Innovation Act (BPCIA) in 2010, which created a regulatory pathway for biosimilar approval, the FDA issued a draft document for developing and registering a biosimilar. In 2015, Zaraxio, manufactured by Sandoz as a biosimilar to Neupogen (filgrastim), became the first biosimilar to hit the US market. Only recently (November 2017) has the second biosimilar, Pfizer’s Inflectra biosimilar of Roche’s Remicade (inifliximab) been launched on the US market. A number of others have been approved by the FDA, including Renflexis (infliximab by Merck and Samsung Bioepis), Amjevita (adalimumab by Amgen), Erelzi (Etanercept by Sandoz) and Mvasi (Avastin jointly by Amgen and Allergan). Getting them launched on the US market is a longer path because of post-patent litigation. The process in Europe appears to be more efficient in that the European Medicines Agency has approved over 30 biosimilars in Europe, and 26 are already on the market. Profit and economic savings appear to drive the biosimilar market, which is projected to reach $22 billion in 2022 and save US healthcare approximately $50 billion.16
Biosimilars range in size from smaller proteins such as filgrastim (Approximately 20 kDa) to monoclonal antibodies (approximately 150 kDa), and complex chimeric or fusion proteins (some >300 kDa) that can be heavily glycosylated. These structures can be further complicated by PEGylated to keep the protein in the bloodstream or by linking a toxic cancer drug such as is the case with antibody drug conjugates (ADC). For example, AbbVie’s Humira or adalimumab, whose patent expired in 2016, has been a prime candidate for becoming a biosimilar with approximately 20 companies around the world attempting to get it approved as a biosimilar. Adalimumab is an IgG1 monoclonal antibody (mAb) with a molecular weight of approximately 150 kDa and has 16 disulfide bonds and multiple glycoforms. It is produced by CHO cells and can have multiple modifications that can alter its shape and efficacy.
Because of the size and complexity of biosimilars, proving them exactly identical to the innovator is impossible. However, it is necessary, to conduct analytical studies to demonstrate that structural and functional characteristics are similar. Also, prior to getting the innovator licensed in the US under section 351(a) of the Public Health Service Act, clinical studies must be conducted in humans. These studies must show the biosimilar is comparable to the innovator in structure, quality, efficacy, and safety with immunogenicity a prime consideration. An Indian fable describes the scene where five blind men are asked to provide the characteristics of an elephant. After each explores a different region of the elephant and when they come together to confer on their findings, an argument ensues as to the true nature of the elephant. So it is with the characterization of large protein or biosimilar. The characterization of protein– protein interactions and PTMs still remains challenging. A single monoclonal antibody such as adalimumab (IgG1) could contain several PTMs on internal and terminal amino acids and nearly 40 different glycosylations on both heavy chains, resulting in a multitude of isoforms. In the following sections, the analytical testing that is predominantly used to provide primary structural characterization of a biosimilar is discussed and current analytical technology is reviewed.
Analysis of Primary Structure
Mass Spectrometry
Currently, mass spectrometry is the most widely used technique in characterizing the primary structure of proteins. Intact mass analysis provides important information that can verify the amino acid sequence using the observed mass of the protein and can provide the identity and relative abundance of any resolved isoforms of the protein. An example deconvoluted spectrum of the IgG1 monoclonal antibody adalimumab is shown in Figure 1. The highly charged electrospray spectrum is shown in the inset. This spectrum was generated using a time of flight mass spectrometer (TOFMS) with a resolution of approximately 15,000. Either reversed-phase or size exclusion chromatography is used to isolate the protein from salts and surfactants that may be in the formulation and to introduce the protein into the mass spectrometer. During mass analysis, biosimilars such as monoclonal antibodies may be reduced to separate the light and heavy chain and or digested with an enzyme such as Ides that cuts the heavy chain below the hinge region for most IgG1 mAbs. Introduction of the smaller subunits or domains that can provide more spectral detail, is less complex to interpret and can provide in depth analysis of glycans.17
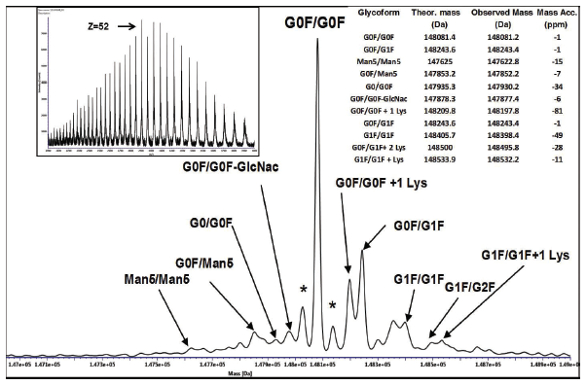 Figure 1. Example electrospray spectrum (inset) and deconvoluted (MaxEnt) mass spectrum of adalimumab showing glycoforms
A current area of interest is the mass analysis of proteins in their native state. Usually SEC is used to separate the protein in a buffer such as sodium acetate at a pH in the range of 6-7 without solvents and at controlled ionic strength. As a result, the protein is unfolded and not denatured, resulting in an electrospray spectra with less charge (higher m/z). Non-covalently bound proteins can remain intact, which can provide information about ligand binding characteristics and detect complexed metals in the protein.18
Peptide Mapping
Peptide mapping is a bottom-up technique that is performed after an endoproteinase digestion to cut the protein into peptides. The key to determining the structural integrity of biosimilars is to provide complete peptide coverage of the expected amino acids. Issues such as the correct order or sequence variants can be readily identified before any further product development efforts are started. In mAbs the sequence of the CDR (complementarity-determining region) portions are particularly critical since they are tailored to specific antigens. Post-translational modifications (PTM) such as oxidation, deamidation, N-terminal pyroglutamate formation and glycosylation can also be ascertained. The predicted disulfide bridges (DSB) and their scrambled, misaligned forms can be identified. Site-specific information about a biosimilar can highlight areas most susceptible to modification.
Initially in peptide sequencing of a biosimilar, an in silico digestion is a performed19-21 to decide what enzyme(s) to use for digestion and to determine the charge states (m/z) of the predicted monoisotopic masses of the peptides for data mining. This information aids in determining expected disulfide bridges, conjugated peptides and those scrambled or misaligned crosslinked. Anticipated PTMs can be built-in as part of the process. Missed cleavage of peptides by digestion enzymes can be included as a variable. This may be a concern if a protein has many prolines or is heavily phosphorylated.22-24
Sample preparation can be done in solution or on centrifugal filter units using filter aided sample preparation, FASP.25 The protein is denatured followed by reduction, alkylation, and then digestion with endoproteinases such as Lys-C or trypsin.26,27 After the peptides are separated using reversedphase chromatography on a C18 column and electrospray ionization has occurred, collision induced dissociation (CID) is most often used to generate MS2 spectra of the peptides. Other forms of fragmentation, such as high- energy collision dissociation (HCD) or electron transfer dissociation (ETD), can be used in conjunction with data dependent acquisition (DDA) to provide more spectral information about the peptide or PTMs in the protein. Accurate mass measurement of the peptide from the MS parent ions and the fragmentation pattern of the daughter ion spectra allow for confident identification of peptides. Data analysis can be done with a suite of software. Two of the more common search engines are SEQUEST28 and Mascot.29 Either of these are the core for many commercially available data interpretation packages. Figure 2 shows data that was acquired using DDA on an oxidized peptide in adalimumab.
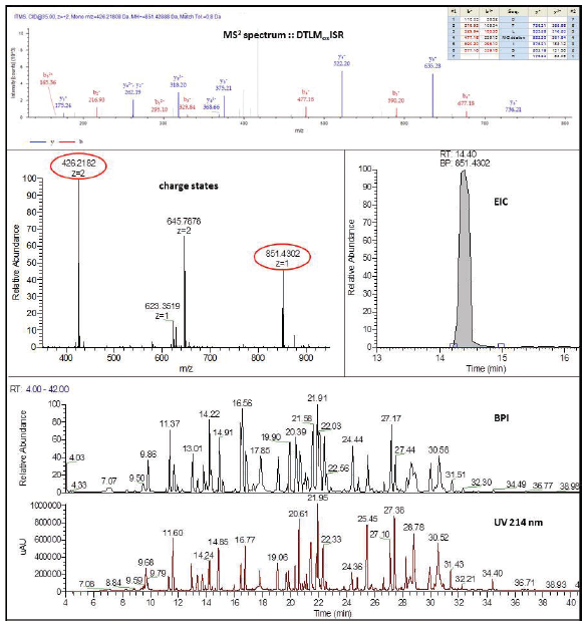 Figure 2. Data dependent acquisition of adalimumab peptide - Top) MS2 spectrum of peptide (DTLMoxISR) showing y and b ions and site of oxidation; Middle) MS spectra and extracted ion profile of molecular ion; Bottom) Base peak and UV chromatograms
Glycan Analysis
Protein glycosylation is a ubiquitous posttranslational modification that directly affects protein function. The presence of glycans can modify the structure (protein folding or accessibility to enzymes) or function directly (in vivo stability or biological recognition). It is estimated that more than 50% of human proteins are glycosylated30 and an overwhelming majority (> 90%) of approved biosimilars are glycosylated. Glycosylation is considered a Critical Quality Attribute (CQA) by regulatory agencies; therefore, it has to be monitored closely during manufacturing steps and stability studies.31 Since the glycan composition affects the immunogenicity of drug products as well, this introduces another level of scrutiny in assessing innovator drug and biosimilar comparability. Detecting differences in glycosylation between innovator and follow-on biologics became increasingly important in the last decade simultaneously with the development of analytical techniques and more established regulatory guidelines.
Unfortunately, complete glycosylation control during manufacturing is not possible to achieve and there are no template methods to analyze protein glycosylation. It is estimated that about 75% and 20% of glycan analyses are completed using released glycans and glycopeptides, respectively, while the remaining 5-6% relies on analyzing intact proteins or intact protein fragments. While released glycan analysis is favored because of speed and high-throughput, it does not provide information related to the location of the glycosylation (glycosylation sites). Nonetheless, released glycan analysis remains the first choice for characterizing antibody biosimilars due to the uniformity of the location of glycosylation (Ca. Asn 297) on each heavy chain of IgG1 antibodies). The growing number of ADCs produced at increasingly higher molecular masses may also be better candidates for free glycan assays despite the rapid evolution of high resolution accurate mass (HRAM) mass spectrometers that facilitate glycosylation analysis at the intact protein level. Since the majority of biosimilars (approved or under development) contain N-glycosylation, the remaining discussion will focus on reviewing current trends in N-glycan analysis.
A normal workflow for free glycan analysis consists of these steps: release of glycans from glycoproteins, clean-up of released glycans, labeling of free glycans, clean-up of labeled glycans and separation and/or detection. N-glycans can be released from glycoproteins chemically by hydrazinolysis and enzymatically using an endoglycosidase such as PNGase-F. PNGase-F is by far the most used agent in glycoprofiling of total N-glycans of therapeutic glycoproteins that have been expressed in mammalian or bacterial cells. It can be added directly to the native or denatured glycoprotein or used in an immobilized column format32-33 or to the captured antibody on a Protein A spin column.34 Newly developed rapid recombinant variants of PNGase F cut the deglycosylation time from several hours down to several minutes35 and can be used in a solution or solid support format as well. If necessary, the released glycans can be segregated using size exclusion cleanup, molecular weight cut-off filters, or precipitating the glycosylated protein by organic solvents.
Since N-linked glycans do not possess any chromophore, they are not detectable by usual optical instrumentations (UV or fluorescence detectors). Instead, the chromophore group is added by a chemical reaction. The most popular labeling techniques apply fluorescence tagging since they offer much lower detection limits at picomolar concentrations versus micromolar (UV). Fluorescence labeling can be carried out using either the reducing end of glycans through reductive amination with labelling agents such as (2-AB (2-aminobenzamide), 2-AA (2-aminobenzoic acid), and 2-AP (2-aminopyridine) or procainamide)) or through an activated carbamate reaction involving the active glycosylamine end of freshly released glycans using labels such as InstantAB, InstantPC, or Rapifluor-MS. As the name suggests, these instant labeling agents work rapidly (less than 5 minutes) but only can be used for freshly released glycans because the amino groups on the N-acetylglycosamines will convert to a hydroxyl group. After an hour, released glycans can only be labeled using reductive amination that requires longer (2-4 hrs) of labeling time. Both types of labeling yield over 90-95% labeling efficiency. As for fluorescence efficiency, the highest signals can be achieved using InstantPC, Procainamide and Rapifluor-MS (in order as listed).
Excess labeling reagents that may obscure the elution of glycans can be removed by solid phase extraction (SPE). This cleanup can be carried out in 96-well plates, individual cartridges, or on a spin column. Established SPE techniques include HILIC SPE, spin columns, reversed phase SPE, porous graphitic carbon (PGC) SPE, or normal phase SPE.
While many labeling reagents offer excellent sensitivity for fluorescence, some exhibit poor mass spectrometric response. If mass spectrometry is required, fluorescence labels that have an additional functional group that is easily ionized, such a tertiary amine, can be used. Responsive labels include InstantPC, Rapifluor-MS and Procainamide. Characterization projects in which unknown or complex glycans are on the protein often employ simultaneous use of fluorescence and mass spectrometric detection. After the glycan profile is established, fluorescence-only methods can be used for rapid QC testing.
Some glycan samples from therapeutic proteins may contain over 40-60 different glycans; therefore, UPLC or capillary electrophoresis is used to achieve adequate separation. HILIC is the best suited to separate labeled glycans; reversed-phase chromatography is a close second choice. A typical HILIC separation of glycans is shown on Figure 3. Mass spectrometry aided identification since glycans that have the same number of monosaccharide units may elute closely or as the example shows, under the same peak.
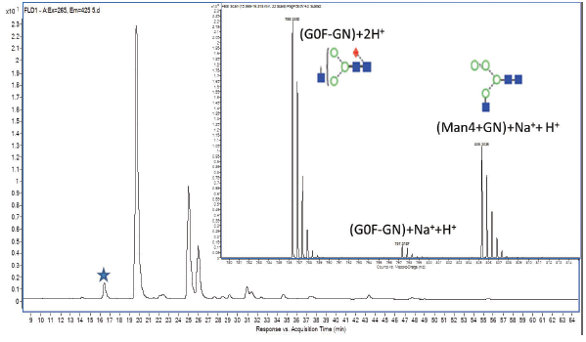 Figure 3. DExample fluorescence spectrum of glycans of the NIST mAb Monoclonal Reference Material labeled with Rapifluor-MS. Mass spectra of a glycan peak labeled with asterisk is shown on the insert.
Chromatographic Techniques Used for Biosimilars
Various chromatographic techniques are used in the characterization of biosimilar proteins and these are highlighted and discussed below. Ultra-high performance liquid chromatography (UPLC) is the preferred technique over HPLC because as the name entails, the performance of UPLC greatly supersedes that of regular HPLC. UPLC systems can operate at very high pressures (up to 20,000 psi) enabling the use of small bore (below 2 mm) and small particle-size columns (below 2 µm) resulting in better resolution, shorter run times, and increased sensitivity.
Reversed-phase chromatography (RPC)
Reversed-phase chromatography (RPC) is used for protein identification, impurity profiling, intact and subunit mass measurements, and peptide map analyses.36 It also can be used to separate labeled released glycans, where the elution order is the opposite of the elution order obtained in HILIC separation. Reversed-phase chromatography offers an orthogonal separation to HILIC in glycan analyses.
The stationary phases in RPC are hydrophobic, and analytes are retained in the order of increasing hydrophobicity (decreasing polarity). A gradient of increasing ratio of organic solvents is applied with column temperature above ambient. Unfortunately, these conditions denature intact proteins while they travel through the column. During the denaturing process, proteins become unfolded (i.e. internal hydrophobic residues become exposed and increasingly interact with the stationary phase). This can lead to peak broadening or in severe cases, partial or total loss of a protein.
Nonetheless, RPC is the most widely used separation for proteins, peptides and nucleic acids. The use of volatile mobile phases enables coupling to mass spectrometry.
Reversed-phase columns are available in very different pore sizes (130 Å to 1000 Å) and cover the application range from peptides up to very large proteins (> 1 million Da).
Hydrophobic interaction chromatography
Hydrophobic interaction chromatography (HIC) is similar to RPC in that that retention of a protein of interest reflects its overall hydrophobicity. The stationary phases used for HIC generally feature low-density and moderately hydrophobic ligands (propyl and phenyl), and normally a decreasing salt (sulfate, phosphate, or citrate) gradient is applied in the presence of some organic content. Salts are not compatible with mass spectrometry, but newer stationary phases, like polypentyl to polydecyl, provide excellent separation even when used with ammonium acetate, making the method applicable to mass spectrometric detection.37
Hydrophobic interaction chromatography has some major differences when compared to RP-HPLC separation. Retention to the HIC column is solely due to the interaction between amino acid residues located on the surface of the protein and the column matrix. As a consequence, differences in retention times of the same molecule may reflect conformational changes or a PTM. Hydrophobic interaction chromatography is very useful for monitoring methionine or tryptophan oxidation, asparagine isomerization, and serine phosphorylation. Unlike RPC, HIC is a non-destructive analytical method and can be used for top down analyses coupled with mass spectrometry. Hydrophobic interaction chromatography is a powerful analytical technique for the analysis of antibody-drug conjugates and is routinely used to determine the drug to antibody ratio.38
Ion-exchange chromatography
Ion-exchange (IEX) chromatography is used to analyze charge variants and based on charged groups being permanently attached to the surface of the column packing. These charged groups become associated with counter ions provided by the buffer or salt in the mobile phase and are of opposite charge. Sample ions compete with counter ions for access to the ion exchange sites. Retention time is the result of ionic interaction between the sample ion and the ion exchange resin. Ions that have less affinity towards the ion-exchange resin will elute first, and ions that have more affinity will elute later. Ion exchange chromatography can be divided into two categories: cationic and anionic exchange chromatography. Cationic exchangers possess negatively charged groups, and these will attract positively charged analytes; while anionic exchangers have positively-charged groups, which will attract negatively charged molecules. Most protein chromatography (CEX) is done using cation exchange chromatography.
Ion exchange chromatography has a wide range of applications in analyzing charge variants of proteins. Since a single amino acid change or a lack of a single amino acid, can alter the isoelectric point (pI) of the whole protein, this method is very sensitive in detecting differences in the primary structure. Truncations, post-translational modifications that alter the overall charge of the protein (for example C-terminal Lys clipping,39 isoaspartate formation40 or deamidation of asparagine or glutamine residues41 can successfully be detected and quantified by IEX-HPLC.
Size-exclusion chromatography
Size-exclusion chromatography (SEC) is used to analyze proteins of different sizes, most notably, aggregates, subunits, and fragments of proteins. The applicable molecular weight range of a size exclusion column is determined by the pore size of the stationary phase. Size exclusion chromatography does not provide high resolution method and is not capable of separating analytes of similar size. Stationary phase is normally comprised of hydrophilic silica, polymer-based, or porous hybrid organic/inorganic particles (BEH columns). The high mechanical strength of BEH particles enables a reduction in particle size to 1.7 mm, thereby offering more chromatographic efficiency using UPLC instrumentation.42 Recently organic modifiers and volatile buffers have been introduced into SEC methods to make it suitable with mass spectrometry.43
SEC-HPLC is mainly used to assess high molecular weight (HMW) aggregates and monomeric purity of antibody therapeutics, which is a critical quality attribute (CQA) that is often monitored in for a biosimilar.
Hydrophilic interaction liquid chromatography
Hydrophilic interaction liquid chromatography (HILIC) is a separation mode that uses a polar stationary phase and solvents similar to reversed phase chromatography (e.g., water, methanol, acetonitrile, volatile buffers and modifiers). HILIC methods can be directly coupled to mass spectrometers since all mobile phases are suited for MS. Because HILIC stationary phases are polar, the technique is well-suited for the analysis of polar molecules that have limited or no retention on typical reversed phases like C8 and C18. In terms of biosimilar characterization, HILIC is used for glycan analysis. Since the initial conditions are highly organic (>60%), HILIC can only be used to separate proteins that remain soluble at such high organic content.
Since the separation is based on the size and structure of glycans, if those glycans are still attached to the respective peptides or subunits, or even to intact proteins, it is possible to separate the peptides/ proteins. Glycopeptides and glycoproteins can be separated in HILIC by using wide pore-size columns (300 – 400 Å instead of the usual 130 Å pore size (glycan columns)).44
Secondary and Tertiary Structure
The higher order structure of biotherapeutics is a critical quality attribute that can be evaluated by a variety of methods. Atomic resolution structural analysis can be obtained using methods such as X-ray crystallography and multi-dimensional NMR spectroscopy, but typically involve considerable costs, time, and expertise. Optical spectroscopy methods do not provide information at the atomic coordinate level, but provide structural information that is spatially averaged over the protein. Lower resolution optical spectroscopy methods, such as circular dichroism (CD), Fourier Transform Infrared (FTIR), and fluorescence spectroscopy have been utilized to study protein conformational stability and comparability between innovator and biosimilars.45
As each optical spectroscopy method relies on a reporter moiety that relates to a structural characteristic of the protein, a combination of these methods can provide complementary information on the structural motifs of a protein for biosimilar comparability. Circular Dichroism is a useful tool in the study of the secondary and tertiary structure of a protein. The Far UV CD (190 to 260 nm) spectrum of proteins can provide the fractional estimate of secondary structure features such as the alpha helix, beta-sheet, and random coil conformation. Obtaining the Near UV CD (250 to 300 nm) spectrum of a protein provides information about the tertiary structure and folded state of the protein. While spectrum within this region cannot be assigned to a particular tertiary structure, the CD signal from the aromatic amino acids phenylalanine (250 to 270 nm) tyrosine (270 to 290 nm), and tryptophan (280 to 300 nm) will show strong signals when present in a well-defined rigid structure indicating that the protein has folded into a well-defined structure. A broad weak signal from disulfide bonds (250 to 260 nm) can be particularly useful in the analysis of the folding state of monoclonal antibodies. Circular dichroism spectroscopy in combination with FTIR and antibody array mapping was used to characterize a biosimilar of infliximab for FDA approval.46
Low resolution spectroscopy techniques provide invaluable tools for comparative analysis of biosimilars to the innovator drug, but as the characterization of critical quality attributes have become more stringent, higher resolution structural analysis is needed to characterize the small changes in conformation that may result in efficacy differences between the innovator and biosimilar. In a recent report in Nature Biotechnology, an inter-laboratory study by NIST and collaborators, using four independently manufactured versions of a therapeutic drug, filgrastim, have demonstrated the utility of two dimensional nuclear magnetic resonance (2D NMR) to provide a fingerprint of therapeutic drugs at atomic level resolution.47 Using the 2D NMR experiment, 1 H-15N HSQC, the chemical shifts of all 1 H-15N amino acid residue backbone amide and nitrogen containing side chains are recorded. The chemical shifts of each peak on the 2D spectrum are related to the nature of the amino acid residue and its local environment. Any changes in the environment (pH, local conformation, salt, temperature, etc.) of an amino acid residue will result in changes in the chemical shift of its peak and neighbors. In this study, the original Filgrastim product licensed in the U.S. was compared to three unlicensed biosimilar versions. When using six different spectrometers at four different laboratories the spectra acquired showed high similarity when analyzed. This study demonstrated the precision and robustness of 2D NMR for providing an atomic level resolution “fingerprint” of the originator drug product and the biosimilar products for comparative analysis. NIST is currently organizing a large inter-laboratory study with 30 partners from five continents to extend 2D NMR methods to the largest class of approved protein therapeutics in the world, monoclonal antibodies. This study is expected to develop best practices to ensure the reliability and repeatability of results and promote the acceptance of 2D NMR for the evaluation of higher order structure of biosimilars.
Hydrogen/deuterium exchange mass spectrometry has become a useful method to determine the dynamics of protein conformation and protein interactions. The principle is based upon the hydrogen bonding between the amides of the protein backbone and those of the amino acid side chains. The exchange rate is low for those regions that have a higher degree of hydrogen bonding stabilization. Areas that are inside hydrophobic pockets and less exposed to the surrounding solution exhibit this characteristic. Determining where deuterium has replaced hydrogen can lead to the understanding of the three dimensional structure of the protein. These mass shifts can also help define the location of an antibody with its corresponding antigen.
The H/D exchange experiments need to be done at low temperature (near 0°C) and pH (2-3) because the half-life of the conversion of the amide hydrogens is between 30 and 90 minutes. Intact mass measurements are made to obtain the exchange profile of the complete protein or protein complex. Proteolytic digestion is done in conjunction with the labeling under conditions to allow for the resulting peptides to be analyzed by LC/MS. Peptide fragmentation will indicate which residues were more prone to exchange than others.48
Conclusion
The economic forecast for biosimilars is lucrative and enticing to the pharmaceutical industry as a number of innovator biotherapeutics will be coming off patent in the next several years. Also driving the market is the forecasted savings to healthcare, and hopefully, making these drugs more available to those needing treatment. Current analytical techniques relevant to structural characterization and monitoring critical quality attributes have been discussed in detail throughout this article. The ultimate goal of such analysis is to show that the biosimilar is equivalent to the innovator in structure and that it is safe and an effective therapeutic. As more biosimilars come on the scene, increased demands will be placed on scientists to understand and characterize these complex structures. Although improvement in current technology, especially mass spectrometry, will enhance the process, many of the techniques only touch a part of the biosimilar. As with the blind men, who touched a part of the elephant, knowing in part may make a fine tale, but true wisdom comes from seeing the whole. And so it is with biosimilars.
Refererences
- Walsh, G., Post-translational modifications of protein biopharmaceuticals. Drugs Discov. Today, 2010, 15, 773-780
- Jayapal, K. P., Wlaschin, K. F., Hu, W. S. and Yap, M. G. S., Recombinant Protein therapeutics from CHO cells – 20 years and counting. Chem. Eng., 2007, 103, 40-47
- Hossler, P., Protein glycosylation control in mammalian cell culture: Past precedents and contemporary prospects. Adv. Biochem. Eng. Biotechnol., 2012, 127, 187-219.
- Hossler, P., Khattak, S. F. and Li, Z. J., Optimal and consistent protein glycosylation in mammalian cell culture. Glycobiology 2009, 19, 936-949.
- Restelli, V. and Butler, M., The effect of cell culture parameters on protein glycosylation. In Cell Engineering: Glycosylation (ed. Al Rubeai, M.), Springer The Netherlands, 2002, pp. 61-92.
- Barnes, L. M., Moy, N. and Dickson, A. J., Phenotypic variation during cloning procedures: analysis of the growth behavior of clonal cell lines. Biotechnol. Bioeng., 2006, 94, 530-537.
- Chen, C. and Chasin, L., Cointegration of DNA molecules introduced into mammalian cells by electroporation. Somatic Cell Mol. Genet., 1998, 24, 249-256.
- Feary, M., Racher, A. J., Young, R. J. and Smales, C. M., Methionine sulfoximine supplementation enhances productivity in GS-CHOK1SV cell lines through glutathione biosynthesis. Biotechnol. Prog. 2017, 33(1), 17-25
- Chusainow, J., Yang, Y. S., Yeo, J. H. M., Toh, P. C., Asvadi, P., Wong, N. S. C. and Yap, M. G. S., A study of monoclonal antibody-producing CHO cell lines: What makes a stable high producer? Biotechnol. Bioeng., 2009, 102, 1182-1196.
- Abu-Absi, S., Xu, S., Graham, H., Dalal, N., Boyer, M. and Dave, K., Cell culture process operations for recombinant protein roduction. In Mammalian Cell Cultures for Biologics Manufacturing (eds Zhou, W. and Kantardjieff, A.), Springer, Berlin, Heidelberg, 2014, pp. 35-68.
- Croughan, M. S., Konstantinov, K. B. and Cooney, C., The future of industrial bioprocessing: Batch or continuous? Biotechnol. Bioeng., 2015, 112, 648- 651.
- Chu L and Robinson DK, Industrial choices for protein production by large-scale cell culture. Curr Opin Biotechnol., 2001, 12, 180–187.
- Li F, Vijayasankaran N, Shen AY ,Kiss R and A manullah A, Cell culture processes for monoclonal antibody production. MAbs2 (2010).
- Farid SS, Process economics of industrial monoclonal antibody manufacture. J Chromatogr B Analyt Technol Biomed Life Sci 848:8–18(2007).
- Ho SV, McLaughlin JM, Cue BW and Dunn PJ, Environmental considerations in biologics manufacturing. Green Chem 12:755–766(2010).
- https//www.bioprocessonline.com/doc/”The US biosimilar market and where it is today and where is it going?
- Fornelli LDAyoub, Aizikov K, A. Beck A, and Tsybin YO, Anal. Chem. 86, 3005-3012 (2014).
- Leney AC, Heck AJR, Native Mass Spectrometry: What is in a name? J.Am.Mass Spectrom. 2017, 28: 5-13
- Wilkins MR, Lindskog I, Gasteiger E, Bairoch A, Sanchez JC, Hochstrasser DF, Appel RD. Detailed peptide characterisation using PEPTIDEMASS - a World-Wide Web accessible tool. Electrophoresis. 1997;18(3-4):403-408. http://web.expasy.org/peptide_mass or / peptide_cutter
- Gasteiger E, Hoogland C, Gattiker A, Duvaud S, Wilkins MR, Appel RD, Bairoch A. Protein Identification and Analysis Tools on the ExPASy Server. In: Walker JM, ed. The Proteomics Protocols Handbook, Humana Press; 2005:571-607.
- Baker PR, Clauser KR. http://prospector.ucsf.edu.
- Podriguez J, Gupta N, Smith RD, Pevzner PA. Does Trypsin Cut Before Proline? J Proteome Res. 2008;7:300-305.
- Gershon PD. Cleaved and Missed Sites for Trypsin, Lys-C, and Lys-N Can Be Predicted with High Confidence on the Basis of Sequence Context. J. Proteome Res. 2014;13:702-709.
- Siepen JA, Keevil EJ, Knight D, Hubbard SJ. Prediction of Missed Cleavage Sites in Tryptic Peptides Aids Protein Identification in Proteomics. J. Proteome Res. 2007;6: 399-408.
- Wisniewski JR, Zougman A, Nagaraj N, Mann M. Universal Sample Preparation Method for Proteome Analysis. Nature Methods. 2009;6:359-362.
- Sechi S, Chait BT, Modification of cysteine residues by alkylation A tool in peptide mapping and protein identification. Anal Chem. 1998; 70:5150-5158.
- Paulech J, Solis N, Cordwell SJ, Characterization of reaction conditions providing rapid and specific cysteine alkylation for peptide-based mass spectrometry. Biochim Biophys Acta. 2013;1834:372-379.
- Eng JK, McCormack AL, Yates JR. An approach to correlate tandem mass spectral data of peptides with amino acid sequences in a protein database. J Am Soc Mass Spectrom. 1994;5: 976–989.
- Pappin DJ, Hojrup P, Bleasby AJ. Rapid identification of proteins by peptide-mass fingerprinting. Curr. Biol. 1993;3:327–332.
- Apweiler R, Hermjakob H, Sharon N. On the frequency of protein glycosylation, as deduced from analysis of the SWISS-PROT database. Biochim. Biophys. Acta 1999; 1473(1):4-8.
- Specifications: Test Procedure and Acceptance Criteria for Biotechnological/Biological Products Q6B: https://www.ich.org/fileadmin/Public_Web_Site/ICH_Products/ Guidelines/Quality/Q6B/Step4/Q6B_Guideline.pdf
- Krenkova J, Szekrenyes A, Keresztessy Z, Foret F, Guttman A. Oriented immobilization of peptide-N-glycosidase F on a monolithic support for glycosylation analysis. J Chromatogr. A. 2013;1322:54-61.
- Szigeti M, Lew C, Roby K, Guttman A. Fully Automated Sample Preparation for Ultrafast N-Glycosylation Analysis of Antibody Therapeutics. J. Lab. Autom. 2016;2:281-6.
- Prozyme, https://prozyme.com/collections/glykoprep-protein-a
- New England Biolabs, https://www.neb.com/products/p0710-rapid-pngase-f#Product% 20Information
- McQueen P, Krokhin O. Optimal selection of 2D reversed-phase-reversed-phase HPLC separation techniques in bottom-up proteomics. Expert Rev. Proteomics 2012; 9(2):125-8
- https://www.nestgrp.com/pdf/Pp1/HIC-MS_bulletin.pdf
- Haverick M, Mengisen S, Shameem M, Ambrogelly A. Separation of mAbs molecular variants by analytical hydrophobic interaction chromatography HPLC. mAbs 2014; 6(4):852–858.
- http://www.waters.com/webassets/cms/library/docs/720003836en.pdf
- Vlasak J, Bussat MC, Wang S, Wagner-Rousset E, Schaefer M, Klinguer-Hamour C, Kirchmeier M, Corvaïa N, Ionescu R, Beck A. Identification and characterization of asparagine deamidation in the light chain CDR1 of a humanized IgG1 antibody. Analytical Biochemistry 2009; 392(2): 145-154
- Gervais D. Protein deamidation in biopharmaceutical manufacture: understanding, control and impact. J. Chem. Technol. Biotechnol. 2016; 91(3): 569-575
- Bouvier ESP, Koza SM. Advances in size-exclusion separations of proteins and polymers by UHPLC. Trends in Anal. Chem. 2014; 63:85–94
- Liu H, Gaza-Bulseco G, Chumsae C. Analysis of reduced monoclonal antibodies using size exclusion chromatography coupled with mass spectrometry. J. Am. Soc. Mass Spectrom. 2009; 20(12): 2258–2264.
- http://www.waters.com/webassets/cms/library/docs/720005409en.pdf
- M. DiPaola, Analytical Strategy in the Development of Biosimilars, BioPharm International 30 (8) 2017.
- Jung SK, Lee KH, Jeon JW, et al. Physicochemical characterization of Remsima®. mAbs. 2014;6(5):1163-1177. doi:10.4161/mabs.32221.
- Ghasriani H, Hodgson DJ, Brinson RG, et al. Precision and Robustness of 2D-NMR for structure assessment of filgrastim biosimilars. Nature biotechnology. 2016;34(2):139-141. doi:10.1038/nbt.3474.
- Yan X, Maier CS. Hydrogen/Deuterium Exchange Mass Spectrometry. In: Lipton M, PasaTolic L, eds. Mass Spectrometry of Proteins and Peptides, Vol. 492, 2nd ed. New York, NY: Humana Press/Springer Science; 2009:255-271.