This white paper explores a number of ways that today’s modern, laboratory-based PXRD instrumentation and advanced software can greatly assist pharmaceutical scientists in their quest to develop high quality, stable products and accelerate their speed to market. All applications described and many more can be performed on a single PXRD instrument.
Detecting the Presence of Trace Polymorphs and Impurities
In the pharmaceutical industry, the detection of polymorph traces is one of the most important applications for powder X-ray diffraction. The need for better limits of detection (LOD) is driving advances in detector and optical technologies. While classical PXRD configurations were purported to have a limit of detection (LOD) in the range of 0.5-2%,1,2,3 modern systems with specially designed optics can have detection limits below 0.1%, up to an order of magnitude below the commonly believed detection limit. These optics achieve excellent LOD by suppressing the continuous radiation (Bremsstrahlung) and therefore improving the signal to noise ratio in the data.
One such optic for greatly improved limits of detection is the Malvern Panalytical BraggBrentanoHD optic (BBHD). The example below shows part of the diffraction pattern for an Indomethacin (IMC) mixture of two crystalline polymorphs in excipient. The mixture was made with 0.25 % alpha-Indomethacin, 4.75% gamma-Indomethacin and two excipients (98.5% alpha-lactose monohydrate, 1.5% Magnesium stearate). Figure 1a. shows the alpha-Indomethacin peak measured with a BBHD optic with a significant improvement of the LOD to 0.12%, as compared to standard slit optics in Figure 1b.
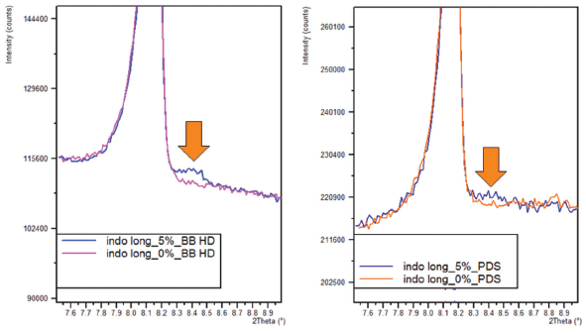 Figure 1a. 0.25% alpha-indomethacin peak measured with BBHD optic. b. 0.25% alpha-indomethacin peak measured with slit optics
Determining Amorphous Content
PXRD is an accepted method in determining amorphous content in the 10-90% range.4 However with the advances in XRPD instrumentation producing higher quality data, combined with modern approaches to the quantification of amorphous content, accurate determination in the 1-10% amorphous content range is now possible.
In this example 10 α-lactose monohydrate standards were created with amorphous content ranging between 1 and 10 percent, and the resultant data set was analyzed using two different methods to quantify the amorphous content:
- peak to background ratio method
- partial least squares (PLS) regression
The PLS method is also used by other techniques such as FT-IR for pharmaceutical amorphous determination, and is ideal for cases where discernible peak(s) attributed to a phase are not found in the pattern. “PLS uses the whole spectrum or a selected region of the spectrum to develop calibration models.”5Figure 3 shows the comparison of confidence limits between the two methods. The PLS method produced a calibration curve with a significantly better standard deviation (0.035% vs 0.26% for the peak to background method), higher coefficient of determination (R2) which equates to a better fit of measured to predicted values, and a lower error of intercept value (0.024% versus 0.179%). Thus PLS can be a more reliable and accurate method to determine low amorphous content.
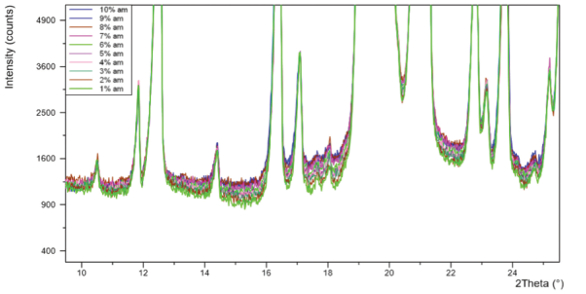 Figure 2. PXRD patterns for ten α-lactose monohydrate standards with 1-10% amorphous content
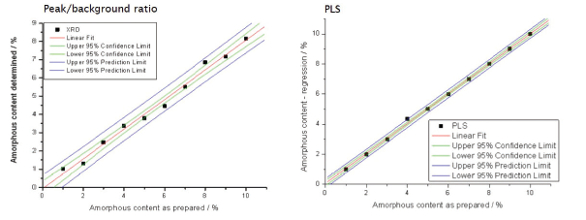 Figure 3. Comparison of confidence limits for two methods of amorphous content determination
Exploring Co-Crystallization Parameters and Polymorphs
An important step in drug development is the investigation of polymorphs, chemically identical substances present in different crystallographic forms. APIs often occur in various polymorphic forms, potentially displaying different dissolution properties and therefore different bioavailability. Polymorph analysis and salt screening may aid in the selection of a suitable solid form of a drug to optimize its critical properties. Discovery and protection of all polymorphs by patent allow drug inventors to secure their intellectual property and market position.
PXRD systems equipped with an X-Y-Z-stage for combinatorial screening of samples in a well plate can perform high resolution, high throughput screening when using a transmission configuration.
Processing of data is greatly aided by automated cluster analysis software to compare, group and identify the crystalline (or amorphous) phases formed in the wells.
In this example, cimetidine from Sigma Aldrich was dissolved in various solvents and dispensed into 96-well plates, to recrystallize under various concentration and temperature combinations. PXRD patterns were collected from each well. In Figure 4, cluster analysis of the patterns showed that all fell into three clusters of closely related scans, and further analysis of representative scans from the clusters could be performed for indexing and full pattern fits.
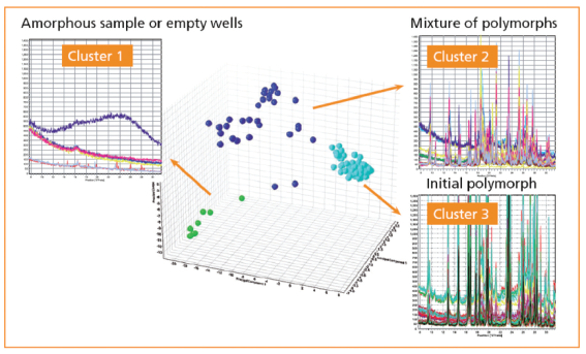 Figure 4. Cluster analysis of PXRD patterns measured on a 96 well plate
Studying the Crystallization Process
Crystallization is always a key aspect of pharmaceutical manufacturing and development, as it can have significant impact on the effi-ciency and profitability of the overall process. Over 90% of all pharmaceutical products contain active ingredients produced in crystalline form, and undetected fluctuations in the crystallization process can alter the crystal structure, affecting bioavailability and potentially safety of the product. Therefore, monitoring of the crystallization processes in research and scale-up is essential for a QbD approach. Using a flow cell on a laboratory PXRD system allows in situ studies of many crystallization parameters, such as investigation of intermediates and hemi-hydrates forming during the crystallization process, and parameter optimization such as pH, solvent and anti-solvent concentration.
In this study, DL-Alanine was crystallized from solutions with varying pH. In the case of the pH 6.1 experiment, it can be seen that strong preferred orientation developed after 38 hours of monitoring the crystallization process, resulting in the formation of acicular crystals (Figure 5).
 Figure 5. PXRD patterns of the crystallization of DL-Alanine
Determination of Protein Shape, Compactness, Oligomeric State and Stability with Temperature Changes
Small-angle X-ray scattering (SAXS) applied to protein solutions has become an accepted structural biology technique. In situ measurements provide information e.g. about protein size, shape and structure, folding/unfolding, aggregation, stability with varying temperature, and molecular weight which can indicate oligomeric state and presence of oligomeric mixtures.
 Figure 6. Pair distance distribution function p(r) for the protein apoferritin
In this example of size, shape and structure analysis by SAXS of a dilute solution of the protein apoferritin, the characteristic asymmetric shape of the pair distance distribution function p(r) determined for this protein (Figure 6) points to a hollow structure with a maximum outer dimension Dmax of 13 nm. This is also in line with the result obtained from ab initio shape reconstruction (Figure 7a) with DAMMIF,6 using a bead modelling and simulated annealing procedure which indicates an overall spherical shape and the presence of a central cavity. SAXS data simulated with CRYSOL7 from the published single crystal structure (PDB 1IER) show a good agreement with the experimental data. This demonstrates the similarity of the protein structure in crystal form (Figure 7b) and in dilute solution.
 Figure 7a. ab initio shape reconstruction b. protein structure of apoferritin
Assessing Effect on Materials Subjected to Varying Heat and Humidity
Pharmaceutical substances upon exposure to heat and/or high relative humidity (RH) – for example during storage or transport – can undergo unexpected phase transformations that can affect a product’s efficacy. Modern PXRD systems can be equipped with the latest temperature controlled humidity stages, allowing the measurement of PXRD data at RHs up to 95% at room temperature and 75% at 60 degrees C.
In this experiment, crystalline trehalose dihydrate (C12H22O11- 2H2 O), an important cryoprotectant used in the production of protein based drugs that undergo lyophilization, was exposed to a range of temperature and relative humidity combinations. The PXRD patterns were analyzed to determine which phases were present at each condition, and a resultant RH-T “phase” diagram could be develod (Figure 8). Trehalose dihydrate (Th) was seen to be very stable over a wide range of temperatures. Two polymorphs of trehalose anhydrate were observed: a stable form Tβ and an unstable form Tα . An amorphous form of trehalose (Ta) was also observed in the high temperature – low humidity regime.
 Figure 8. RH-T phase diagram for trehalose
Comparing your Material’s Structure to Literature and Patent XRPD Patterns
Patents and literature can be sources for digital or printed diffraction patterns, which you might need to compare to material you are producing. A bitmap converter, such as found in Malvern Panalytical’s Highscore (Plus) software8 allows digital or printed images to be digitized into an XML file suitable for diffraction analysis and comparison. In this way, all related patented polymorph patterns can be added along with patterns that are calculated from single crystal structure solution data into one Search/Match database for comparison purpose to ensure synthesized APIs do not infringe patents. In this example, images of PXRD patterns in patent US 8217061 B29 were converted into XML files (Figure 9), and compared by cluster analysis to look for similar patterns. The seven patterns formed two clusters of two similar patterns, and three were found to be statistically different from the clusters (Figure 10).
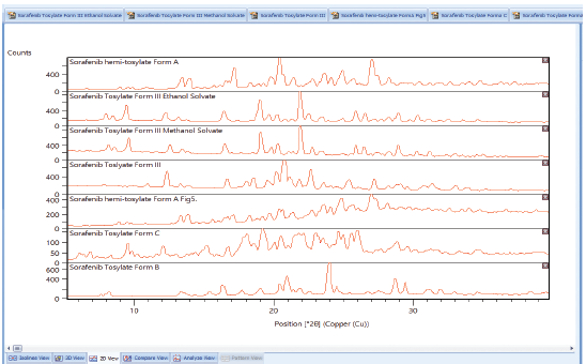 Figure 9. digitized PXRD patterns from the patent US 8217061 B211
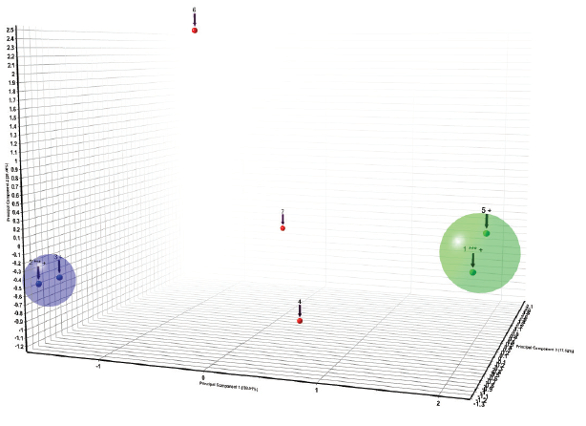 Figure 10. Cluster analysis of the patterns found in US 8217061 B211
References
- http://www.nf-itwg.org/pdfs/ITWG-INFL-PXRD.pdf, page 6
- http://www.xrd.us/
- http://old.vscht.cz/clab/RTG/dokumenty/panalytical/xrd/X-ray%20powder%20 diffraction%20-%20a%20powerful%20tool%20in%20pharmaceutical%20analysis.pdf
- https://www.americanpharmaceuticalreview.com/Featured-Articles/36758-Approachesto-Quantification-of-Amorphous-Content-in-Crystalline-Drug-Substance-by-Powder-Xray-Diffraction/
- S. Byrn, G. Zografi , X. Chen, Solid State Properties of Pharmaceutical Materials, John Wiley and Sons, 2017, p.337
- D. Franke and D.I. Svergun, J. Appl. Cryst. 42 (2009), 342-346.
- D.I. Svergun, C. Barberato, M.H.J. Koch, J. Appl. Cryst. 28 (1995),768-773.
- T. Degen, M. Sadki, E. Bron, U. König & G. Nénert, The HighScore Suite, Powder Diffr. Vol. 29, (2014), Supplement S2, S13 - S18.
- https://www.google.com/patents/US8217061