Protein Analytical Development
Protein Analytical Development
Abstract
In this article, analytical strategies for characterization of N-linked glycosylation and monosaccharides have been compared. The application of hydrophilic interaction chromatography with fluorescence detection (HILIC-FLR) and capillary electrophoresis with laser-induced fluorescence (CE-LIF) for N-glycan analysis, including a discussion of the advantages and disadvantages of these commonly applied analytical techniques for N-glycan analysis are discussed. The robust and quantitative monosaccharide compositional analysis by CE-LIF at a bare silica capillary requires basic condition to assure stable electroosmotic flow.
A case study is presented that highlights glycoanalysis technique useful for analysis of complex N-glycans derived from therapeutic proteins.
Key words: N-glycans, monosaccharides, CELIF, HILIC.
Abbreviations: capillary electrophoresis with laser-induced fluorescence detection (CELIF), hydrophilic interaction chromatography (HILIC), ion chromatography (IC), pharmacokinetic (pK).
Subscribe to our e-Newsletters
Stay up to date with the latest news, articles, and events. Plus, get special offers
from American Pharmaceutical Review – all delivered right to your inbox! Sign up now!
Introduction
Glycosylation of therapeutic proteins is of particular significance during biopharmaceutical development as it potentially plays an important role in the stability, safety, immunogenicity, efficacy, solubility and halflife of biopharmaceuticals.1 N-linked glycans are comprised of a heterogeneous mixture of chemical structures which require sensitive and specific analytical techniques for characterization. A sound analytical control strategy will require the development of assays that can accurately and precisely measure relative glycan levels during biopharmaceutical production.
Glycosylation plays a broad role in the structure and function of biotherapeutic proteins. In many cases, the terminal N-acetylneuraminic acid (NANA) content in a glycoprotein affects the circulatory half-life, and therefore NANA is a typical marker for product quality assessment in protein therapeutics.2 The NANA levels of N-glycans are dependent upon the galactose (Gal) monosaccharide attached to N-Acetylglucosamine (GlcNAc). The latter determines the resulting level of terminal galactosylation. The presence of α(1,3)-Linked Gal even at low levels has been shown to be immunogenic.3 The efficacy and pK profile of a glycoprotein therapeutic can be impacted by the relative abundance of high mannose and and GlcNAc.3,4 Finally, the presence of α(1,6)-Fuc attached to N-glycans was shown to affect antibody functions, including Fc receptor binding and antibody-dependent cell cytotoxicity (ADCC).5,6
Detailed characterization of glycans present on recombinant glycoprotein remains an important challenge in the development and production of biotherapeutics. Glycan analysis could be performed at the level of intact glycoprotein, glycopeptide after proteolysis, released glycans, and monosaccharide. Multiple strategies employing several different analytical techniques have been used for characterization of released N-glycans. These include CE-LIF, HILIC and/or ion exchange chromatography (IEC). Rapid methods with automated sample preparation are essential to analysis of large sets of samples.
Here we summarize our recent findings, where the selection of a proper analytical technique led to an efficient method for profiling of complex types of N-glycans and a robust method for monosaccharide composition analysis.
Strategy for N-glycan Analysis of Pharmaceutical Samples
Two strategies for characterization of N-linked glycosylation have been compared. These include the application of HILIC and CE-LIF to analysis of released N-linked glycans. N-linked glycans enzymatically released from the model protein by PNGase F treatment were labeled with either 2-aminobenzoic acid (2-AB) for HILIC-FLR analysis, or 8-aminopyrene-1,3,6-trisulfonate (APTS) for CE-LIF analysis.
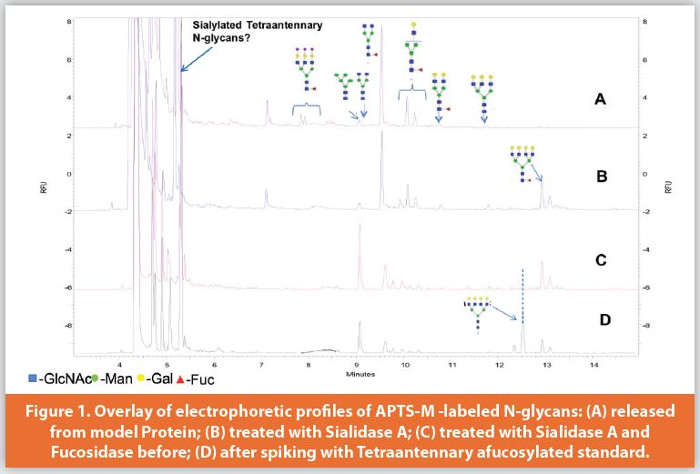
Figure 1 shows an overlay of N-glycans released from the model protein A before and after treatment with Sialidase A. The sialidase treatment revealed significant amounts of sialylated N-glycans which were not visible in the untreated sample. Sialidase A/Fucosidase digestion (C) and spike with A4G4 standard (D) allowed identification of tetrantennary fucosylated N-glycans.
The data suggests that sialylated tetraantennary N-glycans may not have been detected by CE due to co-migration with the excess of dye.
Figure 2 depicts hydrophilic interaction chromatogram of 2-AB labeled N-glycans released from the model protein. Hydrophilic interaction chromatography (HILIC) coupled with MS detection allowed identification of tetra-antennary acidic fucosylated and afucosylated glycans with relative abundance up to 25% which were not detected by CELIF.
Thus, the analytical platform consisting of HILIC UPLC combined with 2-AB labeling and fluorescence detection was found to offer a method of choice for separation of N-glycans with better peak resolution, sensitivity, and throughput compared to the CELIF method with APTS labeling. Moreover, the improvement in glycan separation offered by HILIC enabled separation of species (Man6, Man7, Man8, Man9) which may have been difficult to observe using CE-LIF.
A method for quantitative analysis of monosaccharides including N-acetylneuraminic acid derived from sialic acid-containing oligosaccharides and glycoproteins was developed. The monosaccharide composition analysis employs capillary electrophoretic separation of monosaccharides liberated from glycoproteins or oligosaccharides, acidic hydrolysis under elevated temperature using trifluoroacetic acid (TFA). The monosaccharide in the hydrolysates were then labeled with a charged fluorophore, APTS. The labeled monosaccharides were then separated by high-performance capillary electrophoresis with laser induced fluorescence detection. Two conditions for separation of the released and labeled monosaccharide have been compared. These include separation at pH 5.5 and separation at pH 10.5.
The rate of EOF is proportional to the pH of the buffer solution and increases with pH until all silanols at the bare capillary are fully ionized. High variability in electrophoretic profiles was observed depending on an electroosmotic flow when separation was performed at slightly acidic pH (5.5).
On the other hand, a stable electrophoretic profile was detected at pH values above 10, allowing for robust and quantitative monosaccharide compositional analysis (Figure 3). Monosaccharide standards were used to generate a calibration curve (corrected area of monosaccharide over corrected area of internal standard vs nmol of monosaccharide standard). The amount of monosaccharide (nmol) was expressed per amount of protein (nmol) used for hydrolysis. The developed method showed good precision and accuracy for monitoring monosaccharide composition of pharmaceutical samples.
Conclusion
Good process and product development start and end with the right analytical methods. Overall, the HILIC-based strategy was found to be the most advantageous for quantitative carbohydrate analysis of the widest variety of N-glycans. CE-LIF allows profiling of neutral glycans, but showed limitations during analysis of sialylated and sulfated sialylated tetraantennary N-glycans, due to co-migration with system peaks. In addition, improvements in separation of co-migrating neutral and high mannose N-glycans are required for CE-LIF analysis of N-glycans. Monosaccharide analysis using bare silica CE capillary should be performed at pH values above 10. The findings illustrate that selecting the right analytical method is crucial to providing results that can ensure consistency, efficacy, and safety of therapeutic products.
Acknowledgement
The authors thank Dr. Z. Sosic and Dr. Y. Lyubarskaya for their support of this work.
Author Biographies
Dr. Tyler Carlage is a Scientist II in the Protein Analytical Development department of Biogen. Tyler has worked in Analytical Development for 17 years, and currently manages a team of scientists focused on development of separations and mass spectrometry-based methods for characterization of clinical- and commercial-stage programs. Tyler received his Ph.D. from Northeastern University.
Dr. Iva Turyan is a Scientist II in the Protein Analytical Development department at Biogen. Prior to joining Biogen, she was a Study Director at Toxikon. Iva received her Ph.D. from the St. Petersburg University.
References
- a) Lis H, Sharon N. Protein glycosylation. Structural and functional aspects. Eur J Biochem. 1993;218(1):1–27; b) Lowe JB, Marth JD. A genetic approach to mammalian glycan function. Annu Rev Biochem. 2003;72:643–691.
- Ghaderi D, Taylor RE, Padler-Karavani V, Diaz S, Varki A. Implications of the presence of N-glycolylneuraminic acid in recombinant therapeutic glycoproteins. Nat. Biotechnol. 2010;28(8):863-867.
- Hossler P, Khattak SF, Li ZJ. Optimal and consistent protein glycosylation in mammalian cell culture. Glycobiology 2009;19(9):936–949.
- Goetze AM, Liu YD, Zhang Z, et al. High-mannose glycans on the Fc region of therapeutic IgG antibodies increase serum clearance in humans. Glycobiology 2011;21(7):949–959.
- Shields RL, Lai J, Keck R, et al. Lack of fucose on human IgG1 Nlinked oligosaccharide improves binding to human FcγRIII and antibody-dependent cellular toxicity. J. Biol. Chem. 2002;277(30):26733-26740.
- Zhang Z, Luo S, Zhang B. Glycan analysis of therapeutic glycoproteins. Mabs 2016;8(2):205-215.