Department of Biotechnology, Graduate School of Engineering
Introduction
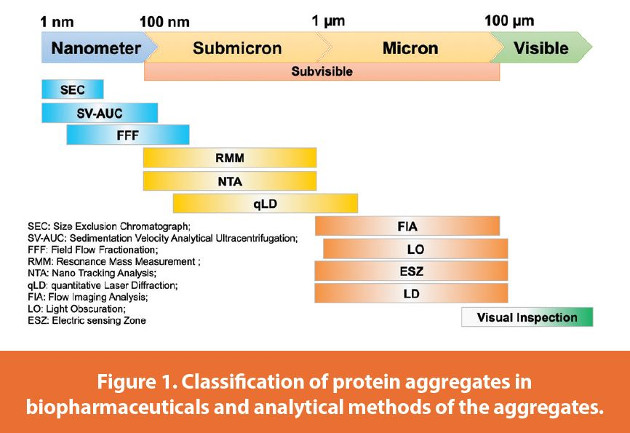
While the relation of protein aggregates in biopharmaceutical products to the immunogenicity after administration is not fully understood and thus remains elusive, protein aggregates have been considered to be a potential risk for biopharmaceuticals as the aggregates may elicit an immune response.1 In 2014, the Food and Drug Administration (FDA) issued a draft guidance on immunogenicity assessment of therapeutic protein products in which the necessity of careful consideration of protein aggregates was described.2 Particles contained in biopharmaceuticals including protein aggregates are classified into different categories based on several properties such as size, chemical composition and the ability of dissociation upon dilution.3 Classification of the aggregates according to the size has been frequently employed and therefore (Figure 1), in this article, methods for protein aggregates evaluation is introduced according to size classification. Protein aggregates range from tens of nanometers to hundreds of micrometers with different densities that generate the varies of refractive index. Particles included in biopharmaceuticals with the diameter from 100 nm to 100 μm are called subvisible particles (SVPs).4 SVPs have been extensively investigated during the last ten years with regards to impact on the immune system and analytical instruments for SVPs characterization has been developed. It is now widely recognized that protein aggregates should be quantified based on the size of aggregates and by using at least two orthogonal methods.2 The importance of characterizations for protein aggregates using orthogonal methods is originated from the fact that: no methods can provide absolute concentration of protein aggregates because of the absence of a protein aggregate standard; and any existing method can cover only a limited size range. Therefore, in addition to the combination of different methods to cover a wide range of sizes, a concentration of protein aggregates in a certain size range obtained from a method should be verified by other methods which measure the concentration based on different detection principles.
Among biopharmaceuticals, aggregation of antibody drugs in which the active pharmaceutical ingredients are immunoglobulin (IgG) molecules with their diameter of about 14 nm have been well studied. Here, we show how antibody drug aggregates should be characterized is explained, however, in principle, the following approaches could be applicable to other types of therapeutic proteins and peptides.
Subscribe to our e-Newsletters
Stay up to date with the latest news, articles, and events. Plus, get special offers
from American Pharmaceutical Review – all delivered right to your inbox! Sign up now!
Nanometer Aggregates
Antibody molecules form small and soluble aggregates with their diameter less than 100 nm. Such aggregates less than 100 nm are classified into nanometer aggregates. Quantitation of nanometer aggregates are generally performed by size exclusion chromatography (SEC) because SEC is robust, relatively high-throughput and reproducible, and possesses the sensitivity enough to detect 0.1% small aggregates. However, the limitations of SEC are now well realized. As Carpenter’s group pointed out,5 SEC is a kind of filter and therefore aggregates of more than 40-60 nm are frequently unable to pass through the SEC column. The recovery rate should be confirmed to judge if the SEC results correspond to whole amounts of antibody molecules injected into the SEC column. Another limitation of SEC is the restriction of elution solvent. Phosphate buffer at neutral pH with physiological or higher salt concentration is generally used for SEC analysis. Such solvent conditions are employed to achieve well separated peaks whereas it is slightly or largely far from the formulation of the pharmaceutical antibody drugs. Difference in the ionic strength could lead to the change in the populations of monomer, dimer and higher molecular weight species.6,7 Sedimentation velocity analytical ultracentrifugation (SV-AUC) is a complemental method to SEC. SVAUC uses no polymer matrix and can analyze samples under wide varieties of solution conditions. Additionally, the most advantageous point of SV-AUC to SEC is that SV-AUC can detect aggregates that are unable to pass the SEC column. The discrepancy of aggregates contents between SEC and SV-AUC frequently happens in samples prepared at accelerated conditions such as the agitation of antibody solution in prefillable syringe format.8 The drawbacks of SV-AUC could be low throughput nature. Thus, although SEC can be used for routine assessment of antibody aggregates, the validation of output from SEC should be performed using SV-AUC. Dissociation of aggregates should be taken care of during measurements. Dimer, the smallest aggregates, are detected with high frequency, however they are considered as rather non-immunogenic partly because that dimer has similar molecular properties to monomer and often dissociates into monomer upon dilution (reversible aggregate). Monitoring influences of sample dilution on the quantity of dimer or even higher aggregates is effective to confirm the reversibility of the aggregates in SEC and SV-AUC.7
Submicron Aggregates (submicron SVPs)
Aggregates ranging from 100 nm – 1 μm are classified into submicron aggregates. While a fully reliable method for quantitative analysis of submicron aggregates is still under development, particle tracking analysis (NTA), resonance mass measurement (RMM), field flow fractionation (FFF) and quantitative laser diffraction (qLD) are available for the assessment of submicron aggregates. Characterization of biopharmaceuticals by these methods are not required from regulatory agencies, but useful for the characterization of antibodies at early developmental stages as well as for the formulation development during clinical stages. It should be noted that NTA and RMM measure only a portion of a solution, accordingly, the count of submicron aggregates could not reflect the aggregates concentration of whole solution when the aggregates dispersed heterogeneously. Larger aggregates such as micron aggregates often prevent the accurate quantification by NTA or RMM, because of masking scattering signals of submicron aggregates by the intense signal of the larger aggregates in NTA or partial clotting of microfluidics by the larger aggregates in RMM. FFF combined with multi-angle laser light scattering detector could provide size distribution even for a solution containing aggregates with broad size ranges.
We need to keep in our mind that the diameters of aggregates from these methods are provided based on assumptions. Two major assumptions exist, one: uniform physical properties for all aggregates, such as same chemical composition and same density; two: spherical shape for all aggregates, strictly speaking, both assumptions usually do not hold for protein aggregates. Each method above measures different physical properties of aggregates, for example, NTA traces time and spatial dependent scattered light from invisible particles from which the diameters of aggregates are estimated using Stokes-Einstein equation under the assumption of complete spherical shape for all the aggregates, whereas RMM measures buoyant mass of aggregates from which the volumes of the aggregates are deduced under assumption of equality of partial specific volume of all the aggregates, followed by the estimation of diameters for sphere particles having the same volume as those of the aggregates. Hence, size distributions in a diameter unit become inconsistent between NTA and RMM when one of the assumptions is not satisfied.
qLD is a powerful method that could estimate size distribution of aggregates with broad size ranges covering submicrons and single microns.9 Incorporation of the refractive index for protein aggregates during the data analysis will lead to reliable size distributions. In the submicron range, it was confirmed that size distribution of protein aggregates could be evaluated by qLD in quantitively consistent with RMM and NTA.10 Since batch type cells can be used in qLD measurement, time dependent development of aggregates can be monitored in real time manner from which aggregation pathway might be clarified.
Micron Aggregates Smaller than 10 μm (single micron SVPs)
Aggregates ranging from 1 μm – 10 μm belong to SVPs and are classified into (single) micron aggregates. Accurate evaluation including quantitative analysis of micron aggregates have recently become required, as the impact of micron aggregates on product safety are realized and instruments are developed. Flow Imaging Analysis (FIA) is the eff ective approach.11 A certain type of micron sized protein aggregates has a refractive index close to solvent thus are apparently highly transparent. Effi cient detection of such transparent aggregates is generally diffi cult by conventional light obscuration (LO) but can be achieved by FIA which takes microscopic pictures of individual aggregates followed by image analysis. In addition, sizes of micron aggregates estimated from LO tends to be smaller than those from MFI. This discrepancy originates from LO and is mainly attributed to the transparent nature of protein aggregates; the detected signal change due to passing of an aggregate in front of the detector becomes equal to that of polystyrene standard (PS) bead with smaller diameter than the diameter of the aggregates, since the PS beads which have higher refractive index is used for the calibration of the LO instrument.12 In fact, the peak of the largest population aggregates in the ensemble of micron aggregates smaller than 10 μm comes slightly smaller in LO compared to FIA.13 Though FIA is effective for the characterization of micron aggregates, complete discrimination of protein aggregates from silicone oil (SO) droplets which are inevitably contained in the prefilled syringe products using the syringe barrel made of glass with silicon oil coating for smooth injection is difficult, especially for micron aggregates approximately less than 5-7 μm,14 because of the similar appearances between them. In addition to the difficulty in minimizing the incorporation of SO droplets number into the quantification of SVPs, SO coating on the barrel surface induces protein aggregation by agitation and during expelling,15 and furthermore proteins adsorbed on the surface of released SO droplets may invoke immune responses,16 it is therefore recommended to reduce the amount of coated SO and more preferably to fi ll protein solution into silicone oil free barrels. Besides LO and FIA, qLD is also applicable to the quantitative characterization while background membrane imaging (BMI) can be used for morphological and quantitative characterizations of micron aggregates.17
Micron Aggregates Larger than 10 μm (large micron SVPs)
Aggregates more than 10 μm also belong to SVPs and classified into (large) micron aggregates. In this size range, the pharmacopeia of countries has the same regulation related to “particulate matter in injections” for the quantitation of particles with the sizes more than 10 μm and 25 μm as well as the number restriction of them per a container (USP788, JP 6.07, EP 2.9.19). Also, in the US Pharmacopeia, “subvisible particulate matter in therapeutic protein injections (USP787)”, aimed at the characterization of biopharmaceuticals which is often provided as high concentration and small volume, was supplemented in 2014, and will be filed in other countries.18,19 These pharmacopeia state to use LO for the quantification of particulate matter in drug products.
Summary
Protein aggregates in biopharmaceuticals have a broad size range, typically ranging in size from tens of nanometer to a hundred of micrometers. Methods for characterizing protein aggregates are now available for different size ranges, qualitative and quantitative for nanometer and micron aggregates while qualitative and semiquantitative for submicron aggregates. Nevertheless, because of a lack of protein aggregates standards and the absence of a single method that can cover whole size ranges, assessment of aggregates by using more than two orthogonal methods for each size range should be performed for reliable evaluations.
References
- Rosenberg AS. Effects of protein aggregates: an immunologic perspective. AAPS J. 2006, 8(3):E501-507.
- Food and Drug Administration. Immunogenicity Assessment for Therapeutic Protein Products. Available at: https://www.fda.gov/media/85017/download. Accessed May 26, 2019.
- Narhi LO, Schmit J, Bechtold-Peters K, Sharma D. Classification of protein aggregates. J Pharm Sci. 2012, 101:493-498.
- Carpenter JF, Randolph TW, Jiskoot W, Crommelin DJ, Middaugh CR, Winter G, Fan YX, Kirshner S, Verthelyi D, Kozlowski S, Clouse KA, Swann PG, Rosenberg A, Cherney B. Overlooking subvisible particles in therapeutic protein products: gaps that may compromise product quality. J Pharm Sci. 2009 98:1201-1205.
- Carpenter JF, Randolph TW, Jiskoot W, Crommelin DJ, Middaugh CR, Winter G Potential inaccurate quantitation and sizing of protein aggregates by size exclusion chromatography: essential need to use orthogonal methods to assure the quality of therapeutic protein products. J. Pharm. Sci. 2010, 99:2200-2208.
- Philo JS. A critical review of methods for size characterization of non-particulate protein aggregates. Curr. Pharm. Biotechnol. 2009, 10(4):359-372.
- Uchiyama S., Noda M., and Krayukhina E. Sedimentation velocity analytical ultracentrifugation for characterization of therapeutic antibodies. Biophy. Rev. 2018, 10: 259-269.
- Krayukhina E., Tsumoto K., Uchiyama S., Fukui K. Effects of syringe material and silicone oil lubrication on the stability of pharmaceutical proteins. J. Pharm. Sci. 2015, 104: 527-535.
- Totoki S., Yamamoto G., Tsumoto K., Uchiyama S., Fukui K. Quantitative laser diffraction method for the assessment of protein subvisible particles. J. Pharm. Sci. 2015, 104: 618-626.
- Yoneda S., Niederleitner B., Wiggenhorn M., Koga H., Totoki S., Krayukhina E., Friess W., Uchiyama S., Quantitative laser diffraction (qLD) for a quantification of protein aggregates – comparison with resonant mass measurement, nano-particle tracking, flow imaging and light obscuration. J. Pharm. Sci. 2019 108: 832-841.
- Zölls S, Gregoritza M, Tantipolphan R, et al. How subvisible particles become invisible— Relevance of the refractive index for protein particle analysis. J Pharm Sci. 2013, 102 (5): 1434-1446.
- Ripple DC, Montgomery CB, Hu Z. An interlaboratory comparison of sizing and counting of subvisible particles mimicking protein aggregates. J Pharm Sci. 2015, 104(2): 666-677.
- Kiyoshi, M., Shibata, H., Harazono, A., Torisu, T., Maruno, T., Akimaru, M., Asano, Y., Hirokawa, M., Ikemoto, K., Itakura, Y., Iwura, T., Kikitsu, A., Kumagai, T., Mori, N., Murase, H., Nishimura, H., Oda, A., Ogawa, T., Ojima, T., Okabe, S., Saito, S., Saitoh, S., Suetomo, H., Takegami, K., Takeuchi, M., Yasukawa, H., Uchiyama, S., Ishii-Watabe, A. Collaborative study for analysis of subvisible particiles using flow imaging and light obscuration; experiences in Japanese biopharmaceutical consortium. J Pharm Sci. 2018, 108: 832-841.
- Torisu T, Maruno T, Yoneda S, Hamaji Y, Honda S, Ohkubo T, Uchiyama S. Friability testing as a new stress-stability assay for biopharmaceuticals. J. Pharm. Sci. 2017, 106: 2966-2978.
- Maruno T., Watanabe H., Yoneda S., Uchihashi T., Adachi S., Arai K., Sawaguchi T., Uchiyama S. Sweeping of adsorbed therapeutic protein on prefillable syringes promotes micron aggregate generation. J. Pharm. Sci. 2018, 107:1521-1529.
- Krayukhina, E., Yokoyama, M., Kakuhou Hayashihara, K., Maruno, T., Noda M., Watanabe, H., Uchihashi, T., and Uchiyama, S. An assessment of the ability of submicron- and micronsize silicone oil droplets in dropped pre-fillable syringes to invoke early- and late-stage immune responses. J. Pharm. Sci. 2019 in press.
- Helbig C., Ammann G., Menzen T., Friess W., Wuchner K., Hawe A. Backgrounded Membrane Imaging (BMI) for High-throughput characterization of subvisible particles during biopharmaceutical drug product development. J. Pharm. Sci. 2019 in press.
- Harazono, A., Shibata, H., Kiyoshi, M., Muto, T., Fukuda, J., Torisu, T., Saitoh, S., Nishimura, H., Uchiyama, S., Ishii-Watabe, A. Interlaboratory comparison about feasibility of insoluble particulate matter test for injections with reduced test volume in light obscuration method. Biologicals 2019, 57, 46-49.
- Ishii-Watabe, A., Shibata, H., Harazono, A., Hyuga, M., Kiyoshi, M., Saitoh, S., Iwura, T., Torisu, T., Goda, Y., Uchiyama, S. Recent topic in research on characterization and quality control of biopharmaceuticals in Japan. J. Pharm. Sci. 2017 106(12): 3431-3437.
Author Biography
Susumu Uchiyama has been studying solution properties and structures of proteins for 20 years using various biophysical methods. Factors that govern biophysical properties have been uncovered based on the results from these methods with different angles. So far, he has more than 200 publications in international journals. His study includes the rational formulation developments of therapeutic proteins and quantitative analysis of protein aggregates.