Abstract
The use of UHPLC is getting a lot of attention these days for moving pharmaceutical and environmental chromatographic applications to improved capabilities in selectivity and detection. Yet, UHPLC has one fundamental flaw in the eyes of many lab managers – it requires new capital outlays to buy instrumentation capable of running at the required higher pressures (up to 15,000 psi). UHPLC requires a chromatographic system that can operate at high pressures. Its current challenge is that not every lab has one. Often, if the lab does have one, it has not been properly qualified for GMP use. Pharmaceutical companies across the industry are challenged by labs that are developing UHPLC methods and cannot directly transfer these methods to receiving labs unless they too have a qualified UHPLC. In addition, not all UHPLC instruments perform to the same specifications, making transfer even more difficult as vendor-specific limitations can potentially cripple an analytical transfer.
Scaling methods from traditional LC to UHPLC has been the focus of many laboratories in recent years. Now, a new spin on the transfer has developed; can you transfer back from UHPLC to traditional LC systems? The potential to transfer UHPLC methods back to traditional LC platforms has two significant advantages: (1) it directly addresses the limitations in analytical method transfers in the pharmaceutical industry and (2) with the advent of quality by design (QbD) robustness studies, many labs are looking to run these lengthy investigations using fast UHPLC methods and then apply these robustness conclusions back to “transferrable” LC methods. The feasibility of transferring from UHPLC back to traditional LC methods will be discussed.
Introduction
Since the pioneering work of Jorgenson and co-workers (1,2), the use of sub 2 μm LC packings has generated much excitement in the analytical community. Liquid chromatography went from being thought of as a “mature” technique to one with vast new areas of exploration. The efficiency standard for chromatographic separations has long been the narrow peaks from gas chromatographic separations. Yet, liquid chromatographic separations ruled the marketplace not because of efficiency but through the ability to analyze nonvolatile analytes. Today, commercially available ultrahigh pressure liquid chromatography systems (UHPLC) routinely produce separations with peaks more narrow than GC peaks with run times as short as a minute.
With the introduction of the first commercial UHPLC system in 2005, pharmaceutical laboratories rushed to investigate if these high pressure systems would truly offer efficiencies that would result in a greater ability to resolve difficult to separate matrices. The systems were introduced because of their enhanced efficiencies, not solely for a reduction in mobile phases or analysis times. These benefits were welcome bonuses. Scientists looked to develop straightforward ways to convert existing validated 3um, 4.6 mm i.d. column methods to the new UHPLC standard.
The use of UHPLC enabled improved efficiencies in pharma (3-14) as well as in environmental (15-17) applications. Yet, UHPLC had one fundamental flaw in the eyes of many lab managers – it required new capital outlays to buy instrumentation capable of running at the required higher pressures (up to 15,000 psi). Was the return on investment (ROI) there? For many labs, the answer was initially “no,” but this is becoming less of an issue as companies turn over depreciated assets. It wasn’t that these efficiency gains were not attractive. The real issue in the pharmaceutical industry was that UHPLC did not have a clear path for method transfers in regulated laboratories. Simply put, UHPLC required a chromatographic system which could operate at high pressures and not every lab has one. Pharmaceutical companies across the industry were challenged by labs that were developing UHPLC methods which would not directly transfer to receiving labs unless they too had a qualified UHPLC.
Finally, variations in UHPLC specifications from vendor to vendor can complicate analytical transfers even further (14).
In 2007, an unexpected turn came for the industry with the introduction of superficially porous particles, typically at 2.5 μm. With these column packings, laboratories could achieve near UHPLC separations without needing the capital investment of new liquid chromatographs (18-22). The attractiveness of these columns was that they eliminated the need for capital investments in equipment to transfer methods globally.
Until recently, the market was at a stalemate. Since commercial systems can run UHPLC columns but the market was limited in that not every lab had them, transferring methods back to traditional LC systems has become an important tool in selling new instrumentation. Instrument vendors have turned to the consumer and pointed out the flexibility of their new systems. Systems are now routinely capable of running traditional and UHPLC columns. All separations benefit from the reduced volumes of the newer systems.
However, how do you transfer UHPLC to LC systems? Sun and Wrisley (23) proposed a computer modeling scheme to accomplish this. Transferring UHPLC methods back to traditional LC platforms potentially addresses analytical method transfer limitations within the industry as well as allows labs to perform QbD robustness studies using UHPLC methods and apply the conclusions back to LC methods.
Experimental
Instrumentation
The HPLC data reported was generated using traditional instrumentation equipped with a photodiode array detector or a multiple wavelength detector. UHPLC data reported was generated using a representative high-pressure system. Data was processed using an integrated chromatography data system.
LC Conditions/Samples
Mobile phases and LC conditions were consistent with reference 11. All target analytes and mobile phases were prepared with chemicals purchased from commercial supply houses. The LC columns used are listed in Table 1.
Table 1- LC Columns Used for scaling

Scaling Calculator
Scaling calculations were calculated using spreadsheets received from a chromatography solutions provider. The use of method translation calculators was recently reviewed by Majors (24).
Results and Discussion
Study
In order to investigate the scaling from UHPLC to HPLC, the authors decided to take an actual UHPLC separation from the literature containing nonproprietary pharmaceuticals and scale it to traditional HPLC column platforms. The separation used was from reference 11 and specifically contains compounds that vary in their chemical nature. This rational was intentional for in true pharmaceutical samples, method developers are challenged by the impurities from multistep chemical syntheses that are present. Often, the impurities that are the most challenging to separate from the matrix vary in chemistry from the main API. Most modeling software algorithms do not account for varying chemistries within the profile. In order to challenge the effectiveness of scaling calculations, the study needed to use the “same” stationary phase for all columns used in investigation. This assumption relies upon a manufacturer’ ability to produce columns with the same packing and coating efficiencies when scaling from 1.5 to 5 um particles. This assumption was addressed by selecting columns scaled under the same platform from a single column manufacturer (Table 1).
UHPLC separations were run using single high-pressure system as representative of this system platform. HPLC separations were executed on two HPLC systems representative of the traditional platform to provide a wide range of system dwell volumes; as commonly found in traditional HPLC systems. The original intent of this investigation was to evaluate sensitivity, selectivity and ability to assay impurities to 0.1%. The data demonstrated that sensitivity was not a significant issue in scaling when the quantitation limit is limited to 0.1%. This sensitivity was removed from the scope of the remainder of the studies.
Columns
The representative UHPLC column dimension of 50x2.0mm using a 1.5 μm particle size was chosen for this study. Using the same stationary phase, scaling the study profile was attempted using standard HPLC column dimensions of 250x4.6 mm with a 5 μm particle, 150x4.6 mm with a 3 μm particle and 150x3.0 mm with a 3 μm particle. The 3.0 mm column was chosen not only for its representation of narrow bore columns, but also because many fused core columns illustrate excellent efficiencies in this inner diameter dimension. A 53x7.0 mm with a 1.5 μm particle was investigated for this format allows the UHPLC particle to run on standard HPLC platforms without over pressurizing at 400 bar.
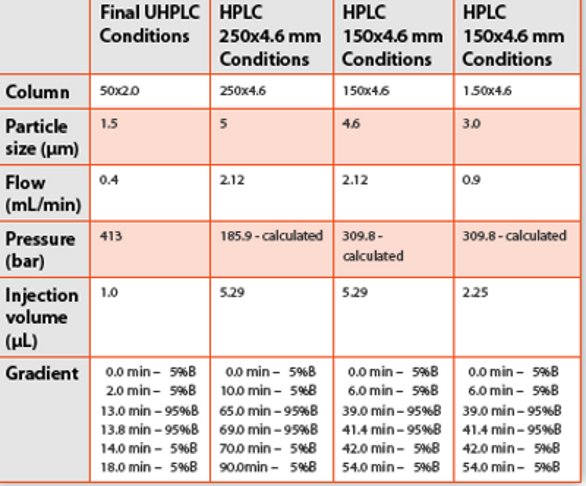
Table 2- Typical HPLC to UHPLC Conditions and Scaling

Scaling
Internet sites for many column manufacturers offer scaling calculators for their columns. These were all designed with scaling from HPLC to UHPLC in mind. The scaling calculator was chosen for its flexibility in scaling in any direction. Typically, the critical importance in scaling from UHPLC to HPLC instrumentation is not only the column length and particle size, but also the injection volume. (25-28) The scaling results in moving from a typical HPLC system to UHPLC are presented in Table 2. Nueue et al (28) recently showed that many separations can reversibly go from 5 μm, 15cm columns to 1.7 μm, 5 cm columns through column length and injection volume considerations and proposed that USP accept the equivalence of these methods. However, the authors here propose dramatic changes should not be made without maintaining the chromatographic profile and critical pair (29).
Typically for method scaling, the algorithms assume that:
- Injection volume is calculated by the ratio of the square of the column radius
- ½ ID for the second column gives ¼ cross section
- ¼ flow and 4 times more sensitivity
- Injecting the same volume as on column 1 your signal will increase by 4
- Scaling is linear, the ratio of column length and gradient time is constant
- ½ column length = ½ gradient time
- Pressure is calculated by the change of particle size and column length
- Double column length = 2 x pressure (linear relationship)
- ½ particle diameter = 4 x pressure (relationship by square)
- The influence of the flow cell is calculated by the ratio of the peak volume / flow cell volume
- To get optimal results the ratio should be at least 40
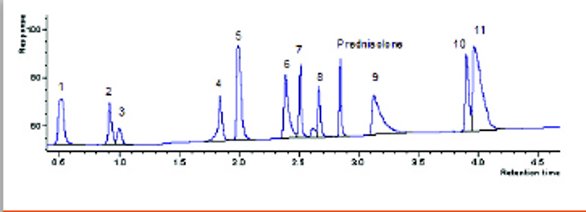
Figure 1- Representative UHPLC Profile. Analytes: (1) acetaminophen, (2) phenol, (3) benzyl alcohol, (4) salicylic acid, (5) pindolol, (6) quinidine, (7) acebutolol, (8) 3-methyl-4-nitrobenzoic acid, (9) triprolidine, (10) carvedilol, (11) nortripyline.
Table 3- Initial UHPLC Conditions and Scaling

Scaling from UHPLC
The representative UHPLC profile for this investigation is illustrated in Figure 1. The profile is a decent 4 minute separation except for the tailing and poor resolution at the end. The later peaks were intentionally left as is to investigate if the traditional column conditions could actually improve upon the separations. Direct scaling of the UHPLC conditions for moving this separation to a 150x4.6 mm, 3.0 μm column are presented in Table 3. An analyst does not need a trial run to know a 150x4.6mm, 3 μm column cannot operate on a traditional HPLC at 4.2 mL/min or 562.5 bar. The 27-minute run time would still be reasonable for most labs; but, in a strict GMP interpretation, the UHPLC conditions cannot be directly scaled to a HPLC platform.
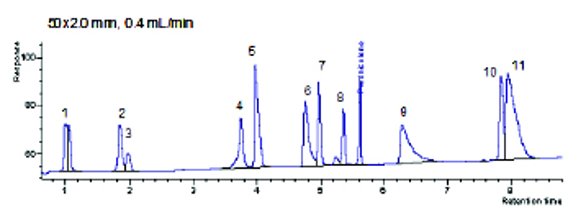
Figure 2- UHPLC Profile at 0.4 mL/min. Analytes: (1) acetaminophen, (2) phenol, (3) benzyl alcohol, (4) salicylic acid, (5) pindolol, (6) quinidine, (7) acebutolol, (8) 3-methyl-4-nitrobenzoic acid, (9) triprolidine, (10) carvedilol, (11) nortripyline
Table 4-UHPLC Conditions

The question remains, how could you scale this separation to a traditional HPLC platform? Secondly, once you did, would the profile remain the same? To scale this UHPLC separation, some trial and error is needed to lower the system pressure. Lowering the flow on the 50x2.0 mm, 1.5 μm column from 0.8 mL/min to 0.4 mL/ min should cut the pressure in half (375 bar) and within the limits of most traditional HPLC instruments (Table 4). Moving to 0.5 mL/min would yield a faster profile with a slightly higher pressure (469 bar). The actual pressure at 0.4 mL/min on the high-pressure system was 411 bar. Both the 0.5 and 0.4 mL/min scaling calculations project a pressure under 400 bar for the 150x4.6mm, 3 μm (384.8 and 308.3, respectively). However, in actual practice only the 0.4 mL/min flow equivalent (2.12 mL/min) could run on the traditional HPLC without going over pressure for this mobile phase and gradient. Thus, to scale the original UHPLC method, the 0.8 mL/min conditions had to be scaled to 0.4 mL/min, as shown in Table 4. As expected, the profile remained the same. (Figure 2) With the 0.4 mL/min UHPLC profile, a method that could be directly scaled to traditional HPLC instrumentation and columns was in place.
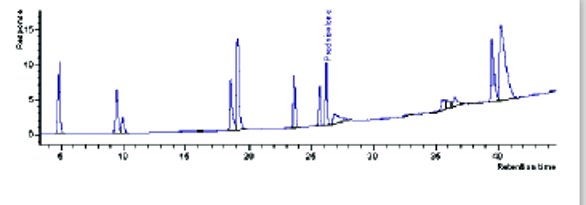
Figure 3- Scaled profile on 250x4.6, 5 μm column
Table 5-Scaled HPLC Conditions
Scaling UHPLC to 250x4.6, 5um Format
With the UHPLC parameters in place, the next step was to directly scale these conditions to HPLC. If this is possible under GMP criteria, the profile will not change. The scaling calculator results for traditional HPLC columns are listed in Table 5. The samples prepped for UHPLC were transferred to the HPLC system and after system equilibration, the scaled conditions were executed. In Figure 3, the resulting profile on the first traditional HPLC system is illustrated. This is not the same chromatographic profile as found on the UHPLC system. As the investigation is whether a UHPLC method could be directly scaled to HPLC for GMP, for this example the answer is clearly no. The missing peaks could be determined by mass spectrometry. However, this is outside the scope of this preliminary investigation. As a general rule, the loss of profile was more dramatic on the second traditional HPLC system than on the first. This is attributed to the increased system void volume on the second HPLC system.
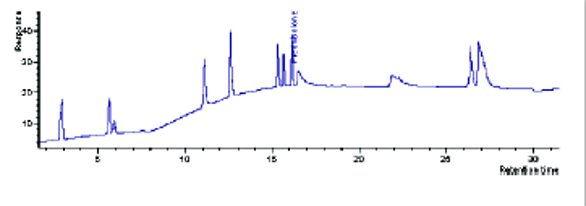
Figure 4-Scaled profile on 150x4.6, 3 μm column.
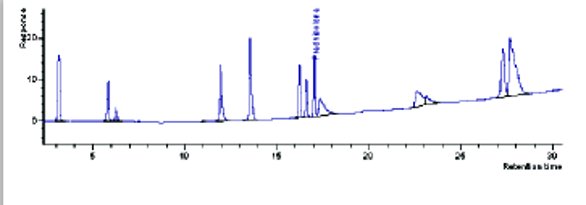
Figure 5-Scaled profile on 150x3.0, 3 μm column.
Scaling UHPLC to 150x4.6, 3um and 150 x 3.0, 3um Formats
In our laboratory, 3 μm columns are much more prevalent. It was hoped that scaling to this format (Table 5) would be more successful. As seen in Figure 4 (150x4.6) and Figure 5 (150x3.0), the 3μm column formats did not scale to the equivalent UHPLC profile either.
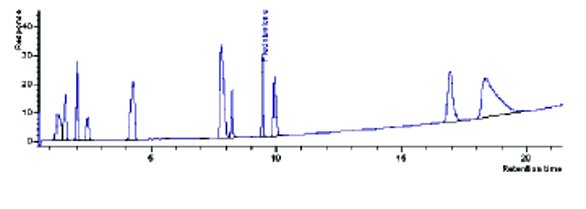
Figure 6-Scaled profile on 53x7.0, 1.5 μm column.
Scaling to 53x7.0, 1.5um Format
Finally, the authors looked at using the UHPLC 1.5 μm particle in a column format that a traditional HPLC could handle. The original 0.4 mL/min UHPLC scaling to the 53x7.0 column did not yield conditions the system could handle. This column format needed to use a 0.3 mL/min flow setting on a UHPLC to scale to a traditional HPLC. Using a 53x7.0 column, the final profile is illustrated in Figure 6. This column format yielded the weakest profile in regards to the UHPLC result. Typically, this column is used for cleaning investigations in our laboratory.
Gradient Delays
The scaling calculator used did not account for two instrument issues: (1) gradient delays and (2) flow cell volumes. To investigate whether gradient delays were the reason the traditional HPLC systems lost selectivity, each of the traditional column formats were run on the UHPLC system. This would cause the gradient delay to be the same in all column formats. While using the UHPLC system did improve the profile resulting from these columns, peaks were still missing. Flow cell volumes should effect sensitivity, not profile selectivity and was not further investigated.
UHPLC to HPLC Method Development
The results of this investigation do not preclude that you cannot scale from UHPLC directly to HPLC for any separation. The authors conclude from the profiles generated that simple separations should scale fine. Like with method development algorithms, separations with like chemistries should model and scale well. The key here is that direct scaling from UHPLC to HPLC should not be assumed to work without confirming the profile and critical pairs are maintained. Starting with your UHPLC separation, the analyst should
- optimize separation to UHPLC method with ~400 bar max pressure
- scale the UHPLC method to system using a suitable scaling calculator
- note the gradient, flow and injection volume changes needed for the HPLC systems
- confirm new method on HPLC system maintains pressure under 400 bar
- confirm that the profile, system figures of merit and critical pair selectivity all have been maintained.
Conclusion
For simple separations, direct scaling from HPLC to UHPLC or UHPLC back to HPLC has become rather straightforward in the calculations and conditions needed to maintain the chromatographic profile. However, as the separation becomes more complex, column scaling is more challenging in maintaining the original chromatographic profile. It cannot be assumed that direct scaling will accomplish suitable chromatographic results. When transferring a method from one GMP laboratory to another, standard protocols exist to ensure the method is operating the same in both laboratories. This should be no less of criteria for method scaling.
Moving from UHPLC back to HPLC runs the risk of increased run time, wasted time in longer gradients, potential loss of selectivity and sensitivity. The GMP transferring and receiving laboratory needs to manage this risk to ensure the integrity of the quality system is maintained.
Acknowledgements
The authors would like to thank T.F. Cullen for data suggestions; M. Frymann, J. Maier-Rosenkranz and M.Early for discussions regarding the scaling calculator and T. Maloney for helpful UHPLC discussions.
References
- J.E. MacNair, K.C. Lewis and J.W. Jorgenson, Anal. Chem. 69 (1997) 983-989.
- J.E. MacNair, K.D. Patel and J.W. Jorgenson, Anal. Chem 71 (1999) 700-708.
- L. Tolley, J.W. Jorgenson, and M.A. Moseley, Anal. Chem 73 (2001) 2985-2991.
- L. Novakova, L. Matysova, and P. Solich, Talanta 68 (2006) 908-918.
- S.AC. Wren and P. Tchelitcheff, J. Pharm Biomed. Anal 40 (2006) 571-580.
- S.AC. Wren and P. Tchelitcheff, J. Chromatogr A. 1119 (2006) 140-146.
- G. Wang, Y. Hsieh, X. Cui, K.C. Cheng and W.A. Korfmacher, Rapid Commun. Mass Spectrom 20 (2006) 2215-2221.
- L.G. Apollonio, I.R. Whittall, D.J. Pianca, J.M. Kyd and W.A. Maher, Rapid Commun. Mass Spectrom 20 (2006) 2259-2264.
- H. Kawanishi, T. Toyo’oka, K. Ito, M. Maeda et al., J. Chromatogr A 1132 (2006) 148-156.
- K.A. Johnson and R. Plumb, J. Pharm. Biomed. Anal 39 (2005) 805-810.
- I. Baranowska and B. Kowalski, Water Air Soil Pollut 211, (2010) 417-425.
- C.J Messina, E.S. Grumbach and D.M. Diehl, LCGC 25 (2007) 1042-1049.
- I. Baranowska, A. Wilczek and J. Baranowski, Analytical Sciences 26 (2010) 755-759.
- A. Subasranjan, C. Srinivasulu and R Hemant, Drug Testing and Analysis 2 (2010) 107-112.
- M. Mezcua, A. Aguera, J.L. Lliberia, and M.A. Cortes et al., J. Chromatogr. A 1109 (2006) 222-227.
- C.C. Leandro, P. Hancock, R.J. Fussell and B.J. Keeley J. Chromatogr. A. 1103 (2006) 94-101.
- M. Ventura, D. Guillen, I. Anaya, and F. Broto-Puig et al., Rapid Commun. Mass Spectrom 20 (2006) 3199 -3204.
- J.M. Cunliffe and T.D. Maloney, J. Sep. Sci. 30 (2007) 3104-3109.
- N. Wu, J.A. Lippert and M.L. Lee, J. Chromatogr. A 911 (2001) 1-12.
- J.A. Anspach, T.D. Maloney, R.W. Brice and L.A. Colon, Anal. Chem 77 (2005) 7489-7497.
- S.A. Wren, J. Pharm. Biomed. Anal 38 (2005) 337-343.
- J.M. Cunliffe, S.B. Adams-Hall and T.D. Maloney, J. Sep. Sci 30 (2007) 1214-1223.
- X.Sun and L. Wrisley, American Pharmaceutical Review, December (2009) 26-32.
- R.E. Majors, LC-GC 29 (2011) 476-484.
- D. Guillarme, D.T.T. Nguyen, S. Rudaz and J.L. Veuthey, Eur. J. Pharm. Sci 66 (2007) 475–482.
- D. Guillarme, D.T.T. Nguyen, S. Rudaz, and J.L. Veuthey, Eur. J. Pharm. Biopharm 68 (2008) 430-440.
- M.M. Dittmann, “Approaches Towards Method Compatibility Between HPLC and UHPLC Systems”, Paper 1970-6, Pittsburgh Conference & Exposition on Analytical Chemistry and Applied Spectroscopy, March 2010, Orlando.
- U.D. Neue, D. McCabe, V. Ramesh, H. Pappa and J. DeMith, Pharmacopeial Forum 35 (2009) 1622 –1626
- G.K. Webster and C.L. Basel, LCGC 21 (2003) 286-294.
Author Biographies
Gregory Webster is a Sr. Principle Research Scientist in Global Pharmaceutical Sciences at Abbott Laboratories. Dr. Webster received his Ph.D. in analytical chemistry at Northern Illinois University in 1991. In addition, Dr. Webster has a MBA from the Keller Graduate School of Management and Project Management Professional (PMP) certification from the Project Management Institute. Prior to joining Abbott in 2007, he worked at Alpharma, Chemsyn Laboratories, Bayer Corporation, Pfizer Global Manufacturing and Pfizer Global Research and Development. Dr. Webster is currently an adjunct lecturer at Governors State University and was a Visiting Scientist with the Sensor Research Group at the Illinois Institute of Technology from 2005-07.
Ashley Elliott is currently an Analyst in Nutritional Chemistry and Food Safety at Covance Inc. Previously, Ms. Elliott worked as an analyst in Global Pharmaceutical Sciences at Abbott Laboratories after obtaining her M.S. in Chemistry from Eastern Illinois University in 2009.
This article was printed in the July/August 2011 issue of American Pharmaceutical Review - Volume 14, Issue 5. Copyright rests with the publisher. For more information about American Pharmaceutical Review and to read similar articles, visit www.americanpharmaceuticalreview.com and subscribe for free.