Abstract
Development of freeze-dried products can be a laborious and costly process. If knowledge of the critical processing parameters can be obtained, then formulations can be optimized to give the best possible stability, while simultaneously freeze drying protocols can be shortened to reduce costs. In this article, the use of the traditional techniques that indirectly determine the collapse temperature will be reviewed, namely differential scanning calorimetry (DSC) and modulated temperature DSC (MTDSC). Two newer techniques for probing the collapse phenomenon will also be discussed; these are freeze drying microscopy (FDM), which allows visual observation of the collapse phenomenon directly and Raman microscopy, which offers information about changes associated with crystallization and polymorphic form.
Key Thermal Transitions in the Frozen State (Tg’ and Collapse) and Their Determination
Every formulation that is going to be freeze-dried will possess a key temperature, the collapse temperature, often denoted Tc, which it is essential not to cross during freeze-drying [1,2]. Therefore, it is important to maintain the temperature below this until the product is completely dried. However, maintaining the product too far below this temperature will lead to the drying process becoming unacceptably slow, since the kinetics of the drying process are temperature-dependent. Therefore, it is valuable to know this critical temperature for a formulation prior to freeze-drying, in order that suitable conditions can be adopted for its successful and safe processing in a reasonable timeframe. For a crystalline (eutectic) system, the critical temperature will typically be its eutectic melting temperature (Te) [3,4] and exceeding this temperature will cause the material to melt during processing. However, most lyophilized formulations will contain an amorphous phase and for these the Tc corresponds to the temperature at which the material softens to the point of not being able to support its own structure and begins to flow [5]. Crossing Tc may result in incomplete drying, poor product appearance and stability and also difficulties associated with reconstitution. Tc is slightly higher than the frozen product glass transition (generally abbreviated to Tg’ although strictly this refers to a frozen solution in its maximally concentrated composition). For commonly used disaccharides such as sucrose and trehalose, Tc is assumed to be ~ 5 oC higher than the Tg’ determined by thermal analysis although the exact interval between Tg’ and Tc is formulation dependent; changing the type of excipient and the ratio of excipient to active, especially for proteinaceous materials can have a large effect on this relationship.
Introduction to Differential Scanning Calorimetry (DSC) and Modulated Temperature DSC (MTDSC)
DSC is widely used in the pharmaceutical laboratory in order to determine purity and identities of materials. The technique involves measuring the effect of temperature perturbation on the heat flow in or out of a sample compared with an inert reference. The heat flow (dQ/dt or power, P) is described in terms of the applied heating rate as follows;
Equation 1 P = dQ/dt = Cp ∙ dT/dt + f(t,T)
Cp is the heat capacity, dT/dt is the applied heating or cooling rate and f (t, T) is the heat flow from kinetic processes. This equation shows that the heat flow is a function of both the temperature perturbation and of the absolute temperature. Data are presented in the form of a thermal analysis curve, depicting change in heat flow against temperature.
Freeze-dried products are often in the amorphous form and will therefore exhibit a characteristic glass transition, Tg. These values can be measured using DSC where Tg values are specified as the temperature of half vitrification on cooling, which is the temperature at which the heat capacity is halfway between that of the liquid and glassy states [6]. The value of the Tg is also dependent on the scanning rate, which can give rise to discrepancies in values determined between laboratories [7]. This issue may be overcome by determining the fictive temperature, Tf, which is independent of heating rate.
Because the Cp change at the Tg is often small and accompanied by an endothermic relaxation, it can often be mistaken for a melting transition. This problem can be solved by the use of MTDSC, which is a modification of DSC, in which a modulation is superimposed onto the linear heat ramp [8]. Deconvolution is applied to the data to obtain the underlying linear and modulated responses. This added information makes it possible to measure Cp data as a direct output from the experiment. In order for this procedure to be valid, it is assumed that the temperature excursions from the underlying heating rate are small so that the response of the rate of the process being analyzed is approximately linear. In order to prevent artifacts arising in the data produced, at least six modulations are required to take place during the course of one thermal event, which requires low heating rates, typically 2 oC/min. Comparison of the modulated component of the heat flow out of the sample with the heating rate applied to it allows the Cp to be determined. When heating through a Tg, the resultant increase in Cp causes an increase in amplitude of the modulated heat flow output. Transitions that appear in the reversing signal are thermodynamically reversible at the time and temperature at which they are detected. All other events will appear in the non-reversing signal, which is calculated by subtraction of the reversing signal from the total heat flow. MTDSC is especially useful for the measurement of small Tg or Tg’ because the deconvolution procedure removes the accompanying endothermic relaxation (which appears in the non-reversing signal) to give the heat capacity change only in the reversing signal.
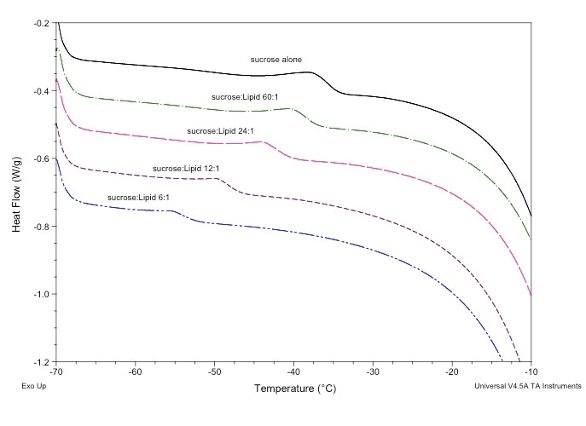
Figure 1 - DSC Data showing Tg’ values for sucrose:liposome formulations with varying sucrose:lipid ratios.
Tg’ is affected by the nature of the formulation and the ratio of the excipients to active, therefore a “one size fits all” freeze drying protocol is not possible. E.g. changing the ratio of excipient to active vaccine component or changing the nature of the excipient can both drastically affect the Tg’ and hence collapse and ultimately the success of a freeze dried product. This effect is very pronounced when freeze-drying liposomal formulations where changing the ratio of disaccharide to lipid has a very large impact on Tg’ (Figure 1); Ugwu et al (2005) investigated the preparation, characterization, and stability of lyophilized liposomebased formulations of mitoxantrone [9]. They used DSC to characterize the Tg’ of various ratios of disaccharide (either sucrose or trehalose) to lipid and found that increasing the molar ratio of sucrose:lipid from 5:1 to 10:1 had the effect of raising the Tg’ from -47.7 to -37.6 oC. The liposomes in that study were composed of dioleoylphosphocholine (DOPC), cholesterol, and cardiolipin. Earlier this year double Tg’ values were reported for a number of phosphatidylcholine species including DOPC; -95 and -20 oC respectively [10]. The authors hypothesized that since annealing resulted in endothermic relaxation vents accompanying both transitions that they are both glass transition events and that existence of two Tg’ values may indicate coexistence of two phases, although they acknowledged the possibility that the lower value might be associated with the amorphous water trapped in the interbilayer region this would seem unlikely given the very low concentration of water in this region.
Introduction to Freeze-drying Microscopy
Temperature controlled microscopy (also known as hot stage microscopy) is often used in the pharmaceutical industry to characterize new drug substances and can be particularly useful in observing generation different polymorphic forms of a material during temperature ranges that might be anticipated during processing. FDM is a modification of temperature controlled microscopy in which the sealed temperature controlled stage is connected to a vacuum pump in order to generate a low pressure system. Systems available today are sophisticated and use liquid nitrogen to generate the low temperatures and generally include a Pirani gauge in order to measure and control the vacuum level in conjunction with a PC, which also controls the temperature and collects experimental data; temperature, pressure and crucially images acquired during the experiment. FDM allows the freeze-drying scientist to observe the gross structural changes associated with collapse. With programmable systems the sample is loaded into the FDM stage then follows a pre-determined temperature profile, e.g. freezing then reduction in pressure followed by a heat cool cycle around the temperature region of interest. In order to ease identification of the collapse temperature, images can be processed into movies or viewed by plotting the temperature profile against time and then viewing the images associated with the temperature of interest by clicking onto the correct area of the plot.

Figure 2 - FDM Images showing (left) onset of collapse of a 2% raffinose solution at -24.1oC (right) complete structural collapse of the same sample at -21.4oC
For example, Figure 2 shows images taken of a sample of 2% raffinose solution. The dark lower band in the image on the left shows the freeze-drying front while the material above this remains frozen. The distinctive structure of ice crystals within the matrix can clearly be seen. The material is drying from the bottom toward the top of the image and the onset of collapse can be seen as an interface between the freeze-dried and frozen material. In the image on the right the temperature is even further above the critical collapse temperature for this formulation and this is manifested as loss of structure and a “spider web” type appearance. Note that the freeze dried region of the sample that was visible in the sample on the left still remains in tact. Sometimes microcollapse can also be observed, as reported by Abdelwahed et al (2006) in their paper concerning the freeze drying of poly(caprolactone) nanocapsules [11].
Annealing is the practice of adding a step into the lyophilization protocol prior to lowering the vapor pressure in order to deliberately let one component of the formulation crystallize. For example, increasing the size of ice crystals will increase pore size and thus aid secondary drying, while allowing mannitol to crystallize can change the collapse temperature and also add strength to the product structure. FDM can also used to examine whether annealing might be a useful step in the freeze-drying protocol since changes in crystal size can be observed using FDM.

Figure 3 - FDM Images obtained using polarized light and DIC of a pharmaceutical formulation containing protein and mannitol. Temperatures are a) ambient (before freezing) b) after freezing to -30 oC c) after warming to -25 oC d) after warming to -5 oC
The use of polarized light and differential interference contrast can also be an aid to visualization of structural changes. In Figure 3 below the effect of increasing temperature on the crystallization of mannitol within this protein formulation can clearly be seen.
Zhai et al (2003) used FDM to determine primary drying rates during lyophilization and found that were able to determine diffusion rates of water vapour through the dried cake formed by the sublimation of water from frozen samples of citrate and tris–HCl buffers [12]. Meister & Gieseler investigated the correlation between Tg temperatures determined by DSC and Tc determined by FDM for model proteins with either sucrose or trehalose and found and that at low protein concentrations midpoint Tg data showed good agreement with Tc values but that there were larger discrepancies between FDM and DSC data at higher protein concentrations [13]. This effect of protein concentration on differences between Tg’ values determined by DSC and collapse temperatures visualized using FDM have also been observed in other systems, e.g. monoclonal antibodies [14]. More recently Kadoya et al used FDM to compare Tc and Tg’ values for sugar alcohols [15]. It should not be surprising that results obtained from DSC (or MTSC) and FDM are not in closer agreement since determination of Tc using FDM takes place during a dynamic drying process and is a visualization of the collapse process, while in DSC the measured Tg’ is as a result of change in Cp and the only changes in pressure will be those caused by changes in vapor pressure above the frozen sample as it is heated.
Introduction to Raman Spectroscopy and Microscopy
Raman microscopy is a spectroscopic imaging technique in which a laser is used to irradiate a sample with monochromatic light. A small amount of this light is inelastically scattered with a frequency shift that is characteristic of the chemical bonds or molecules present in the material. This scattering gives rise to Raman spectra [16]. In Raman microscopy, Raman spectroscopy is coupled with an optical microscope. By carefully choosing the imaging conditions such as the laser, objective lens and confocal hole diameter, the spatial and depth resolution can be controlled at the micron level. This therefore allows the investigation of the location of species within a sample and to observe how these materials behave over time. The technique has been used to look at a range of pharmaceutical systems [17,18]. Temperature controlled Raman microscopy (TRM) uses the same equipment as Raman microscopy but also includes the determination of the effect of temperature perturbation. TRM has been used to investigate the effect of annealing on the crystallization of mannitol in frozen solutions. It was possible to see the location of both β and δ polymorphic forms within the structure of the frozen material and to observe the growth of a crystalline band of mannitol that thickened upon annealing (Figure 4). This suggests that the technique has potential for studying other crystallization processes, with particular advantage for frozen systems [19].
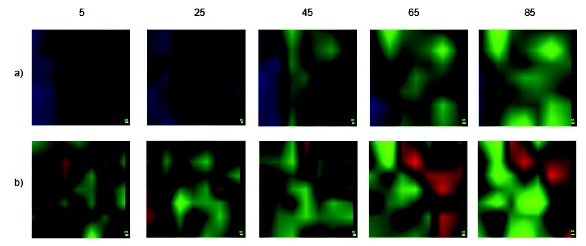
Figure 4 - Raman microscopy images of frozen mannitol solutions depicting change in polymorphic form a) top row shows effect of time on ice and mannitol distribution (blue represents ice and green represents mannitol b) bottom row shows effect of time on polymorphic form of mannitol present red represents the δ form while green represents the β form. Numbers across the top represent the time (In minutes) that the sample has been held at -30 oC.
Xie et al (2008) demonstrated the applicability of the use of a Raman method in the monitoring and hence control of mannitol polymorphic forms in the lyophilized drug products during formulation and process development [20].
There has also been some interest in the use of Raman spectroscopy as a PAT method in conjunction with NIR Spectroscopy for in-line monitoring of the lyophilization process [21]. Raman and NIR probes were built into the freeze dryer chamber in order to non-invasively probe the polymorphic form of mannitol during a freeze-drying process. Raman spectroscopy was able to monitor the mannitol solid state (amorphous, the various crystalline forms as well as the presence of the hemihydrate) and some key points during the freeze drying process such as the point at which all of the mannitol had crystallized during freezing the onset of ice sublimation.
Analysis of Freeze-dried Products
Since many, if not most, lyophilized products are in the amorphous form, they will exhibit a product Tg, which can be easily determined using DSC or MTDSC. In addition, for some formulations, extra structural information can be obtained from a DSC analysis of a product, for example melting transitions of liposomes [22] and denaturation transitions of proteins can be measured and changes in value can indicate whether a particular protectant is exhibiting a useful interaction in maintaining structural integrity. Raman spectroscopy can also be used to determine the effects of drying on the integrity of active pharmaceuticals, biomaterials and even tissues. For example Borgognoni et al (2009) used Raman spectroscopy to examine the effects of freezing rate on the secondary structure of bovine pericardium tissue, which is widely used for heart valve replacement [23]. They found that the Amide I band in the Raman spectrum for the freeze-dried tissue showed significant differences in intensity depending on which freezing protocols has been used during the freeze-drying process. Although FDM was not helpful for this material, probably because of the strong structural characteristics of the tissue, DSC measurements enabled the group to determine both a Tg’ for the tissue and the temperature at which ice within the tissue began to melt upon further warming. Thus the Raman data when analysed in conjunction with the DSC data enabled them to select the best lyophilization method for this material.
Summary/Conclusion
There are a range of thermal analysis and microscopy techniques available to the lyophilization formulation scientist that can be of use in both designing freeze-drying protocols and examining the effect of lyophilization on the structural integrity of the final freeze-dried product. Care must be taken when extrapolating Tc data from Tg’ data determined by DSC while small-scale microscopy techniques may not give results exactly comparable to those in a freeze-drying vial in an industrial dryer. Nonetheless, when used appropriately these tools offer considerable advantage in determining both the effects of formulation variables and temperature on the performance of the product undergoing lyophilization.
Non-invasive Raman probes and more commonly Raman microscopy offer the possibility of tracking changes in form such as formation of hydrates; amorphous to crystalline transitions, changes in polymorphic form and structural integrity of the API.
References
- Pikal, M.J. and S. Shah, (1990) Int. J. Pharm. 62: 165-186.
- Roos, Y.H., (1997) J. Therm. Anal., 48: 535-544.
- Roberts, C.J., Franks, F., (1996) J. Chem. Soc. Faraday trans., 92: 1337-1343.
- Williams, N.A., Dean, T., (1991) J. Parent. Sci. Technol., 1991. 45: p. 94-100.
- Franks, F. Auffret, T., (2008) Chapter 9 in “Freeze-Drying of Pharmaceutical and Biopharmaceuticals; Principles and Practice” RSC Publishing, Cambridge, UK.
- Wünderlich, B., Thermal Analysis. 1990, London: Academic Press
- Richardson, M.J., Savill, N.G. (1979) Brit. Polym. J. 11. 123-129.
- Reading, M. (1993) Trends in Polymer Science. 1: 248-253.
- Ugwu S., Zhang A., Parmar M., Miller B., Sardone T., Peikov V., Ahmad I. (2005) Drug Dev. Ind. Pharm. 31:223 -229
- Shalaev, E.Y., Zografi, G., Steponkus, P.L. (2010) J.Phys. Chem. B 114: 3526-3533.
- Abdelwahed, W., Degobert, G., Fessi, H. (2006) Int. J. Pharm. 309: 178–188
- Zhai, S., Taylor, R., Sanches, R., Slater, N.K.H. (2003) Chem. Eng. Sci. 58: 2313-2323.
- Meister, E., Gieseler, H. (2009) J. Pharm. Sci. 98 (9). 3072-87.
- Colandene, J.D., Maldonado, L.M., Creagh, A.T., Vrettos, J.T., Goad, K.G., Spitznagel, T.M., (2007) J. Pharm. Sci. 96: 1598-1608
- Kadoya S., Fujii K., Izutsu K., Yonemochi E., Terada K., Yomota C., Kawanishi T. Int J Pharm. (2010) 389(1-2):107-13.
- Raman, C.V., Indian J. Phys. 2 (1928) 387.
- Andrew, J.J., Browne, M.A., Clark, I.E., Hancewicz, T.M., Millichope, A.J., Appl. Spectrosc. 52 (1998) 790–796.
- Zhang, L., Henson, M.J. , Sekulic, S.S. (2005) Anal. Chim. Acta 545 262–278.
Author Biographies
Vicky Kett received her PhD on the use of thermal analysis in the investigation of freeze-dried systems from the School of Pharmacy, University of London before joining the academic staff at The Queen’s University of Belfast as a lecturer in 2001. Her research is largely directed in the area of thermal analysis especially applied to freeze-dried systems. She has given many invited presentations on this work internationally and in 2002 she won the Royal Society of Chemistry Thermal Methods Group Cyril Keattch Young Scientist award for her work on MTDSC of freeze-dried systems.