Introduction
Since the publication of the Food and Drug Administration (FDA) Process Analytical Technology (PAT) guideline: A framework for innovative development, Manufacturing, and Quality Assurance [1], pharmaceutical companies have undertaken efforts to improve product quality through increased process understanding and in-process controls rather than solely relying on end-product testing [2,3]. These controls are designed in a holistic manner by embodying the ICH Q8, 9 and 10 documents [4-6], which incorporate risk and quality by design (QbD) into the development program. An assessment of the critical quality attributes (CQAs) of materials and processes [2,3,7] leads to the correct attributes being measured. Near-infrared (NIR) and Raman spectroscopies are promising analytical approaches for the timely monitoring of processes and the implementation of PAT [3,7-10]. They have the potential to be interfaced in several production processes and, due to their fast and non-invasive nature, provide real-time data. In this study, we present an overview of the implementation of on-line NIR and Raman instrumentation to monitor CQAs during the manufacturing process of a pharmaceutical product.

Figure 1 - Unit operations and PAT monitoring tools implemented during the manufacturing process of a product
Figure 1 gives a process flow chart of the unit operations and the particular monitoring technique implemented. NIR is used for monitoring the blending uniformity (BU) of the active pharmaceutical ingredient (API) and excipients in two mixing operations prior to wet granulation. Blend uniformity is a CQA since a homogeneous blend is required in order to obtain a dosage unit with uniform active content at the target level. On-line NIR was implemented during blending to determine the number of revolutions required to achieve blend uniformity, without having to manually remove samples from the bin for subsequent analysis by traditional methods (such as UV/vis spectroscopy or high performance liquid chromatography (HPLC)). On-line NIR monitoring avoids the use of thief probes that could potentially introduce contamination and segregation [8,9].
In the subsequent unit operation, on-line Raman spectroscopy is used during wet granulation to monitor an API form conversion. The API undergoes a water-mediated phase transformation from the intermediate Form 1 to the final form, Form 2. In general, the chemical and physical properties of different polymorphs can have a significant impact on the manufacture and performance of the final product [11]. It is known that a complete, reproducible, and consistent API form conversion is essential to ensure satisfactory in-vitro dissolution and in-vivo bioavailability of the tablets. Since complete form conversion is a CQA, form conversion is monitored for every batch.
Finally, the residual water content of the granules postgranulation is a CQA which can influence the stability of the API, and can affect the granule compactibility. In addition, subsequent processing steps like blending and tabletting can be affected by the residual moisture content and its impact on granulation properties. While moisture determination is used to control the drying cycle, it is traditionally performed with Karl Fischer titration or loss on drying (LOD) on thief samples. These traditional methods require sample withdrawal and external analysis which require operator intervention and time. Since traditional moisture determination is time consuming and obtrusive to the process it is beneficial to find alternative methods to replace these tests. NIR spectroscopy is a suitable method for the in-line determination of moisture in dried powders or granules. The NIR spectrum of water contains two major absorption bands at around 1940 nm (5155 cm-1) and 1450 nm (6895 cm-1), making this technique selective enough to allow a sensitive determination of moisture content. Granule moisture can be recorded continuously by NIR, throughout the drying process [12,13]. On-line NIR was implemented during fluid bed drying to ensure an exact end-point determination of the drying process. Experimental details on the implementation of each PAT tool are given below.
Experimental Details
Monitoring of Blending Homogeneity by NIR
Blend uniformity was monitored by NIR during two mixing operations, preblend 1 (PB1) and preblend 2 (PB2). In PB1, a portion of API and lubricant was added to the bin and the bin was rotated for 10 min at 25 rev/min for a total of 250 revolutions. In PB2, the rest of the API and all other intragranular excipients (filler, disintegrant 1, and desintegrant 2) were added and blended for 5 min at 25 rev/ min, for a total of 125 revolutions. The type and geometry of the bin, the order of addition, the mixer load level and the number of rotations (time and speed) were kept constant for all batches. The NIR data was acquired with an acousto-optical tunable-filter (AOTF) NIR analyzer in the 1100 nm to 2300 nm region (2 nm resolution, 15 scans).
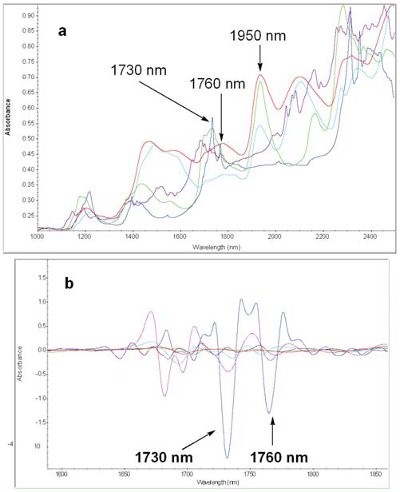
Figure 2 - a. NIR spectra of pure components in PB2 (blue: lubricant, purple: API, red: disintegrant 1, green:,disintegrant 2 light blue: filler). b. Second derivative, Savitzky-Golay 19 points 3rd polynomial of components in PB2 (blue: lubricant).
Figure 2 shows the NIR spectra (a) and second derivative spectra (b) of API and components in PB2. The second derivative spectra of the lubricant shows characteristic peaks at 1394 nm, 1730 nm, 1760 nm, 2300 nm and 2350 nm, and the API shows characteristic peaks at 2040 nm, 2060 nm, 2085 nm.
Table 1 - Component correlation for PB2
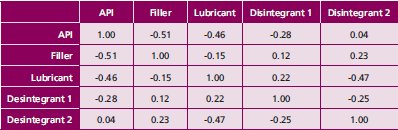
Quantitative partial least squares (PLS1) multivariate calibration models were developed to predict the % API and % lubricant during blending. The general methodology used during development of the NIR method started with a set of off-line calibration standards with varied API content spanning the range of expected analysis (80 to 95% for PB1 and 60 to 91% for PB2). Experimental designs (DoEs) for PB1 and PB2 covered a wide range of concentrations for both API and the lubricant. Since PB1 is a binary mixture, the calibration standards were correlated in terms of component concentration. For PB2 a randomized design, where the four major excipients were varied randomly with respect to API was employed. Component correlation was minimized to ensure that the PLS solution was specific to the analyte of interest (as seen in Table 1).

Figure 3 - a. Concentration correlation plots of predicted versus reference API (a) and lubricant (b) concentrations for PB1 and optimal PLS model parameters.
Concentration correlation plots of predicted versus reference API and lubricant concentrations for PB1, and optimal PLS model parameters are shown in Figure 3. The PLS models performance were evaluated by examination of the root-mean standard error of calibration (RMSEC) and root-mean squared standard error of cross validation (RMSECV). For each model one factor was used to model the concentration, as expected since the sample is a simple binary mixture.
The theoretical API and the lubricant content in PB1 are approximately 91% and 9% by weight, respectively. The theoretical API and lubricant content in PB2 are 80% and 4% by weight, respectively. Three batches of API with different properties (particle size and cohesiveness) were blended with the same batch of lubricant, to correlate the APIs quality attributes to process performance.
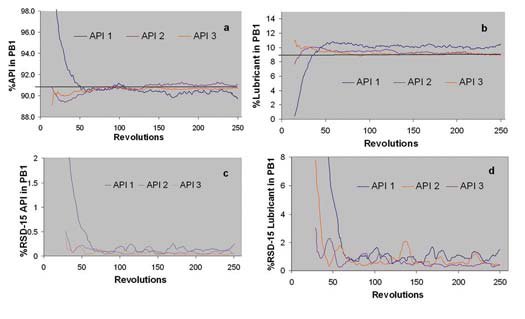
Figure 4 - a. Blending profiles (change in concentration vs. bin blender revolutions) of three different APIs during preblend 1 (PB1). a. %API vs. revolutions, b % lubricant vs. revolutions, c. %RSD-15 of API vs. revolutions, d. %RSD-15 of lubricant vs. revolutions
API 1 has significant higher particle size and cohesiveness compared to APIs 2 and 3. APIs 2 and 3 have similar particle size and cohesiveness. As seen in Figures 4a and 4b, API 1 shows a different mixing profile compared to APIs 2 and 3. Large changes in concentration are observed in the first 50 revolutions of the blending cycle. Also the lubricant takes longer time to reach homogeneity when blended with API 1. Homogeneity is indicated as a plateau in the blending profile. Although there are significant differences in blending at the beginning of the blending cycle, all APIs reach homogeneity at the end of the mixing period (250 revolutions). Figures 4 c and 4d show the standard deviation moving block (15 points size block) of the %API and %lubricant (respectively). %RSD is below 0.3% for the API and 2% for lubricant after 150 revolutions.

Figure 5 - Blending profiles (change in concentration vs. bin blender revolutions) of three different APIs during preblend 2 (PB2). a. %API vs. revolutions, b % lubricant vs. revolutions, c. %RSD-15 of API vs. revolutions, d. %RSD-15 of lubricant vs. revolutions
Figures 5a and 5b, show the blending profiles of the different APIs during PB2. Figures 5c and 5 d show the standard deviation moving block (15 points size block) of the %API and %lubricant (respectively) in PB2. %RSD for API and lubricant are higher in PB2 compared to PB1 during the entire blending cycle. This may reflect the fact that more excipients are added in PB2, and more interference is accounted for in the model. Homogeneity is reached at around 80 revolutions for all APIs.
Monitoring of API Form Conversion (from Form 1 to Form 2) by Raman during Wet Granulation
High shear wet granulation (HSWG) is used to convert Form 1 to Form 2 and a complete form conversion of API is a critical process parameter. On-line Raman was used to study the effect of process parameters during wet granulation on the performance of the API such as the optimal water range and amount of binder required for complete form conversion. Form 1 has a characteristic Raman peak at 971 cm-1 and Form 2 at 959 cm-1.
A non contact Raman probe provided with a 785 nm excitation source was used to monitor the decrease in the intensity of the peak corresponding to Form 1 and the increase in the intensity of the peak corresponding to Form 2. Data was normalized by a peak at 991.5-1019.8 cm-1. There is no interference from the lubricant or disintegrants in this spectral range. Impeller speed, chopper speed, and binder addition rate were kept constant for all the batches.
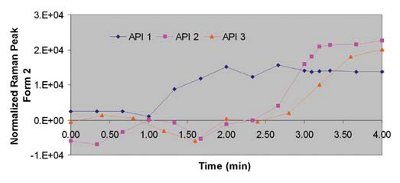
Figure 6 - Increase of Form 2 vs. wet granulation time: API 1 (blue), API 2 (pink) and API 3 (orange).
Figure 6 shows plots of the increase of intensity of the Raman signal corresponding to Form 2 during wet granulation for the same three APIs previously described. As previously observed during the blending operation, API 3 also behaves differently during wet granulation. For this API, form conversion start occurring a minute before than the other APIs, but the rate of conversion (slopes in Figure 6) is lower than API 1 and 2. The effect of different conversion rates and onsets on the wet granulation process and quality attributes of the final product is under investigation.
Monitoring of Drying Profile and Drying End-point by NIR during Fluid Bed Drying
For this unit operation, the wet granules from the wet granulation process are transferred to a fluid-bed dryer. The fluid bed drying is a short process, taking ~20 minutes and it is critical to the product quality that the moisture levels at the end of drying is between 3 and 4 % w/w. NIR has the capability of measuring water with such accuracy, so an NIR probe was placed against a quartz sight-glass of the fluid bed dryer at the same height of the system integrated sampling probe. Wet granules are often found to stick to sight glass rendering analysis through the glass problematic; however this product was found to pose no such problem.
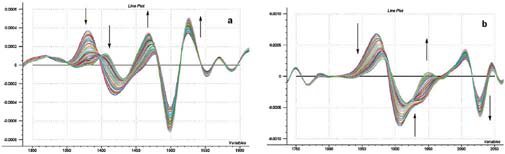
Figure 7 - Preprocessed (2nd derivative, Savitzky-Golay, 19 points) spectra of the drying granules during one fluid-bed drying experiment a. 1300 to 1600 nm region, b. 1750 to 2050 region.

Figure 8 - (a) NIR Calibration curve for NIR moisture determination of predicted vs. reference water content (LOD values) and the optimal PLS model parameters.
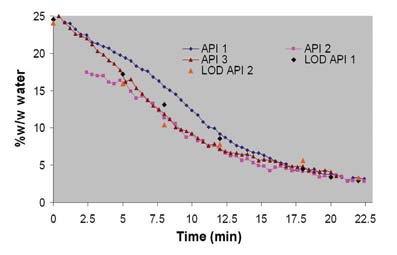
Figure 9 - Calculated fluid bed drying profiles.
In Fig. 7 spectra collected during the fluid-bed drying experiment are shown. The spectra were collected every 20 s and therefore represent the fluid bed drying process; starting with wet granules to fully dry granules (in the direction shown by the arrows in Figure 6). 32 individual scans were co-added for each data-point, over the wavelength region of 1100 and 2200 nm, with a resolution of 2 nm. During drying granules were sampled every 3 to 5 minutes. The primary reference value for the water content of the sampled granules was determined by loss on drying. Spectra were transformed to second derivative spectra followed by Savitzky-Golay smoothing prior to PLS regression analysis.
Figure 8 shows the PLS correlation plot of predicted versus reference water content (LOD values) and the optimal PLS model parameters. Figure 9 shows typical fluid bed drying features observed.
Two typical fluid bed drying features are observed, heat transfer limited (water evaporation from particles) and diffusion limited (water diffusion from granules). Although differences were observed during the blending and granulation of API 3, the drying profiles of the three APIs are similar at the end of the drying cycle. The drying curve demonstrates feasibility of using online NIR for drying since LOD data is in close agreement with the predicted values.
Conclusions
On-line NIR and Raman spectroscopies were successfully implemented in the monitoring of several unit operations in the manufacturing of a product. Measurement of the mixing profile in real time with NIR provided the opportunity to study simultaneously the dynamics of powder mixing of the API and the lubricant and make quantitative measurements of both. NIR was also implemented for the on-line monitoring of granule moisture content during fluid bed drying process. On-line Raman was implemented in the monitoring of form conversion during wet granulation. We demonstrated that the use of on-line NIR and Raman (as delineated by FDA PAT guidance) provided tools for better understanding of the manufacturing process.
Acknowledgments
This work would not be possible without the contributions of our Biopharmaceutics coallegues Otilia Koo, Chandrakant Patel, Faranak Nikfar, and Brian Breza. The authors would also like to acknowledge valuable contributions from Kevin Macias and Dongsheg Bu, Joel Young and Thomas Raglione.
References
- US food and drug administration September 2004 “Guidance for industry PAT- A framework for innovative pharmaceutical development, manufacturing, and quality assurance”
- Yu L. X. Pharmaceutical quality by design: product and process development, understanding, and control. Pharmaceutical research (2008), 25(4), 781-91.
- L. Maurer, H Leuenberger “Applications of near infrared spectroscopy in the full-scale manufacturing of pharmaceutical solid dosage forms” Pharmazeutische Industrie (2009), 71(4), 672-674, 676-678
- International Conference on Harmonisation (ICH) Q8 Pharmaceutical Development (May 2006)
- International Conference on Harmonisation (ICH) Q9 Quality Risk Management (Nov 2005)
- International Conference on Harmonisation (ICH) Q10 Pharmaceutical Quality System (June 2008)
- Y. Roggo, P. Chalus, L. Maurer, C. Lema-Martinez, A Edmond, N. Jent “A review of near infrared spectroscopy and chemometrics in pharmaceutical technologies” J. Pharm. Biomed. Anal. (2007), 44(3), 683-700.
- L. J. Bellamy, A. Nordon, D. Littlejohn “Effects of particle size and cohesive properties on mixing studied by non-contact near-IR spectrometry” Int. J. Pharm (2008), 361(1-2), 87-91.
- Y. Sulub, B. Wabuyele, P. Gargiulo, J. Pazdan, J. Cheney, J. Berry, A. Gupta, R. Shah, H. Wu, M. Khan “Real-time on- line blend uniformity monitoring using near-infrared reflectance spectrometry: A noninvasive off- line calibration approach” J Pharm Biomed Anal (2009), 49(1), 48-54.
- D. Jayawickrama, A. El Hagrasy, S-Y. Chang “Raman applications in drug manufacturing processes” Am. Pharm. Rev. (2006), 9(7), 10, 12-15, 17.
- S. X. Yin, J. A. Grosso ”Selecting and controlling API crystal form for pharmaceutical development - Strategies and processes” Current Opinion in Drug Discovery & Development (2008), 11(6), 771-777.
- J. Mantanus, E. Ziemons, P. Lebrun, E. Rozet, R. Klinkenberg, B. Streel, B. Evrard, Ph. Hubert “Moisture content determination of pharmaceutical pellets by near infrared spectroscopy: Method development and validation” Anal. Chim. Acta (2009), 642 (1-2), 186-192.
- F. J. S. Nieuwmeyer, M. Damen, A. Gerich, F. Rusmini, K. Voort Maarschalk, H. Vromans “Granule characterization during fluid bed drying by development of a near infrared method to determine water content and median granule size” Pharm. Res. (2007), 24(10), 1854-1861.
Dimuthu Jayawickrama, Ph. D. earned his B. S. in Chemistry from University of Peradeniya, Sri Lanka and Ph. D. in Chemistry from University of Kansas, Lawrence, KS. Before joining, BMS, He worked as a postdoctoral researcher at the University of Illinois, Urbana-Champaign, IL and a senior lecturer, University of Peradeniya, Sri Lanka. At present, Dimuthu works as a senior research investigator at BMS, within analytical research and development.
Douglas Both is an Associate Director of Analytical Research and Development at Bristol-Myers Squibb, where he leads the Biopharmaceutics Process Analytical Science group. He received his B.S. and M.A. degrees in Chemistry from Montclair State College. His current interests are in the areas of noninvasive analysis, laboratory automation, and drug release simulation and modeling.
Gary McGeorge received his Ph.D. in solid-state NMR spectroscopy at Durham University in England (1996) while sponsored by Zeneca Specialties for the analysis of polymorphic dyestuffs. He then held a Post Doctoral position at the University of Utah Chemistry department. Currently, he is a Principal Scientist within the Research and Development organization at Bristol-Myers Squibb, where he has been responsible for the analysis of polymorphs within solid pharmaceuticals using IR, NIR, Raman and ssNMR; Most recently he is a technical lead for the PAT efforts in support of drug product design and manufacture. His research interests center on using spectroscopy to understand and characterize key attributes of materials and how they determine the performance of a product. He has 16 publications in the literature.
Claudia C. Corredor, Ph.D. is a Research Scientist within the Analytical Research and Development (AR&D) division at Bristol-Myers Squibb (BMS). Claudia received a B. S. in Pharmacy from the National University of Colombia (Bogotá, Colombia), and Ph. D. in Chemistry (Material Science) from the University of Central Florida (while sponsored by BMS). Prior to joining BMS, Claudia was a validation manager at Aventis (Colombia) and a method development analyst at Merck KGaA (Colombia). Her areas of interest include development of materials for non-linear optics, PAT, and separations. She is the author of 13 publications.