Introduction
Raman spectroscopy has become a workhorse [1-3] technology in the pharmaceutical industry, and new applications are emerging rapidly. Many of these applications involve the use of Raman libraries for material identification and verification. Raman spectroscopy differs in several important respects from absorbance spectrometry. First, absorbance spectra are always normalized to the transmitted intensity of the excitation source spectrum, so source intensity fluctuations do not alter the measured absorbance. Raman signal levels, on the other hand, depend directly on the source intensity. More importantly, any emission that can be excited by the Raman source will contribute to the measured Raman spectra. For example, fluorescence is a common interference in Raman spectra that can arise from trace level impurities in the material under study, resulting in a broad background signal. Many Raman spectrometers in use today utilize 785 nm excitation sources to minimize the effect of fluorescence, but it can be difficult to completely eliminate this background contribution. As a result, pharmaceutical excipients often exhibit signal-to-background ratios (SBRs) of less than 5, while active pharmaceutical ingredients (APIs) may have SBR in the 10-15 range. This article will evaluate the influence of background signals on Raman library searching. We will examine the Raman spectra of a variety of common pharmaceutical materials to characterize the influence of background on spectral correlation coefficients of pairs of these materials. We will illustrate the influence of background on Raman library searching by comparing the spectral correlation coefficients of two pairs of pharmaceutical materials before and after background reduction. We will evaluate two practical methods for background removal prior to the library search: (1) spectral mean centering and (2) first derivative preprocessing.
Methods
In the nomenclature of spectral library searching, the similarity of two spectra (i.e., an unknown spectrum and a library spectrum) is characterized by a “hit quality index” (HQI)[2]. The spectral correlation coefficient[4] is widely used as an HQI because it can be interpreted as a normalized measure of spectral covariance. It is defined as
where Unknown denotes the spectrum of the material under investigation, Library denotes the spectrum of a reference material that was used to construct the spectral library, and the dot symbolizes the dot product of two spectral vectors. The HQI equals 1.000 when the unknown spectrum is identical to the library spectrum, and is expected to approach a value of 0 as the unknown and library spectra become less similar to one another. First derivative spectra were computed by the Gram polynomial filter method [5], a generalization of Savitsky-Golay first derivative smoothing, using second order smoothing and an 11 point window.
Library-based identification analysis of an unknown material is typically accomplished by computing the HQI of the measured spectrum of an unknown material against all spectra in a reference library. The library material that gives the highest HQI is then identified as the most likely identity of the unknown material. Library-based verification is distinguished from identification in that the analyst knows the expected identity of the incoming material, and compares its measured spectrum to the reference library spectrum of that material to verify its identity. In this case, the HQI of the measured incoming material spectrum and its reference spectrum must exceed a predetermined threshold[6] (typically 0.95) to verify the identity of the incoming material. Thus, identification is based on a relative measure of spectral similarity between the unknown and all materials in the library, whereas verification is based on an absolute measure of similarity between the incoming material and a specific spectrum in the library. In both cases, the numerical value of the HQI is used as a figure of merit, and it is assumed that the HQI spans a range from a low value of 0 to a high value of 1. If spectral features such as background fluorescence increase the lower limit of this range, the utility of the HQI to distinguish different materials is diminished. Spectral preprocessing can reduce the influence of broad background signals on HQIs and thereby improve their selectivities for material identification and verification. One approach to background reduction is to fit the background to a polynomial, and then subtract the fitted background from the spectrum. Though this method may work well in some cases, background fitting and subtraction generally requires a new background model for each material, and user intervention is required to determine the correct polynomial order and baseline wavelengths. Such a method is difficult to implement in a robust, automated algorithm. In this work we examined two simple, modelindependent methods for background removal that lend themselves to automated spectral preprocessing: (a) spectral mean centering, and (b) first derivative preprocessing.
Table 1

The Raman spectral library developed for this study included 50 materials in several common pharmaceutical classes (See Table 1). APIs include a variety of molecular materials. Polymeric excipients are synthesized from molecular starting materials, whereas cellulosics and starches are prepared from agricultural starting materials. Molecular excipients are compounds that are not polymeric, and sugars and alcohols are small molecules and small polymers that have similar functional groups. This classification scheme may not be unique for a given material, but generally results in groups of materials whose spectra are expected to be similar.
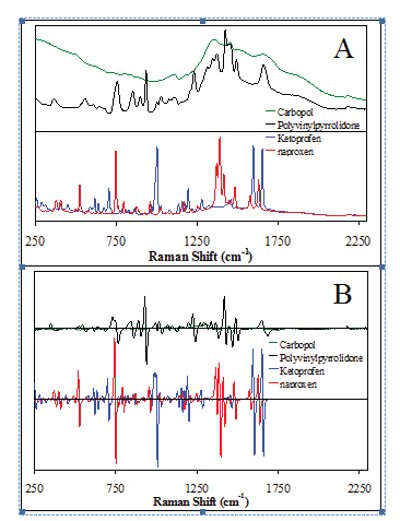
Figure 1- Representative spectra from the API class and the polymer excipients class. (A) Raw spectra. (B) First derivative spectra. Horizontal lines represent the intensity axis zero point for all pairs of spectra.
Results
Figure 1A displays two pairs of spectra that illustrate some of the issues that may arise when determining similarity using library-based spectral correlation methods. The spectra of APIs, illustrated in Figure 1A by ketoprofen and naproxen, often appear to have low background levels and sharp, intense peaks, both of which foster high spectral selectivity. In contrast, the spectra of polymeric excipients, illustrated by polyvinyl pyrrolidone (PVP) and carbopol in Figure 1A, have high background levels and broad peaks. The HQI of PVP and carbopol is 0.89, which implies that these spectra are similar to one another even though they appear visibly different. The SBRs for carbopol and PVP are 0.3 and 1.1, respectively, at their spectral peaks, further supporting the notion that their high HQI is a result of high background levels. The sharper spectra of naproxen and ketoprofen exhibit SBRs of 6 and 9, respectively, at their spectral peaks, yet the HQI still has a relatively high value of 0.5 for these completely dissimilar spectra.
Table 2-Summary of HQIs within classes of pharmaceutical materials.

The examples given above suggest that background reduction is essential for good discrimination of materials based on HQIs of Raman spectra. We examined spectral mean centering as a simple method to eliminate the average spectral intensity from each spectrum. A mean centered spectrum would look similar to raw spectra such as those shown in Figure 1A, with half of the spectrum shifted below the zero point of the intensity axis. In our study of HQIs for mean centered spectra, we found that this method of preprocessing did not provide robust results. For some pairs of materials mean centering was adequate, but in other cases it was not (see Table 2). On the other hand, we found that first derivative preprocessing provided robust background reduction that resulted in low HQIs for unlike spectra across all classes of materials
examined in this study. The spectral first derivative eliminates a constant background, and dramatically reduces a slowly varying linear or quadratic background. For example, the first derivative spectra of naproxen, ketoprofen, carbopol and PVP are shown in Figure 1B. The HQI for the derivative spectra of ketoprofen and naproxen is 0.003, and the HQI for the derivative spectra of PVP and carbopol is 0.05. Both of these values are significantly lower than the values computed on the mean centered spectra (0.02 for the APIs and 0.33 for carbopol and PVP). First derivative preprocessing has reduced the correlation coefficient between PVP and carbopol to a level so low that these materials can be easily distinguished from one another on the basis of their HQI.
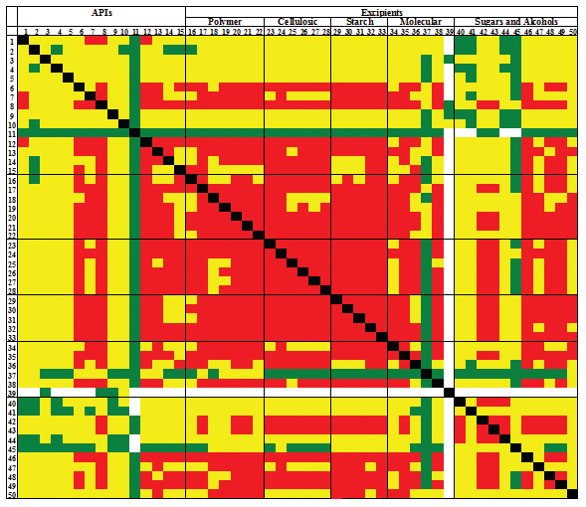
Figure 2-Correlation diagram for the raw spectra of 50 materials in a Raman library.
To illustrate the effect of first derivative preprocessing, we computed the HQI for all pairs of spectra in our library of 50 materials, resulting in HQIs for 1250 unique pairs of materials. Of these, 50 represent the HQIs of identical spectra whose values are equal to 1.00. The remaining 1200 HQI values represent the spectral covariance of pairs of different materials. The results for the raw spectra are displayed graphically in the correlation diagram shown in Figure 2. Numbers on the top and side of the figure indicate the pairs of materials inTable 1 whose spectra were used to compute the HQIs characterized by the color-coded squares in the correlation diagram. Black squares on the diagonal represent the HQIs of identical materials, while the off-diagonal squares represent the HQIs of pairs of spectra from different materials. The colors indicate different ranges of HQI values: HQIs ≤ 0.2 (white), 0.2 < HQIs ≤ 0.5 (green), 0.5 < HQIs ≤ 0.8 (yellow), HQIs> 0.8 (red) and HQIs = 1.00 (black). Of the 1200 HQIs of unique pairs of materials shown in Figure 2, 1176 have HQIs greater than 0.2, 1049 have HQIs greater than 0.5, and 498 have HQIs greater than 0.8. These high HQI values between materials suggest that HQIs of raw Raman spectra are of limited utility for discriminating between different materials.
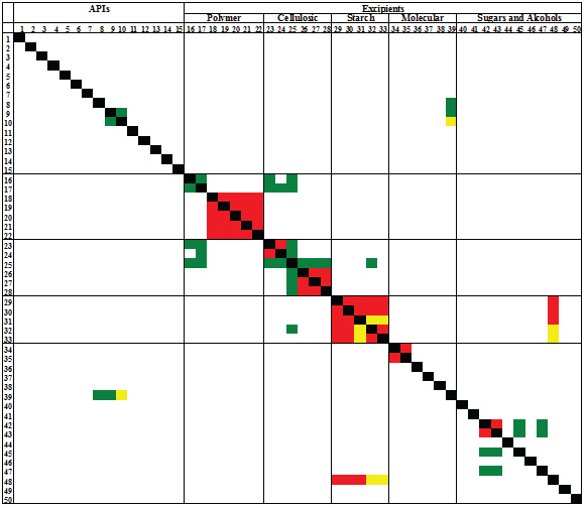
Figure 3-Correlation diagram for the first derivative spectra of 50 materials in a Raman library.
Figure 3 displays the correlation diagram of the same materials after the Raman spectra were treated with first derivative preprocessing using the same color coding that was used in Figure 2. In this case nearly all of the HQIs of different pairs of materials are less than 0.2. In fact, only 51 unique pairs of unlike materials have HQIs greater than 0.2, 32 pairs have HQIs greater than 0.5 and 27 pairs have HQIs greater than 0.8. It is instructive to examine the materials in Figure 3 that result in high HQI values. Nearly all of the HQIs that are greater than 0.8 are close to the diagonal, indicating that they reflect strong correlations within classes of pharmaceutical materials. The red block associated with materials 18-22 reflects strong correlations between the spectra of polyvinyl pyrrolidones from different manufacturers. Since these are the same materials, it comes as no surprise that their spectra display large covariances. The red blocks in the cellulosic class reflect large covariances between the spectra of HPMC and MCC from different manufacturers, and the red and yellow block in the starch class indicates that different forms of starch will be difficult to distinguish on the basis of their Raman spectra. In the molecular excipient class, the red square reflects the covariance of the stearic acid spectrum with the spectrum of magnesium stearate, and the strong correlation of materials 42 and 43 reflects the fact that these are sorbitols from different manufacturers.
Strong correlations far from the diagonal also provide some insight into factors that will affect the selectivity of library-based spectral correlation methods for identification and verification purposes. In the API class, benzyl alcohol shows a weak correlation with benazepril, ketoprofen and pseudoephedrine. Pseudoephedrine is a substituted benzyl alcohol, and the other two APIs have functional groups similar to a benzyl alcohol group, so again it is not surprising that they would show weak covariances with benzyl alcohol. Dextrin shows a strong correlation with the starches because dextrin is typically prepared by hydrolysis of starches to form low molecular weight carbohydrates. Finally, sorbitol appears to exhibit a weak covariance with ethylene glycol and mannitol. The HQI between sorbitol and mannitol is 0.29, and indicates that these materials are distinguishable by their Raman spectra. This covariance is not surprising since they are diasteromers. The HQI between sorbitol and ethylene glycol is 0.26 and reflects the fact that sorbitol is a polymer of ethylene glycol.
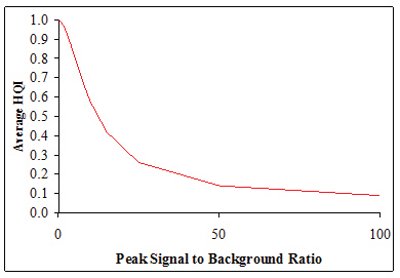
Figure 4- Average HQI of Raman shift standards versus the peak SBR.
The dramatic difference between Figures 2 and 3 indicates that first derivative preprocessing has a profound influence on computation of HQIs. To characterize the relationship between SBRs and HQIs, we added a broad background to the spectra of benzonitrile, cyclohexane and sodium sulfate. These materials have been used as Raman shift standards and are characterized by strong sharp peaks and low background levels. Without addition of background, the average HQI for raw spectra of unlike pairs of these three materials is 0.05, and their SBRs exceed 500. After adding artificial background, the average HQI of unlike pairs were computed and plotted versus the peak SBR in Figure 4. The plot indicates that peak SBRs as high as 10 can increase the HQIs of these materials by as much as 0.5. When background was increased to give an SBR of 0.33, the average HQI was 0.98, rendering these unlike materials indistinguishable by Raman spectral correlation. However, when the low SBR spectra were treated with first derivative preprocessing, the average HQI was reduced to 0.005, thereby eliminating the influence of background on the HQIs. Table 2 indicates that raw spectra from several classes of pharmaceutical materials have SBRs in the range of 0.5 to 10, and Figure 4 suggests that without preprocessing, one can expect high HQIs, even for unlike materials.
Conclusion
This study demonstrates that background signal can influence HQIs computed for Raman spectra of pharmaceutical materials. Though the influence of background on the HQI depends on the similarity of the background signals between two spectra, the background signal will often mimic the instrument response, especially for Raman spectrometers that use 785 nm excitation. In this case the background signal from two materials can exhibit strong covariance, and thereby have a profound influence on HQIs. This study also demonstrates that first derivative preprocessing can largely eliminate the influence of background on HQIs without adversely affecting the HQIs of materials with low background levels. Table 2 summarizes the HQIs computed in this study within each class of pharmaceutical material. HQIs computed on raw spectra seldom provide enough range to derive unambiguous identification and verification results from Raman spectra. Mean centering provides some improvement in certain cases, but first derivative preprocessing always outperforms mean centering. Thus, first derivative preprocessing offers a simple, model-independent method of eliminating the influence of background signal on Raman spectra. Because this method is model independent, it can be easily automated and incorporated into library searching algorithms.
Acknowledgments
This project was supported in part by the CDER Critical Path Program and an appointment (J.D.R.) to the Research Participation Program at the Center for Drug Evaluation and Research administered by the Oak Ridge Institute for Science and Education through an interagency agreement between the U.S. Department of Energy and the U.S. Food and Drug Administration.
Disclaimer
The findings and conclusions in this article have not been formally disseminated by the Food and Drug Administration and should not be construed to represent any Agency determination or policy.
References
- Carron K., Cox R., “Qualitative analysis and the answer box: a perspective on portable Raman spectroscopy”, Anal. Chem. (2010), 82, 3419-3425.
- McCreery R. L., Horn A. J., Spencer J., Jefferson E., “Noninvasive identification of materials inside USP vials with raman spectroscopy and a raman spectral library”, J. Pharm. Sci. (1998), 87, 1-8.
- Green R. L., Brush R., Jalenak W., Brown C. D., “Verification Methods for 198 Common Raw Materials Using a Handheld Raman Spectrometer”, Pharm. Technol. (2009), 33, 72-82.
- Spectral ID Users Guide, Galactic Industries Corporation: Salem, NH, (1998), 71.
- Gorry P. A., “General least-squares smoothing and differentiation of nonuniformly spaced data by the convolution method”, Anal. Chem. (1991), 63, 534-536.
- Champagne A. B., Emmel K. V., “Rapid screening test for adulteration in raw materials of dietary supplements”, Vib. Spectrosc. (2011), 55, 216-223.
Author Biographies
John Kauffman is a research chemist at the FDA Division of Pharmaceutical Analysis. He earned his B.S. degree in Chemistry from the University of Oregon, and a Ph.D. in Physical Chemistry from the University of Illinois, Champaign-Urbana. Prior to joining the FDA he was Professor of Chemistry at the University of Missouri, Columbia. His team performs research on Raman, NIR, x-ray fluorescence and ion mobility spectrometry for detection of counterfeit and adulterated pharmaceutical materials using portable spectrometers, and deep ultraviolet resonance Raman spectroscopy for characterization of protein secondary structure. He also performs research on metals in pharmaceutical materials using inductively coupled plasma mass spectrometry.

Jason D. Rodriguez is an ORISE postdoctoral fellow at the FDA, Division of Pharmaceutical Analysis in St. Louis, MO. He attended the University of Texas Pan American where he received a B.S. in chemistry. He received his Ph.D. in physical chemistry from the University of Illinois at Urbana-Champaign where he performed research on ion—host complexes using gas phase cluster spectroscopy. While at the FDA, he has worked on developing a comprehensive approach to create standardized, transferrable Raman spectral libraries that can be used in the verification/identification of pharmaceutical materials. He has also developed novel techniques to quantify the sensitivity of spectral library-based methods.

Dr. Buhse joined DPA in 2001 as Deputy Director. She was promoted to Division Director in June, 2004. Dr. Buhse received a B.A. in Chemistry from Grinnell College and a Ph.D. in Physical Chemistry from the University of California, Berkeley under the direction of John H. Clark and George C. Pimentel. Before joining FDA, Dr. Buhse worked in management positions in Production, Validation and Analytical Services at Sigma Aldrich Corporation and as a Senior Research Scientist for Rohm and Haas Company. She leads a laboratory based division in the Center for Drug Evaluation and Research (CDER) responsible for providing a strong scientific and analytical base to support FDA investigations and enforcement actions and conducting research programs to advance the application of new technologies and methods for assessing the quality and authenticity of human drugs.
This article was printed in the May/June 2011 issue of American Pharmaceutical Review - Volume 14, Issue 4. Copyright rests with the publisher. For more information about American Pharmaceutical Review and to read similar articles, visit www.americanpharmaceuticalreview.com and subscribe for free.