Abstract
Particles in protein therapeutics, composed of aggregated protein monomers, may cause an immunogenic response in patients. Consequently, industry and the FDA desire more accurate methods for counting and characterizing particles. Unlike many manufacturing impurities, protein particles have a refractive index very close to that of the matrix solution. In this paper, we describe some of the measurement challenges for the common optical methods of brightfield microscopy and light obscuration. The particulate refractive index is a key unknown parameter in the effort to standardize counting of protein particles. At NIST, we are developing two types of reference materials that mimic the properties of protein particles to support the validation of these two optical methods. We have developed a polymer-based protein surrogate based on the partially fluorinated polymer ethylene tetrafluoroethylene (ETFE). Mechanical abrasion of the ETFE followed by size filtration produces a polydisperse suspension of very rugged particles with a morphology quite similar to protein particles. In another approach, we have created artificial polymer particles as small as 3 μm x 4 μm x 40 μm in large quantities using photolithographic methods developed for the semiconductor industry. Future work will focus on reducing the optical contrast of these particles in order to better mimic typical protein particles. These reference materials will provide a stringent test of the sensitivity and morphological measurements of optical particle-counting and particle-characterization instruments.
Product of the U.S. government; not subject to U. S. copyright
Introduction
When proteins in solution partially denature, the protein monomers can aggregate, forming particles that vary in size from small oligomers to particles hundreds of micrometers in length [1,2]. Because protein particles may cause immunogenic responses in patients, both the FDA and manufacturers wish to accurately count and characterize these particles.
Table 1 - Summary of several different optical imaging and counting methods

In this paper we discuss the principles of two common methods for counting particles of diameter 2 μm or greater: flow microscopy and light obscuration. Table 1 provides a brief description of these methods as well as other techniques discussed in this paper. We identify sources of size or count bias for these instruments and possible paths to standardization. Light scattering, fluorescence, and electrical detection are all valid methods as well, but are beyond the scope of the present paper.
The thoughts presented are intended to stimulate progress in achieving accurate counts of protein particles; the discussion below should not be construed as a Recommended Practice or official guidance.
Properties of Protein Particles

Figure 1 - Brightfield (A), darkfield (B), and optical phase (C) images of a typical protein particle.
Figure 1 displays three micrographs of the same protein particle, created by agitating a solution of polyclonal immunoglobulin G in a phosphate buffer. Frame A is a digitally enhanced image taken with standard brightfield illumination. Frame B is an inverted dark field image; in darkfield microscopy, the intensity of the image is proportional to the local scattering of the light. For frame C, we generated a map of the optical thickness of the particle by mathematical manipulation of multiple brightfield images with different focal planes, using the method of Quantitative Phase Microscopy [3-5]. The brightfield and darkfield images illustrate that protein particles are typically irregular in morphology and highly heterogeneous. With the assumption that the particle is a sphere, the optical thickness map gives an apparent refractive index equivalent to a particle that is only 2% protein and 98 % water or buffer [6]. Images A and B suggest that this particle is composed of a tangle of fiber-like protein aggregates; many protein particles appear to be fibrous.
Optical Methods for Particulate Detection
Most flow microscopy systems optimized for particulate detection capture brightfield images as a test solution flows through a narrow rectangular channel under stroboscopic illumination.
Light obscuration and light scattering methods can be thought of as non-imaging equivalents to dark field microscopy. Scattering of incident light by a particle is either detected directly (light scattering) or by measurement of a decrease in intensity of the transmitted beam (light obscuration).
There is no commercially available instrument to obtain the equivalent of Fig. 1C, the phase or optical thickness map, for a population of particles, yet this method provides important information on the refractive index of the particle. Knowledge of particulate refractive index is necessary to understand instrument response and may also be useful to distinguish protein particles from other types of particles. We show below that the refractive index is a key unknown parameter in the effort to standardize counting of protein particles.
Development of Standards
Our philosophy for developing standards has been to develop surrogates for the actual protein particles, where the surrogate properties for the detection scheme of choice mimic those of actual proteins. Standards using actual proteins are limited by several factors:
- stabilization of protein particles will likely require storage and transport at –80 °C,
- use of actual proteins precludes the use of accurate quantification techniques such as scanning electron microscopy, and
- protein particles are themselves quite variable, so there is no single protein that would match all applications.
In our view, protein standards have the greatest potential value not as an absolute standard for particle size distributions, but as a test artifact for comparing the responses of different instruments and for demonstrating that instruments may be reliably validated with non-protein particles that mimic the properties of protein particles. Protein-based standards may be necessary for other detection methods that rely on the intrinsic properties of the particle, such as detection of tryptophan or tyrosine fluorescence.
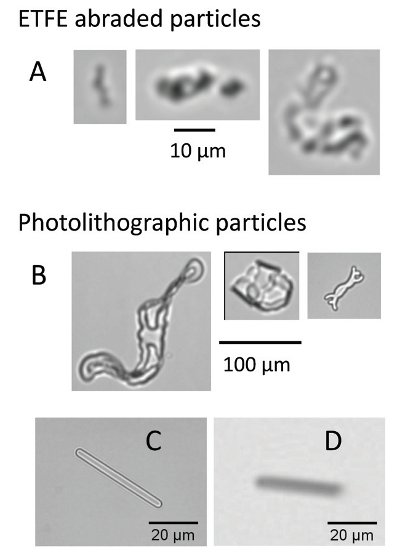
Figure 2 - Candidate reference-material particles, fabricated from abraded ETFE (A) or from patterned photo-resist epoxy (B and C).
At NIST, we are creating two types of polymer standards that will support calibration and validation of optical particle counters. Figure 2 shows examples of these polymer particles.
The polymer ethylene tetrafluoroethylene (ETFE) is attractive as a candidate because it has low refractive index (approximately 1.40), and is chemically inert and mechanically strong. We produce polydisperse solutions of ETFE particles by mechanically abrading ETFE against a diamond or aluminum oxide abrasive surface under water. Following collection of the particle solution, large particles are filtered out by suspending all the particles, allowing the solution to gravitationally sediment for a specified time, and drawing out the upper volume of the solution.
The morphology of the ETFE particles is remarkably similar to typical protein particles (see Fig. 2A), even though the abrasion process used in making the ETFE particles has no resemblance to the kinetic processes leading to protein particle formation.
At NIST, the preferred method for accurately establishing the particle size distribution of a polydisperse particle blend down to 1 μm in size is to measure the dry particles using scanning electron microscopy. Success in this measurement requires the particles to be sufficiently strong to hold their shape during and after drying.
Several companies have developed potential particle standards that have even lower refractive index mismatch than the ETFE particles that NIST has developed [7]. These standards have proven useful in optimizing the sensitivity of flow microscopy systems. Present formulations have a short shelf-life and are physically fragile, which makes characterization by SEM and long-term storage difficult.
A significant disadvantage of the ETFE particles is that the particle size and shape are highly variable and must be characterized by SEM or optical microscopy after production. As an alternative, we have created polymer particles of relatively complex yet highly controlled geometry using photolithographic methods developed for the semiconductor industry (Figs. 2B-D). The fabrication method, in short, is as follows. A thin layer of photoresist (a light-sensitive polymer solution) is deposited on a silicon wafer and subsequently exposed to ultraviolet light (UV) through an optical mask. Following baking, the UV-exposed regions become cross-linked polymer. The unexposed polymer is then washed away. The remaining artificial particles are released from the wafer via sonication and exposure to a developer solution. We have obtained the best dispersion of the particles in solution by treating the particles with an oxygen plasma before they are released from the wafer release and suspending the particles in a solution of a polysorbate surfactant. By varying the final baking step (e.g., the ramp rates, temperature, and duration), we can vary the particle rigidity. Some thin and flexible particles spontaneously roll up into irregular, low-density balls, mimicking the irregular and highly hydrated protein particles. The small rod-like particles shown in Figs. 2C-D aid us in understanding the orientation of particles within flow cells and the imaging of elongated particles with widths near the diffraction limit.
Presently, we are developing particles with reduced optical contrast. These particles will provide a stringent test of the sensitivity and morphological measurements of flow microscopy instruments.
Light Obscuration Counters
In a light obscuration particle counter, the test fluid passes through a narrow channel that is transversed by a laser beam. When a particle passes through the beam, the light intensity drops, and the instrument infers the particle size from the magnitude of the intensity decrease. The total amount of light scattered or absorbed from the beam is proportional to the cross sectional area of the particles and the extinction efficiency, Q. The method is only valid for particulate concentrations that are low enough to ensure that only one particle at a time passes through the beam.
For particles that differ in refractive index by 0.1 or more from the matrix fluid, have diameters greater than approximately 10 μm, and are approximately spherical, Q very nearly equals 2, and the observed intensity decrease depends solely on the particle diameter. Protein particles, however, have refractive indices that differ only slightly from that of the matrix and may be significantly elongated. As a result, Q may be reduced from the asymptotic value of 2 by a factor of 10 or even 100, as seen in Figure 3.

Figure 3 - Effect on the detection efficiency, Q, for a light obscuration counter of detector aperture, particle refractive index, and particle aspect ratio. We model the particles as either spheres or spheroids of aspect ratio 0.65, with a refractive index Δn higher than that of the surrounding matrix fluid.
Light obscuration counters typically are calibrated with suspensions of polystyrene spheres, which have the comparatively high refractive index of 1.58. The calibration is equivalent to determining the value of Q as a function of particle diameter. In use, the instrument then converts the measured reduction in beam intensity, caused by transit of a particle into the beam, into the diameter of the polystyrene sphere that would produce the same reduction in beam intensity. If Q for the polystyrene spheres differs greatly from the Q value for the detected particles, the equivalent particle diameter reported by the instrument will differ greatly from the actual particle size.
Typically, reported diameter values for protein particles will be much less than the actual diameter. The test methods USP <788> [8] requires reporting of all counts greater than 10 μm. All the particles that have a physical dimension greater than 10 μm but an apparent dimension less than 10 μm are not counted. In this way, an instrumental size error translates into an apparent count error.
Calculation of Q depends on three particle characteristics:
- refractive index of the particle
- aspect ratio or degree of elongation
- particle roughness
And on two parameters of the light obscuration counter:
- wavelength of the light beam, and
- acceptance angle of the light beam detector
The aspect ratio and especially the refractive index have a dramatic effect on the calculated value of Q. Few methods have been published on the calculation of Q for rough, large (diameter much greater than the wavelength of light) particles. Preliminary calculations of spherical particles for diameters up to 1 μm with a convoluted surface show very little effect of particle roughness.
Very few literature calculations of Q incorporate the finite acceptance angle of the detector [9]. Accurate calculations may be made for prolate (elongated) or oblate (flattened) spheroids by numerically integrating the results of theories that predict the scattering intensity as a function of angle [10]. Figure 3 illustrates the large magnitude of shifts in Q due to variations in aperture, particle refractive index, and particle aspect ratio.
Standardization of Light Obscuration
Accurate counts can only be obtained if the value of Q of the detected particles is known. Modeling of the instrumental response shows promise, and NIST is preparing a paper describing such a model. Without an accurate knowledge of the particle refractive index, correction of the sizing bias is impossible.
Other parameters that must be known are the light beam wavelength and the effective acceptance angle of the detector. Although these values are generally not documented in light obscuration user manuals, their determination by the manufacturer is straightforward.
Because a small polystyrene sphere gives the same signal as a larger protein particle, the calibration of the light obscuration apparatus with polystyrene spheres should extend to the lowest sizes practical with the instrument.
Regardless of the success in standardization, the light obscuration counter will not be able to distinguish between protein particles and other contaminants, which is a significant drawback. The value of Q for proteins is likely to be substantially lower than the value for glass chips or metal particles. Correcting the counts to obtain an accurate size for protein particles will typically lead to oversizing of non-proteinaceous particles.
Flow Microscopy Systems
A flow microscopy system obtains the number of particles per unit volume of solution by counting the number of particles within a certain size range found on a known number of camera images. Knowing the depth of the flow cell and the imaged area, the volume of fluid per image is readily computed. Just as in light obscuration, an error in particle size will translate into an error in particle count. Note that the flow rate is not a critical parameter for the instrument calibration.
The manufacturer can readily calibrate the field of view and the system magnification by using calibrated reticles or by imaging polystyrene beads with a diameter much greater than the image resolution.
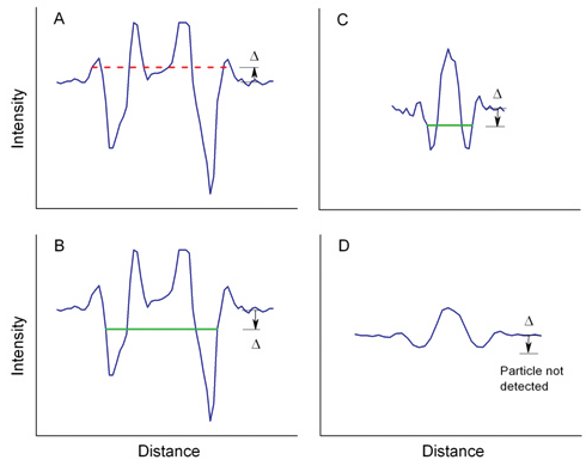
Figure 4. Effect of different detection thresholds on the apparent particle diameter. Blue lines represent the intensity profile across a large (A and B) and small (C and D) particle. The horizontal bars indicate the apparent particle width for particles that have a border that is darker (solid green bars) or lighter (dashed red bar) than the surrounding area of the image.
It is much harder to develop a robust calibration method for small particles that are near the optical resolution limit [11, 12]. Figure 4 illustrates the problem. The curved blue lines represent a profile of measured light intensity across the image of a particle. A particle may be detected by searching for the outermost pixels that are darker than the background by a set amount, Δ (Fig. 4A), or for the outermost pixels that are lighter than the background (Fig. 4B). The diameters obtained (red and green horizontal bars) may differ substantially with the choice of threshold Δ.
As the particle size decreases, the situation becomes worse. Because of the diffraction limited resolution of our eyes, stars in the night sky vary in brightness but not apparent size. In the same way, the intensity profiles for particles below the diffraction limit will vary in magnitude but not lateral dimension (Figs. 4C and 4D). The apparent width depends on the choice of Δ. In Fig. 4D, the intensity has become low enough that no particle is detected for the given Δ.
In some instruments, mathematical data manipulations partially correct for these effects. Figure 2 shows brightfield images of lithographically created rods obtained from a standard microscope (Fig. 2C) and from a flow microscopy systems (Fig. 2D). Direct measurement of the outer dark edge of Fig. 2D gives a width of 9.2 μm, much wider than the value of 4.0 μm from the standard microscopy system. With software correction of the image properties, the reported width drops to a value of 5.8 μm.
Standardization of Flow Microscopy
Automated analysis of particulate micrographs provides information on both the size and morphology of the imaged particles. As discussed in the Light Obscuration section, an accurate count of the number of particles requires accurate particle sizing.
The predominant metrology need for flow microscopy is understanding the counting and image analysis of small particles with sizes approaching the diffraction limit of the instruments and with refractive indices typical of protein particles.
Instrument validation will require multiple tests, possibly including:
- manufacturer’s testing of morphological analysis using lithographically created particles of complex geometry,
- validation of counts and sizing accuracy at small sizes using suspensions of spheres in a liquid of very similar refractive index, and
- validation of the detection, sizing and morphological analysis of irregular particles by measurement of a polydisperse ETFE standard.
Summary
Success in standardizing optical counting instruments requires both the development of physical reference standards and understanding of the principles of operation of the system. Beyond the NISTdeveloped standards, convenient, commercialized methods are needed for determining the particulate refractive index. Finally, success in validating any type of particle counter will reveal the lower limits of particle size and transparency to attain acceptable accuracy. Standardization of instrument specifications for these limits would assist users in choosing appropriate measurement techniques.
Acknowledgments
We thank Dick Cavicchi, Juliane König-Birk, and Joe Gecsey for helpful conversations.
References
- Carpenter J. F. et al. (2009) Overlooking subvisible particles in therapeutic protein products: gaps that may compromise product quality, J. Pharm. Sci. 98: 1201-1205.
- Singh, S. K. et al. (2010) An industry perspective on the monitoring of subvisible particles as a quality attribute for protein therapeutics, J Pharm Sci. 99: 3302-21.
- Paganin, D., and Nugent, K.A. (1998) Non-interferometric phase imaging with partially coherent light. Phys. Rev. Lett. 80, 2586–2589.
- Bellair, C. J., Curl, C. L., Allman, B. E., Harris, P. J., Roberts, A., Delbridge, L. M. D., and Nugent, K. A. (2004) Quantitative phase amplitude microscopy IV: imaging thick specimens, J. Microscopy 214: 62-69.
- DiMarzio, C. A. (2008) Full–field quantitative phase imaging, in Three-Dimensional and Multidimensional Microscopy: Image Acquisition and Processing XV, ed. J.-A. Conchello et al., Proc. of SPIE Vol. 6861, 686107.
- Ball, V. and Ramsden, J. J., (1998) Buffer Dependence of Refractive Index Increments of Protein Solutions, Biopolymers 46: 489–492.
- Sharma, D., Merchant, C., and King, D. (2011) Development of a Sensitivity Reference Material for Calibration, presented at 2011 CHI PepTalk, San Diego CA, USA.
- USP–NF General ChapterParticulate Matter in Injections andParticulate Matter in Ophthalmic Solutions (U. S. Pharmacopeia, Rockville, MD, 2010).
- Zhao, J.-Q., and Hu, Y.-Q. (2003) Bridging technique for calculating the extinction efficiency of arbitrary shaped particles, Appl. Optics 42: 4937-4945.
- Chen, T. W., and Yang, L. M. (1996) Simple formula for small-angle light scattering by a spheroid, Optics Comm. 123: 437-442.
- Osterberg, H. and Smith, L. W. (1960) Diffraction Theory for Images of Disk-Shaped Particles with Kohler Illumination, J. Optical Soc. Amer. 50: 362-369.
- Smith, L. W. (1960) Diffraction Images of Disk-Shaped Particles Computed for Full Kohler Illumination, J. Optical Soc. Amer. 50: 369-374.
Author Biographies
Dr. Joshua Wayment received his Ph.D. from the University of Utah, where he received the American Chemical Society’s Division of Analytical Chemistry fellowship. He then worked for the National Institute of Standards and Technology. He has published multiple papers on protein interactions in solution and at an interface.
Michael Carrier is an Electrical Engineer at the National Institute of Standards and Technology. He has B.S. degrees in both Computer Science and Electrical Engineering as well as an M.S. in Materials Science from the University of Maryland. He is currently working on MEMS sensor design and fabrication.
Dr. Dean Ripple received his Ph.D. in physics from Cornell University. Since 1991, he has worked at the National Institute of Standards and Technology in the areas of temperature, humidity, and particle counting standards. He presently leads a group developing standards in support of biomanufacturing.