Abstract
Nano particulates or nano-scaled pharmaceutical products have received great interest for the past two decades. Reduction in size to the nano scale can offer unique therapeutic advantages, such as the ability of particles to pass through cell membranes, thereby targeting specific cells. There has also been a great deal of research performed on the use of nano particles for imaging specific tissues or tumors in vivo. The physical characterization of these nano materials poses certain challenges to the scientist/engineer working in this field. This article highlights these analytical challenges and proposes a suite of analytical techniques, that, when used in conjunction with each other, provides a thorough characterization of the material.
Introduction
The formal definition of nano particle is a discrete entity that has a dimension of 100 nm or less. A nano-scaled material, on the other hand, may be comprised of nano-scaled structures, though the physical dimensions of the material may exceed 100 nm. A spray-dried agglomerate of nano-sized particles would be described as nanoscaled. For pharmaceutical applications, one does not resort to the use of nano materials unless there is a therapeutic driving force to do so. If the compound is poorly soluble in-vivo or if the molecule is highly potent, and the desired presentation of the drug product is a tablet, capsule, or suspension, the decision may be implemented to produce the active pharmaceutical ingredient as a nano material.
The actual form of the nano materials covers a number of technologies, from actual nanocrystals of API, to emulsions, to liposomes. An excellent review of the current technology can be found in Ref. [1]. Regardless of the formulation or carrier, once this size range is implemented, the drug product performance is intimately connected to the physical properties of the active pharmaceutical ingredient. Physical characterization becomes a crucial part of the drug substance and drug product control strategy.
Physical Characterization Techniques
Sample Preparation
To obtain accurate and meaningful particle size data, the challenge for nano materials lies in the sample preparation. Because the material is so small and so surface active, generally accepted scientific practices can often end up producing artifacts, or altering the sample during measurement.
Toxicity concerns for highly potent nanocrystals suggest that the material should not exist as a dry powder, but can be more safely handled dispersed in a liquid. To prevent particle aggregation, either the pH can be adjusted, or surfactants can be used. Solubility of drug substance particles, however, is often pH dependent; therefore, if the pH is adjusted to provide adequate particle dispersion, the material could dissolve. The same phenomenon can occur with surfactants, where the particles can be solubilized by their addition.
If the particles are not solubilized by the use of surfactants, then for some characterization techniques, the adsorbed layer of surfactant will skew the particle size, making the particles appear larger. This, however, may be relevant to the performance of the drug, and such measurements can be valuable in predicting in vivo performance [2]. Factors such as these must be considered when interpreting physical characterization data for nano materials in pharmaceutical applications.
Particle Size Measurement Via Dynamic Light Scattering
Laser diffraction, the dominant platform for sizing most pharmaceutical powders, is an ensemble technique (i.e. measures many particles rather than a single particle measurement) that has a lower size limit of approximately 0.1 μm. To measure objects below that limit, dynamic light scattering (DLS), also known as photon correlation spectroscopy (PCS), is one of the few ensemble techniques that can be employed in this size range (0.005 – 1 μm). The technique is well established and several commercial platforms are available. The theory and application of this technique are contained in refs. [3-5].
Stable, well-dispersed particles are placed in the sample cell, where Brownian motion causes the particles to move randomly in the suspension. A laser beam passes through the sample cell and is scattered by the particles. The randomly changing diffraction pattern is converted into a histogram of intensity vs. size. Note that this data representation is not what one typically encounters, which is frequency vs. time. For this reason, PCS should be used to measure an average particle size rather than to produce a particle size distribution.
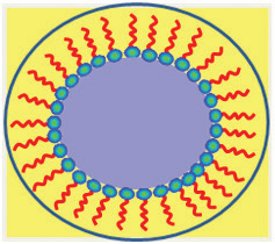
Figure 1- Schematic of nano particle with adsorbed surfactant layer. Particle size data obtained by PCS will also measure the effect of the surfactant [12].
Figure 1 shows a schematic of a particle that has an adsorbed layer of surfactant for particle dispersion. PCS measures a hydrodynamic particle diameter; therefore, the adsorbed layer of surfactant will affect the particle size measurement. The effective particle size is denoted by the circumscribed blue circle. This is not necessarily an undesirable occurrence. If this particle is being designed to pass through a specific physiological barrier, such as the blood-brain barrier, or certain cell membranes, the hydrodynamic measurement produced by PCS would be extremely relevant. If the purpose of the measurement is to measure the actual size of the particle itself, then the average particle diameter would be larger than observed with other microscopic techniques that would only image the denser particle.
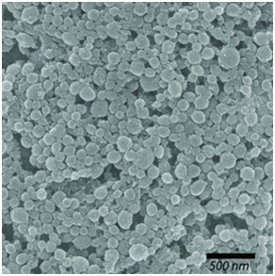
Figure 2-Scanning electron micrograph of drug-eluting nanoparticles [13].:
Particle Size Measurement by Electron Microscopy
Since the inception of nano technology, electron microscopy has served as the gold standard for measuring particle size and morphology. Initially, scanning electron microscopes were incapable of imaging nano-scaled objects; therefore transmission electron microscopy was the only microscopic technique available. With the advent of field emission electron guns for scanning electron microscopes, this scenario changed. Both instruments now offer clear images of nano materials. Figure 2 shows a scanning electron micrograph of drugcarrying biodegradable nanoparticles comprised of a polysebacic acid core and a shell of polyethylene glycol.
Scanning electron microscopy offers a three-dimensional representation of the particles. The gray scale produced in SEM images, however, makes quantitative measurements on these images using appropriate image analysis software very difficult because of the lack of contrast provided.
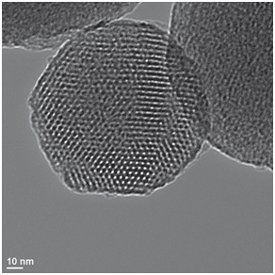
Figure 3-Transmission electron micrograph of silica particles used for drug delivery [14]
Figure 3 shows a TEM image of nanoparticles of silicon dioxide (silica) used for drug delivery. Because the electron beam passes directly through the object in a TEM, electron diffraction and fringes can be observed. Rows of atoms can be observed in this image. Additionally, there is much better contract in this image, allowing easier quantification/measurement of features. Even with modern advances in scanning electron microscopy, TEM exhibits much higher resolution.
For both transmission and scanning electron microscopy, the particles must be isolated, and are analyzed in a high vacuum environment.
Both techniques are insensitive to adsorbed surface layers such as surfactants that would be required to disperse the particles in a liquid (typically aqueous) environment.
To obtain these high resolution images, in both instances, the sample is bombarded with a very high energy electron beam. Prolonged exposure of the particles to this beam can cause degradation. This must be considered when opting for this type of analysis.
In summary, both PSC and electron microscopy provide information on particle size. If at all possible, both techniques should be employed for the size characterization of pharmaceutical nanoparticles. They are complimentary orthogonal techniques that provide valuable information.
Surface Area Measurements
Particle diameter is perhaps the most relevant data to collect for scenarios where the physical size of the particle controls the in vivo performance of the drug product. When nano-scaled formulations are considered based upon the poor solubility of the drug substance, surface area measurement provides equally meaningful data. It has long been realized that surface area controls the dissolution of solid oral dosage forms [6-11].
Because nanoparticles can easily pass through the filters and frits found in commercial surface area instruments, either the sample must be exposed to vacuum very slowly, or the material should be presented in an agglomerated form (i.e. nano-scaled). If the nanoparticles are contained in aggregates, a two-tiered strategy for characterization could be adopted, whereby the particle size measurement would measure aggregate size, and surface area measurements would provide an indication of the nano particle size. Often, high energy sonication is employed in an attempt to attain the primary particle size. This is not a preferred choice. The data obtained is often an indication of the degree of sonication, rather than the primary particle size.
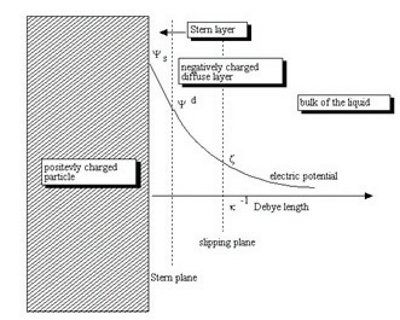
Figure 4- Diagram illustrating particle surface charge in a liquid as a function of distance from the surface of the particle [15].
Isoelectric Point and Zeta Potential
Isoelectric point and zeta potential measurements are routinely collected data by practitioners working with inorganic sub-micron powders, nano particles, or colloidal systems. The origin of these measurements is found in the pioneering work performed by Stern to describe the interaction of particles in liquids. For nano particles such as proteins, liposomes and nano crystals with low isoelectric points, i.e. with low surface charges, the nano material will easily flocculate in the suspension, creating an undesirable scenario. For particles with a high zeta potential (either positive or negative), all of the particles will have a high surface charge, thereby repelling each other in the liquid and maintaining a discrete identity. The isoelectric point of a particle in a liquid is the pH at which the surface charge on the particle is zero, which is usually avoided in pharmaceutical nanoparticulate applications. (For waste water treatment, the water may be pH adjusted to achieve the isoelectric point, thereby causing harmful particulates to flocculate and allow them to be removed via filtration). Figure 4 shows the classic diagram used to describe the layers that form around a particle in a liquid
There are two analytical instrument platforms used to measure zeta potential: electrophoretic and electroacoustic. With electrophoresis, suspended particles are placed between the plates of a capacitor, and the potential across the plates is scanned (typically from -25 to 25 mV). The particle motion is measured as a function of potential using many of the same principles employed in dynamic light scattering measurements. (Instruments are available that perform both particle size measurement via DLS and zeta potential measurements.) With electrophoretic measurements, the particles must be small enough to remain suspended without the introduction of any additional energy or agitation (stirring, pumping, sonication, etc.) Additionally, the suspension must be suitably dilute to permit individual particle motion detection by the laser.
Electroacoustic instruments require more concentrated suspensions, and the suspension can be stirred during the measurement. With this technique, ultrasonic bursts of energy are pulsed through a suspension, causing charged particles to move. This motion generates an electrical charge, which is monitored as a function of the ultrasonic energy burst. The sample can be stirred because the duration of the pulse is so small; particle motion created by stirring is negligible. Highly concentrated suspensions (up to 50 vol. %) can be measured used this technique.
If the zeta potential of the nano material in its nascent state is insufficient to prevent flocculation, pH adjustments can be made or surfactants can be added. The same limitations and cautions described in Sample Preparation, however, are applicable here; pH changes and the addition of surfactants can easily solubilize the nano material.
The Need for a Rigorous Physical Control Strategy
The mandate for any commercial drug product is to deliver safe and efficacious treatment for human illness. All pharmaceutical companies are required, by law, to demonstrate that they understand the therapeutic action of the medicine, and they can reproducibly manufacture the material to the same (or better) level of quality over time. Physical and chemical tests are performed in a rigorous fashion before any medicine can be released for human use. Such tests include chemical tests for purity and potency, dissolution behavior, moisture content; and often physical tests such as particle size (laser diffraction, sieve testing, etc.) and perhaps specific surface area. For drug product performance, typically dissolution testing is heavily relied upon because this testing most closely imitates how the product will perform in vivo, provided the drug product manufacturing process is robust.
For nano materials in the pharmaceutical industry, the need for this control strategy is even greater, specifically for the physical properties of the drug substance. The performance of the medicine is directly linked to these properties. These properties will maintain themselves only if the formulation is shown to be stable over the shelf life of the drug product. It is quite likely traditional CMC strategies will be augmented or changed to meet the more demanding needs of nano medicines, and more sophisticated physical tests will be required in the development of these compounds. Some of these techniques may also be used as quality control tests to release the medicine prior to human consumption.
This additional testing may require pharmaceutical companies to develop physical reference stands for nano medicines, much in the same way reference standards are used for potency and related substance testing today. Because drug product performance is linked to the drug substance particle size in the formulation, reference standards may be required for some physical property testing.
Summary
Nano medicines offer unique therapeutic advantages over their traditional counterparts by exhibiting unique properties such as enhanced solubility, selective cell targeting, and the ability to pass certain biological barriers and membranes. This enhanced performance/capability is linked directly to the physical properties of the material. No single test can provide an adequate description of the material. Great care must be taken to ensure that the sample preparation steps do not alter the material. Tests not used routinely in the pharmaceutical industry may provide the appropriate level of scrutiny to interrogate the material. It may become necessary to use some of these new techniques for quality control testing. Reference materials could be necessary to ensure that physical testing data are consistent and reliable for a given nano material.
References
- Pathak, Y. and D. Thassu, eds. Drug Delivery Nanoparticles Formulation and Characterization. 1 ed. Drugs and the Pharmaceutical Sciences, ed. J. Swarbrick. Vol. 191. 2009, Informa Healthcare: London. 394.
- Banker, G.S. and C.T. Rhodes, eds. Modern Pharaceutics. 4 ed. Drugs and the Pharmaceutical Sciences, ed. J. Swarbrick. Vol. 121. 2002, Marcek Dekker: London. 838.
- Xu, R., Particle Characterization: Light Scattering Methods. 2000, Dordrecht: Kluwer Academis Publishers. 397.
- Merkus, H., Partucle Size Measurements: Fundamentals, Practice Quality. Particle Technology Series. Vol. 17. 2009, New York: Springer. 532.
- ISO, 13321-1: Particle Size Analysis -- Photon Correleation Spectroscopy. 1996, International Standards Organization: Geneva.
- Iacocca, R.G., Physical Characterization Tests for API used in Low Dose Formulations, in Formulation and analytical development for lowdose oral drug products, J. Zheng, Editor. 2009, Wiley & Sons: New York. p. 309-324.
- Iacocca, R.G., C.L. Burcham, and L. Hilden, Particle engineering: A strategy for drug substance physical property control during small molecule development. J Pharm Sci, 2010. 99(1): p. 51-75.
- Fukunaka, T., et al., Dissolution characteristics of cylindrical particles and tablets. International Journal of Pharmaceutics, 2006. 310(1-2): p. 146.
- Horter, D. and J.B. Dressman, Influence of physicochemical properties on dissolution of drugs in the gastrointestinal tract. Advanced Drug Delivery Reviews, 1997. 25(1): p. 3-14
- Thomas Schreiner, U.F.S.H.L., Immediate drug release from solid oral dosage forms. Journal of Pharmaceutical Sciences, 2005. 94(1): p. 120-133.
- Jinno, J.-i., et al., Effect of particle size reduction on dissolution and oral absorption of a poorly water-soluble drug, cilostazol, in beagle dogs. Journal of Controlled Release, 2006. 111(1-2): p. 56.
- courtesy of D. Shekhawat
- http://www.futurity.org/health-medicine/drug-toting-mucus-busting-nanoparticles, Ben Tang and Mark Koontz/Johns Hopkins University
- http://en.wikipedia.org/wiki/File:Mesopourus_silica_closeup.jpg
- http://en.wikipedia.org/wiki/Double_layer_(interfacial)
Author Biography
Ronald Iacocca received his B. S., M.S. and Ph.D. in Materials Engineering from Rensselaer Polytechnic Institute (RPI). For nine years prior to joining Lilly, he was a faculty member in the Department of Engineering Science and Mechanics at The Pennsylvania State University. In November 2000, Ron joined Eli Lilly as a research scientist in Physical and Structural Characterization, Pharmaceutical Product Research and Development. Currently, he is a Senior Research Advisor in Analytical Sciences Research and Development, and is team leader of the Materials Science/Physical Characterization team. He has authored/co-authored over 65 journal articles, book chapters, and review articles, and has been granted 4 patents. He is a member of ASM International, ASTM, and ISO. In 2005, he was selected as one of ninety world-wide experts by the Bill and Melinda Gates Foundation to participate in the road-mapping initiative for the development of a world-wide malaria vaccine.
Dr. Iacocca also served as an adjunct professor in the Department of Industrial and Physical Pharmacy at Purdue University from 2006-2009, and serves as a member of the editorial advisory board for American Pharmaceutical Review, as a reviewer for the Journal of Pharmaceutical Sciences, as a key reader for Metallurgical and Materials Transactions A, and is head of the working group on laser diffraction for the International Standards Organization (Working Group 6, ISO TC24/SC4). In 2010, he was elected to the USP to serve on the Physical Analysis Expert Committee
This article was printed in the January/February 2011 issue of American Pharmaceutical Review - Volume 14, Issue 1. Copyright rests with the publisher. For more information about American Pharmaceutical Review and to read similar articles, visit www.americanpharmaceuticalreview.com and subscribe for free.