Abstract
Spectroscopic methods represent an innovative scheme for the analysis of in vitro processes. Raman spectroscopy offers significant advantages over other spectroscopies for bioprocess monitoring and was evaluated as a means of quantifying chemical changes in a dynamic Chinese Hamster Ovary (CHO) cell culture environment. Chemometric analyses of bioprocess data were carried out in accordance with process analytical technology (PAT) trends utilized previously in other industries. Partial least squares (PLS) calibration models were developed from off-line reference standards and in-line Raman data for a specific CHO cell culture process. In the interest of rapidly demonstrating feasibility of Raman as a PAT tool for biologics manufacturing, the modeling process was expedited through the use of an automated sampling system. The autosampler provided high quantities of calibration and validation set samples from two bioreactor batches. High-quality quantitative results were obtained for glucose, lactate, glutamine, glutamate, ammonium, osmolality and viable cell density. Preliminary work establishes Raman as an easily tailored method for in-line monitoring of active cell culture processes. Future work will focus on improving Raman models by improving reference method accuracy and building larger data matrices for robust calibration. Real-time, in-line monitoring and feedback-control of multiple critical CHO cell culture components is the ultimate goal.
Introduction
In an effort to control certain critical quality attributes of manufactured biologics and apply the FDA’s process analytical technology (PAT) initiative, industry is increasingly seeking means by which critical process parameters can be monitored and controlled in real-time (OPS-FDA 2004). The zenith of PAT tools would be a consistent, customizable and product-sparing method whose robustness increases with each usage. Raman spectroscopy depends on a rapid vibrational (physicochemical) spectroscopic effect in which the vibrations of chemical bonds within functional groups are measured and can therefore provide quantitative and descriptive data about the biochemical nature of a sample [12]. Because of this, Raman scattering presents an increased sensitivity to carbon-carbon bonds, the importance of which can not be overstated for use in the biological industry [2]. It offers a mix of beneficial attributes in a user-friendly technology with decades of proven value in various industries.
The cell culture broth used to culture Chinese Hamster Ovary (CHO) cells, as well as other common cell lines, provides an intricate ever-changing environment for cellular growth and development. This poses considerable challenges for prospective PAT methods. Raman has been successfully utilized to measure glucose, lactate, glutamine and ammonium and complex macromolecules in off-line samples [5, 8, 13, 23]. The technology relies on a light scattering phenomenon observed when a photon impinges upon an electron cloud of a chemical bond and is subsequently ejected. A Raman shift is observed only if the photon leaving the cloud has more (Anti-Stokes) or less (Stokes) energy than when it entered. Each net change in energy is indicative of specific chemical arrangements and can therefore be measured and correlated to the presence of specific constituents [14, 2]. Raman spectroscopy is uniquely suited for monitoring aqueous bioprocesses because it provides well-resolved vibrational fingerprints of various chemical constituents and is relatively insensitive to water. With aqueous solutions, water peaks dominate the spectra of similar technologies, such as absorbance infrared spectroscopy, and is exceptionally problematic in NIR because the interference is concentration dependent [12]. Raman does not face these difficulties with aqueous solutions primarily because water does not absorb laser irradiation nor attenuate the Raman scattered light [2;,10].
The data generated by a dispersive analyzer can be overwhelming in its volume and complexity, especially when working with basal media in a complex environment. It is for this reason that interpretation of Raman data for quantitative analysis of multiple cell culture constituents requires the use of chemometrics; i.e., an interdisciplinary science geared towards extracting important information from large quantities of chemical data. Chemometric analysis allows for the extraction of this meaningful data from a spectral input of high dimensionality through the use of multivariate calibrations [12, 10]. Bioprocess performance attributes evaluated using multiple instruments can be simultaneously analyzed using chemometric techniques. Factor-based quantitative methods for inverse least squares regression, specifically partial least squares (PLS), can be used to correlate in-line spectral changes to off-line measured values for multiple constituents. PLS cross-validation has the ability to adjust for highly variable backgrounds, reducing the need for background subtraction in order to improve prediction accuracy [4]. It achieves this by removing a single data point from the model building process and then applying the model to predict the point that was excluded. This is repeated for all data included in the reference set and the normalized total error of prediction for each excluded points serves as a measure of the predictability for the overall model. This PAT approach will enable real-time, quantitative analysis of complex cell culture environments.
The mathematics required to build PLS predictive models demands large quantities of data input to generate robust calibration and validation sample sets. Incorporating data from multiple repetitions increases model accuracy through the inclusion of normal process variation, but the effect may not continue to increase beyond a small set of representative batches [1]. Use of an automated sampling apparatus allows collection of samples in greater quantities than is feasible for conventional manually sampled bioreactors. Increased sampling frequency for off-line measurements combined with in-line Raman spectral acquisition offers the capability to develop predictive models using a single production run, and subsequent data sets can be easily included to address variability. This added flexibility and efficiency greatly enhances its appeal as a PAT tool in the development setting.
Experimental
Cell culture processes were carried out in a 200L stainless steel bioreactor. The medium chosen is a proprietary mixture in which a CHO cell line (Product D, Prod D) was inoculated and allowed to grow for 18 days. The cultures progressed within normal mammalian cell culture process ranges. Samples were removed every four hours from bioreactor batches (Run 1 and Run 2) using the automated sampling system and were stored in a refrigerated fraction collector. Samples were analyzed directly after collection, except where night samples were analyzed the following mornings. Bioreactor samples were analyzed off-line using a commercially available cell analyzer and two different brands of biosensors (referred to as Biosensor 1 and Biosensor 2) Biosensor 1 was used to gather nutrient, metabolite and osmolality data, while Biosensor 2 was specific to nutrient and metabolites. The cell analyzer measured viable and total cell densities.
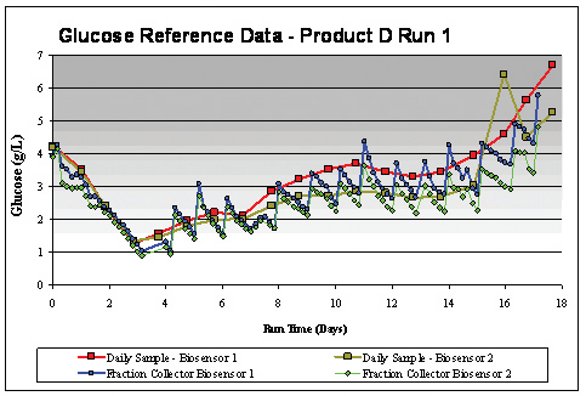
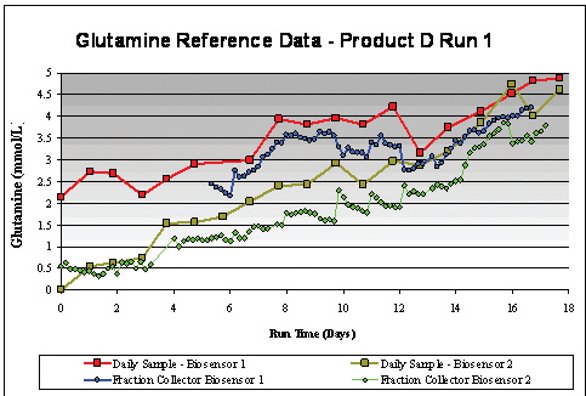
Figure 1- Comparison of off-line reference data from Biosensor 1 and Biosensor 2 for (A) glucose and (B) glutamine in Prod D Run 1. Samples collected manually from bioreactors are labeled “Daily Sample” and auto-collected samples are shown as “Fraction Collector.”
Analysis of historical and Product D CHO cell culture data has shown unexpected trends between comparative readings from similar instrumentation (e.g. Biosensor 1 vs. Biosensor 2 and two different cell analyzer models). Therefore, accuracy and precision expectations are currently under review. This review/examination is an important PAT step because any inaccuracies in the reference method will be carried over to the chemometric [14] method. Observations to date show that accuracy varies per constituent and batch-to-batch. For example, Figure 1 shows good agreement between Biosensor measurements for glucose, but poor agreement between glutamine readings. However, improved batch to batch agreement between glutamine reference data has been seen for other products (and in some cases worse agreement for glucose or other constituents). Experiments are currently being conducted to fully evaluate the error tolerances for the mentioned off-line reference methods and will be published in the near future.
Methods
A dispersive Raman analyzer with simultaneous spectral coverage from 200-3400 cm-1 was used to collect all Raman spectra. Choosing an appropriate laser wavelength requires a tradeoff between sensitivity and fluorescence interference. This is because as laser wavelength increases, fluorescence interference decreases along with sensitivity while a decrease in wavelength results in higher sensitivity to both scattering and fluorescence [2]. A wavelength of 785nm was chosen for this investigation because it represents the optimal balance between these factors and a silicon CCD multi-element camera was used for detection. In order to monitor the CHO cell culture batches in-line, a fiber optically coupled immersion probe was inserted directly into the bioreactor and secured in place with a standard adapter. Reaction monitoring software was used to collect all Raman spectra. Spectra were collected approximately every hour throughout the course of each batch using a 10-minute spectral collection interval and one second exposures.
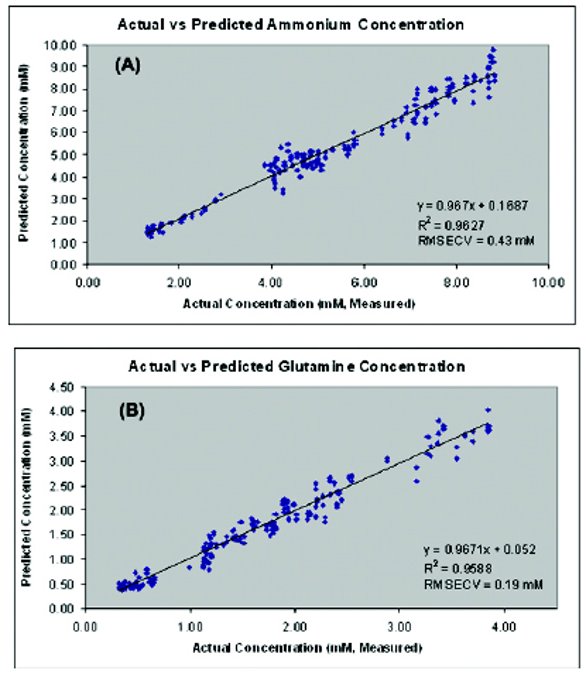
Figure 2- Calibration results showing actual vs predicted (A) ammonium and (B) glutamine concentrations from PLS leave-2- out cross-validation models
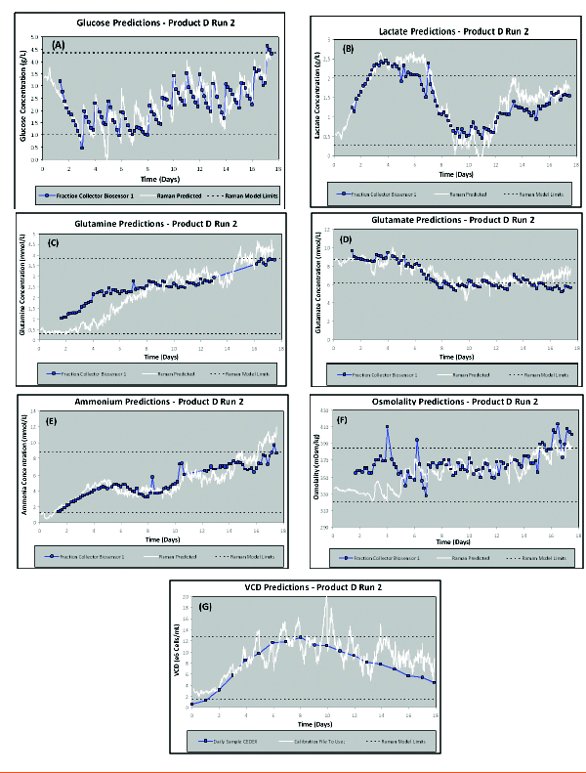
Figure 3-Raman model validation results. Comparison of measured (blue) and Raman predicted (white) values for (A) glucose, (B) lactate, (C) glutamine, (D) glutamate, (E) ammonium, (F) osmolality, and (G) VCD.
A commercially available chemometrics software package was used for all modeling steps. Multivariate PLS calibration models were developed from lab reference standards (analyzed off-line) and in-line process Raman data from Product D Run 1. Individual PLS models were created for each constituent: glucose, lactate, glutamine, glutamate, ammonium, osmolality, and viable cell density (VCD). Automated sampling (fraction collector) data was not available for VCD so only daily VCD samples were used for the Prod D VCD calibration set, which limited the data set to 72 points. Product D Run 2 data were used to validate Raman models by comparing Raman predictions to measured reference values. The following steps were used to create and validate Raman PLS models:
- Created calibration sets for each constituent by matching off-line reference data to Raman spectra collected before and after a sample was removed from the bioreactor (two Raman spectra per sample) for Product D Run 1.
- Selected model spectral regions and pretreated all spectra. Several different regions and types of pretreatments were investigated per constituent.
- Performed PLS1 cross-validation, assessing two sequential samples per cross-validation cycle rather than a single sample in order to assess duplicates together.
- Used Predicted Residual Error Sum of Squares (PRESS) and Principal Component (PC) Scores plots to determine the appropriate number of factors.
- Removed and/or leveraged any concentration or spectral outliers and repeated steps 3-4.
- Recorded model coefficient of determination (R2) and rootmean- squared error of cross-validation (RMSECV) and saved the top performing models for each constituent. Results for select constituents are shown below in Figure 2.
- Applied models created in step 6 to Product D Run 2 spectra (validation set). Plotted predicted versus measured values over time and calculated root-mean-squared error of prediction (RMSEP) for the top performing models. Raman predictions are overlaid with measured values in Figure 3 and summaries of all model results are shown in Table 1.
Table 1-Table of Analysis Methods for Moisture End Point Determination
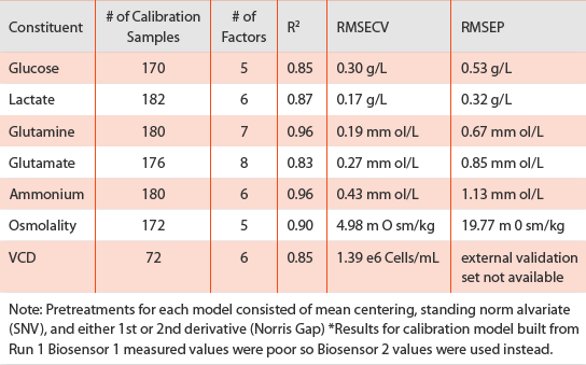
Conclusion
Process Raman spectroscopy has demonstrated its value in numerous applications spanning many industries and shows promise for biological manufacturing. The data presented here reveal that Raman, coupled with an automated sampling system and chemometric analyses, provides a means to quantify key CHO cell culture components in-line and in real-time. This is evidenced by the high coefficients of determination (R2) and low root-mean-squared errors of cross-validation (RMSECV) for initial models developed from one CHO cell culture batch (Product D, run 1). Models were developed for glucose, lactate, glutamine, glutamate, ammonium, osmolality, and viable cell density. The root-mean-squared errors of prediction (RMSEP), calculated from Raman model predictions using Product D run 2 spectra, are also encouraging. Repetition of comparable culture processes is a key component of validation and future analyses will aim to show that larger, more robust data sets decrease Raman model error. It is hypothesized that Raman model prediction errors can be reduced to approach the theoretical limits of precision and accuracy for the corresponding off-line reference method. The VCD data shows the limitations experienced without the benefit of an auto sampling system, and therefore the great value it provides. Research is ongoing with the immediate aim of implementing robust Raman models in production bioreactors to offer in-line quantitative monitoring of key components. Future research will focus on using process Raman data for closed-loop optimization and feedbackcontrol of cell culture processes, to reach the ultimate goals of reduced grab sampling and increased product yields. Overall, research to date shows that the combination of process Raman spectroscopy, automated sampling, and chemometrics serve as a practical, customizable solution to the FDA’s PAT initiative for bioprocess monitoring.
Acknowledgements
The authors would like to thank Lindsey Ingram from Biogen Idec for her diligent maintenance and management of the autosampling system.
References
- Abu-Absi, N. R., Kenty, B. M., Cuellar, M. E., Borys, M. C., Sakhamuri, S., Strachan, D. J., Li, Z. J. (2010). Real time monitoring of multiple parameters in mammalian cell culture bioreactors using an in-line Raman spectroscopy probe. Biotechnol Bioeng.
- Adar F, Geiger R, Noonana J. 1997. Raman Spectroscopy for Process/ Quality Control. Appl Spectrosc Rev, 31(1&2) 45-101.
- Archibald DD, Kays SE, Himmelsbach DS, Barton FE. 1998. Raman and NIR spectroscopic methods for determination of total dietary fiber in cereal foods: A comparative study. Appl Spectrosc 52:22–31.
- Berger, A. J., Wang, Y., & Feld, M. S. (1996). Rapid, noninvasive concentration measurements of aqueous biological analytes by nearinfrared Raman spectroscopy. Appl Opt, 35(1), 209-212.
- Cannizzaro, C., Rhiel, M., Marison, I., & von Stockar, U. (2003). Online monitoring of Phaffia rhodozyma fed-batch process with in situ dispersive Raman spectroscopy. Biotechnol Bioeng, 83(6), 668-680.
- Card C, Hunsaker B, Smith T, Hirsch J. 2008. Near-infrared spectroscopy for rapid, simulatneous monitoring of multiple components in mammalian cell culture. BioProcess International 6(3):58-67.
- Cooper JB, Wise KL, Welch WT, Sumner MB, Wilt BK, Bledsoe RR. 1997. Comparison of near-IR, Raman, and mid-IR spectroscopies for the determination of BTEX in petroleumfuels. Appl Spectrosc 51:1613–1620.
- Enejder, A. M., Koo, T. W., Oh, J., Hunter, M., Sasic, S., Feld, M. S., & Horowitz, G. L. (2002). Blood analysis by Raman spectroscopy. Opt Lett, 27(22), 2004-2006.
- Everall NJ, Chalmers JM, Ferwerda R, Vandermaas JH, Hendra PJ. 1994. Measurement of poly(aryl ether ether ketone) crystallinity in isotropic and uniaxial samples using fourier-transform Raman-spectroscopy— A comparison of univariate and partial least-squares calibrations. J Raman Spectrosc 25:43–51.
- Li, B., Ryan, P. W., Ray, B. H., Leister, K. J., Sirimuthu, N. M., & Ryder, A. G. (2010). Rapid characterization and quality control of complex cell culture media solutions using raman spectroscopy and chemometrics. Biotechnol Bioeng, 107(2), 290-301. Massart D, Vandeginste BGM, Buydens LMC, De Jong S, Lewi PJ, Smeyers- Verbeke J. 1997. Handbook of chemometrics and qualimetrics: Part A. Amsterdam: Elsevier.
- McGovern AC, Broadhurst D, Taylor J, Kaderbhai N, Winson MK, Small DA, Rowland JJ, Kell DB, Goodacre R. 2002. Monitoring of complex industrial bioprocesses for metabolite concentrations using modern spectroscopies and machine learning: Application to gibberellic acid production. Biotechnology and Bioengineering 78(5):527-538.
- Mungikar A, Kamat M. 2010. Use of In-Line Raman Spectroscopy as a Non-Destructive and Rapid Analytical Technique to Monitor Aggregation of a Therapeutic Protein. American Pharmaceutical Review. Nov/Dec, 78-83. 1
- Raman CV, Krishnan KS. 1928. A New Type of Secondary Radiation. Nature. 121, 501-502.
- Shimoyama M, Maeda H, Matsukawa K, Inoue H, Ninomiya T, Ozaki Y. 1997. Discrimination of ethylene vinyl acetate copolymers with different composition and prediction of the vinyl acetate content in the copolymers using Fourier-transform Raman spectroscopy and multivariate data analysis. Vib Spectrosc 14:253–259.
- Sivakesava S, Irudayaraj J, Ali D. 2001a. Simultaneous determination of multiple components in lactic acid fermentation using FT-MIR, NIR, and FT-Raman spectroscopic techniques. Process Biochemistry 37(4):371-378.
- Sivakesava S, Irudayaraj J, Demirci A. 2001b. Monitoring a bioprocess for ethanol production using FT-MIR and FT-Raman spectroscopy. Journal of Industrial Microbiology and Biotechnology 26(4):185-190.
- Sohn M, Himmelsbach DS, Kays SE, Archibald DD, Barton FE. 2005. NIRFT/ Raman spectroscopy for nutritional classification of cereal foods. Cereal Chem 82:660–665.
- Tsuchihashi H, Katagi M, Nishikawa M, Tatsuno M, Nishioka H, Nara A, Nishio E, Petty C. 1997. Determination of methamphetamine and its related compounds using Fourier transform Raman spectroscopy. Appl Spectrosc 51:1796–1799.
- Vandeginste BGM, Massart D, Buydens LMC, De Jong S, Lewi PJ, Smeyers- Verbeke J. 1998. Handbook of chemometrics and qualimetrics: Part B. Amsterdam, NY: Elsevier.
- Vickers TJ, Mann CK. 1991. Quantitative analysis by Raman spectroscopy. In: Bulkin BJ, Grasselli JG, editors. Analytical Raman Spectroscopy. Chemical Analysis volume volume 114. New York: John Wiley and Sons, Inc p. 107–135.
- Williams KPJ, Everall NJ. 1995. Use of micro-Raman spectroscopy for the quantitative-determination of polyethylene density using partial least squares calibration. J Raman Spectrosc 26:427–433.
- Xu Y, Ford JF, Mann CK, Vickers TJ, Brackett JM, Cousineau KL, Robey WG. Raman measurement of glucose in bioreactor materials. In: Vo-Dinh T, Lieberman RA, Vurek GG, Katzir A, editors. Proceedings of Biomedical Sensing, Imaging and Tracking Technologies II; 1997; San Jose, CA. p 10-19.
Author Biographies
Justin Moretto has a BS in neuroscience from East Carolina University and is currently a master’s candidate at Johns Hopkins University in the Biotechnology department. He has been with Biogen IDEC for the last two years and his current role is an Associate Scientist II in the biopharmaceutical development pilot plant.
Brandon Berry, a senior at North Carolina State University in Chemical Engineering with a concentration in biomanufacturing, is also working concurrently as a 12 month full-time co-op in Cell Culture Development at Biogen Idec. He also serves as the President of the NCSU affiliate of the International Society of Pharmaceutical Engineering.
John Paul Smelko, senior scientist in technical development for Biogen Idec (RTP, NC). He is responsible for cell culture pilot scale operations and new technology development for biotechnology applications. Presently, he is investigating Raman spectroscopy to monitor/control mammalian cell culture processes. Mr. Smelko received a BS in chemical engineering at University of Arkansas.
This article was printed in the April 2011 issue of American Pharmaceutical Review - Volume 14, Issue 3. Copyright rests with the publisher. For more information about American Pharmaceutical Review and to read similar articles, visit www.americanpharmaceuticalreview.com and subscribe for free.