Abstract
Infrared and Raman spectra of different crystalline forms of the same organic compound can be used to identify a pure crystal form and quantify a mixture of two forms. Many organic compounds have one or more crystalline or polymorphic forms. The observed differences in the spectra of different polymorphs include changes in frequencies, relative intensities, band contours and the number of bands. Causes of the spectral differences can be interpreted in terms of molecule-molecule interactions in the crystal unit cells. Molecular interactions can distort the shape of a molecule at its site in the unit cell. Moreover, vibrations of one or more molecules can couple in such a way as to increase the number of bands and shift their frequencies. Herein, spectral changes are explained using a hypothetical three-atom molecule and a real five-atom molecule. Finally, the differences in spectra of large molecules are demonstrated with polymorphs of three active pharmaceutical ingredients (API).
Introduction
Many organic solids have several crystalline forms referred to as polymorphs. Generally, one crystalline form is more stable under ambient conditions, but some exist as meta-stable forms that gradually convert to a more stable form. Experimental conditions for nucleation and crystal growth can play an important role in determining the crystalline form. These experimental conditions include the composition of the solvent, degree of saturation, temperature, pressure and seeding. Some crystalline forms are much easier to produce or re-produce than others.
Experimental evidence for identifying the polymorphic form of an active pharmaceutical ingredient is required for FDA approval, since the crystal structure can affect the bioavailability and stability of the product. The polymorphic form is also used extensively for patent protection. Typically, the crystalline form is identified by X-ray diffraction and vibrational spectra, i.e., infrared and Raman spectra. There are numerous early publications [1-3] demonstrating the methodology for using vibrational spectra to characterize polymorphs. Over the last decade there been an increase number of reports on using these spectra to identify pharmaceutical polymorphs either in the pure form [4-15] or as mixtures [16-25].
Vibrational spectra of polymorphs are reproducible and characteristic of the crystalline form. The goal of this report is to provide a basic understanding of the causes for different vibration spectra of polymorphic crystals and to demonstrate differences in the spectra of active pharmaceutical ingredients (API). We will consider some very simple simulated crystals and their corresponding spectra before going to the more complex spectra of large, organic molecules.
Vibrational Spectra
Absorptions or emissions of radiation in the infrared region of the electromagnetic spectrum are due to changes in the internal vibrations of a molecule. Infrared radiation consists of electromagnetic waves, which alternate between a plus and minus signals. This alternating field of plus/minus charge can interact with a molecule, if the frequency of the field and some resonant frequency of the molecule are the same. This interaction can only take place if the resonant part of the molecule has a distribution of charge, which can interact with the alternating electromagnetic field. For example, the HCl molecule has a plus end (the hydrogen) and a minus end (the chlorine). We think of these two atoms being held together by a spring. If an alternating electromagnetic field has a frequency that matches the resonant frequency of HCl, the molecules will absorb the radiation at that frequency and vibrate faster. Basically, the positive part of the electromagnetic wave will repel the H atom and the negative part will repel the Cl atom, whereas during the next half-wave the negative part of the wave will attract the H atom and the positive part will attract the Cl atom. Thus, there are two basic requirements for the interaction of infrared radiation with vibrations: the radiation must match the resonance frequency of the molecule and there must be a change in the dipole moment of the molecule allowing for the interaction.
The complimentary technique of Raman spectroscopy allows for the interaction of radiation with a molecule in an entirely different manner. Molecules are subjected to a monochromatic light source such as that emitted by a laser at a frequency (or energy) much higher than the resonant vibrational frequencies of a molecule. A high frequency (high energy) photon momentarily distorts the electron distribution and is absorbed by the molecule. The molecule then releases a photon having the same or a lower frequency (i.e., lower energy). The lower frequency photon is referred to as Raman scattering; in this case, the molecule retains some of the energy of the original photon and ends up in a higher vibrational level. The requirement for Raman interaction is that the new vibrational state exhibits a change in the size or shape of the electron distribution within the molecule. All diatomic molecules can exhibit Raman scattering since the electron distribution changes in size during a vibration, whereas only heteronuclear diatomic molecules can have an infrared absorption since they have dipole moments and can interaction with infrared radiation.
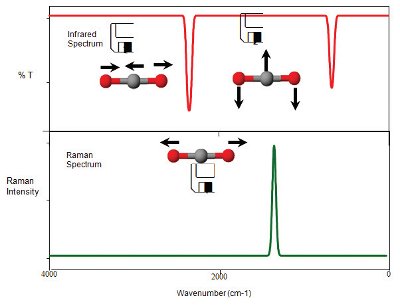
Figure 1 - Infrared and Raman spectra of a hypothetical, free CO2 molecule. (Each band in a gas phase spectrum of free CO2 molecules would exhibit a series of closely space, sharp lines due to rotational transitions. Our hypothetical example ignored the rotation transitions so that the molecule exhibits only single bands due to vibrational transitions.)
Carbon dioxide (CO2) is one of the simplest molecules for understanding the interaction of radiation with vibrations of a polyatomic molecule. CO2 has three normal vibrational modes; the symmetric stretching vibration (ν1), the asymmetric stretching vibration (ν3) and the bending vibration (ν2). CO2 does not have a dipole moment, since it is linear and symmetrical about the central carbon atom. However, the asymmetric stretch and the bending vibrations represent changes in the dipole moment, since the oxygen atoms are more electronegative than carbon and the motions cause a change in the dipole moment. These vibrations will absorb infrared radiation as is shown in the top of Figure 1. The symmetric stretching vibration (ν1) does not represent a change in dipole moment, but it does represent a change in the size of the molecule (the size changes with each vibration) and this gives rise to a Raman active vibration due to changes in polarization of the electron cloud. In gas phase spectra of CO2, two infrared bands are observed at 2350 and 667 cm-1 and a single Raman band at ~1300 cm-1 (the latter band is actually a doublet due to quantum mechanical resonance effects, which is beyond this discussion).
Vibrational Spectra of Crystals

Figure 2 - Infrared and Raman spectra of CO2 having molecular symmetry of D4h compared with spectra of CO2 having site symmetry of C2v.
Vibrational spectra of molecules in the gas phase are characteristic of the free molecules and exclude any interactions. There are two potential effects on a molecule when it is condensed into an ordered crystalline phase. First, each of the molecules may be distorted due to interactions with nearest neighbor molecules. This distortion can change the symmetry of the molecule, which in turn can alter the spectral features. The symmetry of a molecule in the crystalline phase is referred to as the site symmetry, since it is reflective of the site where the molecule sits in the crystal structure. The site symmetry may be the same as the symmetry of a free molecule or of lower symmetry. A hypothetical example of this is shown for CO2 in Figure 2. The free CO2 in the gas phase is a linear molecule with symmetry D4h. As a consequence of this symmetry, the infrared spectrum has two active bands and the Raman spectrum one active band. In the hypothetical case, the forces on each molecule in the crystalline phase are such that the molecule is bent and its site symmetric becomes C2v. As a consequence of this lower symmetry, all three vibrations become infrared active and all three become Raman active as shown on the bottom of Figure 2. It should be noted that the vibrational modes that become active due to the symmetry change are rather weak indicating that the distortion is not large; however, it is large enough to make the modes active.

Figure 3 - a) Normal vibrations of a CO2 molecule at a C2v site. In-phase and out-of-phase vibrations of 2 coupled CO2 molecules with C2v factor symmetry. b) Infrared and Raman spectra of hypothetical CO2 molecules with C2v site symmetry and showing the spectra changes when a coupled pair of these hypothetical molecules has C2v factor symmetry.
The second effect observed in the vibrational spectra of a crystalline phase is due to coupling of the vibrations of two or more molecules in a unit cell, i.e., the vibrational mode of one molecule can be in-phase or out-of-phase with that of neighboring molecules. This in-phase or out-of-phase condition can produce slightly different vibrational frequencies. Again, a hypothetical example of CO2 is used to demonstrate this effect as shown in Figure 3. The hypothetical site symmetry for CO2 is C2v. In this example, two CO2 molecules are in the same plane (plane of the paper) with one molecule lying slightly above the other. The symmetry of the combined twosome is referred to as the factor symmetry and, in this case, would also be C2v. For each of the three normal modes of vibration (i.e., resonant frequencies), the two adjacent CO2 molecules can vibrate in-phase or out-of-phase as shown in the bottom of Figure 3a. The out-of-phase vibrations would require slightly more energies to activate and their frequencies would be slightly higher than those for the in-phase vibrations. The effect of this hypothetical coupling is shown in the bottom spectrum in Figure 3b. The symmetric and asymmetric stretching vibrations are shown as completely split with relative intensities of the doublets corresponding to potential changes in the dipole moments in the infrared spectra and polarizabilities in the Raman spectra. The bending mode at 667 cm-1 does not show two peaks but rather a weak shoulder on the low frequency side of the Raman band and on the high frequency side of the infrared band. The latter perturbation simply shows that the splitting can be small and result in a change in the band contour rather than the splitting into doublet or other multiples of a peak.

Figure 4 - a) In-phase and out-of-phase vibrations of 2 coupled CO2 molecules having C2v site symmetry and C2h factor symmetry.
b) Infrared and Raman spectra of coupled CO2 molecules with C2v factor symmetry compared coupled CO2
Another possibility for the factor group symmetry of this hypothetical CO2 is for the two adjacent molecules in the unit cell to lie in opposite directions in two parallel planes perpendicular to the plane of the paper as shown in Figure 4a. The symmetry of the factor group changes from C2v to C2h. Consequently, the spectrum changes as shown in Figure 4b, since there is now a center of symmetry for the twosome pair. All three vibrations of the CO2 molecule are active in both the infrared and Raman spectra. However, due to the center of symmetry in the factor group, the splitting is such that one component of each pair is active in the infrared spectrum and the other component in the Raman spectrum. This effect is shown by the vertical lines, which pass through the Raman active bands in the C2h factor group and the corresponding band in the to C2v group. In an actual example, the frequencies of the corresponding bands will likely shift from one factor group to another; they are shown at the same frequencies in this hypothetical example simply to point out the component of each doublet that change with the symmetry.

Figure 5 - Infrared and Raman spectra along with corresponding crystal structures for Form I and Form II of methylene iodide, CH2I2.
The goal of early investigations of the vibrational spectra of polymorphs was to use the spectra to determine the structure or symmetry of crystals. A typical example is the two polymorphic forms for methylene iodide [26,27], CH2I2, shown in Figure 5. Infrared and Raman spectra of polycrystalline films of the two forms were used to predict the orthorhombic and monoclinic structures shown on the right side of the figure. The appearance of new bands and frequency changes from the spectra of gaseous methylene iodide, made it possible to predict the site and factor symmetry (unit cell symmetry) for each of the polymorphs. The spectra indicate that the molecules in Form I have the same site symmetry as the free gas-phase molecule (C2v symmetry), whereas the site symmetry in Form II crystals was distorted to the point that the molecule does not possess any elements of symmetry (i.e., C1 symmetry). The factor group symmetry in the Form II crystals is C2h which indicates that there is a center of symmetry and as such infrared bands will not be Raman active and Raman bands will not be infrared active. Large pharmaceutical molecules would likely have little or no symmetry in the free-state or at the crystalline site; however, the vibrations could couple in such a way so as to have higher factor group symmetry like the example of methylene iodide Form II crystals. Thus, we might anticipate finding different number of bands, different intensities and different frequencies from one crystal to another.
Spectra of Pharmaceutical Polymorphs
Many, if not most, active pharmaceuticals have two or more polymorphic forms. X-ray diffraction and spectroscopic techniques are used to identify pure forms and mixtures of polymorphs. In some cases, X-ray and/or vibrational spectra can provide a clear distinction between polymorphic forms. Ideally, it is also desirable to have spectral data in which each polymorph has a distinctive peak that is not overlapped or interfered with by a peaks from other form(s). Not only is this useful for identifying a particular form, but also for detecting the presence of minor amounts of one polymorph contaminating another form. This latter goal is very important for patent litigation cases. Herein, we will consider the spectra of two polymorphic forms for each of three pharmaceuticals.

Figure 6 - Infrared and Raman spectra of two polymorphs of an API
Infrared and Raman spectra of A and E forms of an API are shown in Figure 6. This molecule contains three –OH groups, one NH and one C=O. These three groups are characterized in the infrared spectra by the OH and NH stretching vibrations at about 3425 and 3300 cm-1 and the C=O at ~1720 cm-1. The CH stretch vibrations at ~3000 cm-1 are more pronounced in the Raman spectra as are the ring modes in the 1250 to 1550 cm-1 region.
In the infrared and Raman spectra of this API shown in Figure 6, there are major differences between the spectra of A and E forms. Two strong infrared bands between 1050 and 1150 cm-1 characterize the A form, whereas these two bands are absent in the infrared spectra of the E form and are replaced by a very strong band at 1025 cm-1. In the Raman spectrum, the E form has a very sharp band at 835 cm-1, which does not appear in the spectrum of the A form. Moreover, the E form has a series of four strong-weak doublets in the Raman spectrum between 1250 and 1550 cm-1. The A form also has a number of Raman bands in this same region, but the intensities are random. The A form has a doublet in the C-H stretching region just above 2900 cm-1, which is replaced by a single band in the spectrum of the E form. Thus, both the infrared and Raman spectra have a number of different patterns for identifying the two polymorphs of this API.
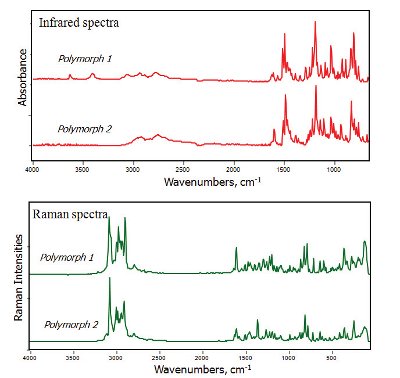
Figure 7 - Infrared and Raman spectra of Polymorph I and Polymorph II of an API.
Infrared and Raman spectra of two polymorphs of another API are shown in Figure 7. This drug has been involved in a patent infringement case. The infrared spectra of these two polymorphic forms are reasonable similar except for the two O-H stretching bands at 3410 and 3650 cm-1 in the spectrum of polymorph 1, which is a hemihydrate. There are a number of relative intensity differences in the infrared fingerprint region below 1700 cm-1 and especially between 800 and 900 cm-1. The Raman spectrum of the two polymorphs are different in the C-H stretching region at ~3000 cm-1, at 1600 cm-1 and ~800 cm-1 Again, there are many small pattern differences in the Raman spectra below 1700 cm-1. With the exception of the difference in the O-H region the Raman differences are greater than the pattern differences between the infrared spectra.
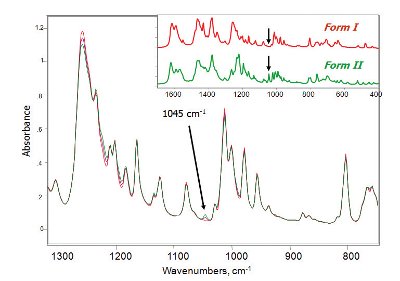
Figure 8 - (Insert) Infrared spectra of the Form I and Form II polymorphs of another API. Three spectra of Form I containing 0, 5 and 10% of Form II demonstrating the unique band for Form II at 1045 cm-1.
The last example is that of another API that was the subject of several patent infringement cases. The pharmaceutical had two polymorphic forms referred to as Form I and II. The patent on Form I expired first, while the patent on Form II was in effect for an additional 7 years. Litigations involved the abilities of the generic companies to produce pure Form I without any hint of Form II. The original patents on Form I and Form II relied on the infrared spectra of the two forms measured as nujol mulls (dispersions in a hydrocarbon media) and X-ray diffraction. The infrared spectra of the two pure forms are shown in the upper right of Figure 8. The spectral patterns in the fingerprint region are different and it is easy differentiate the two pure forms. However, most of the bands in the infrared fingerprint region between 600 and 1600 cm-1 are overlapped by bands of the other polymorph. The only characteristic band without interference is the single peak at 1045 cm-1 in the spectrum of Form II.
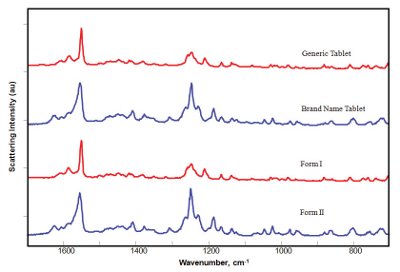
Figure 9 - Raman spectra in the fingerprint region of the Form I and Form II polymorphs compared with spectra of a generic tablet and a brand name tablet.
Thus, the litigation involved the ability or inability to detect this band of Form II in a high concentration of Form I. Infrared spectra of Form I containing 0, 5 and 10% of Form II are shown in the main body of Figure 8. The 1045 cm-1 band in the 5% sample is obvious, but what is the limit of detecting this band? The limit of detection really depends upon the signal to noise ratio and the ability to prepare standard solid mixtures at very low concentrations. Examples of the Raman spectra [17] of the two polymorphic forms of this API are compared to tablets marketed as generic and brand name in Figure 9. The brand name tablet clearly contains Form II, whereas the generic tablet is clearly Form I.
Conclusions
Infrared and Raman spectra of the polymorphic forms of large pharmaceutical molecules can used to identify the form. Information regarding the particular crystalline structures can be obtained for smaller molecules, but the molecular structures are too complex for larger pharmaceuticals and little useful structure information can be obtained from the spectra. However, the causes for spectral differences in vibrational spectra of polymorphs are the same for large pharmaceuticals as they are for small organic molecules. The changes in the spectra from one polymorph to another are due to interactions of molecules with neighboring molecules. Attractions and repulsions of different chemical functional groups can change the intensities and frequencies of bands. Moreover, attractions can lead to coupling of molecules, which can alter the number and frequencies of bands due to in-phase and out-of-phase conditions. The goal of this report was to review the causes for differences in the vibrational spectra of polymorphs of the same molecule. These differences can be used to identify the form of the polymorph and, in many cases, used to quantify the composition of mixtures.
References
- W.G. Fateley, F.R. Dollish, N.T. McDevitt and F.F. Bentley, Infrared and Raman Selection Rules for Molecular and Lattice Vibrations: The Correlation Method, John Wiley-Interscience, New York (1972).
- M.J. Pelletier, Analytical Applications of Raman Spectroscopy, Blackwell Publishing, New York, (1999).
- J.R. Ferraro, K. Nakamoto, and C.W, Brown, Introductory Raman Spectroscopy, 2nd Ed., Academic Press, New York (2003).
- S. Ahuja and S. Scypinski, Handbook of Modern Pharmaceutical Analysis, Academic Press, Boston (2001).
- J. Bernstein, Polymorphism in Molecular Crystals, Oxford University Press, London, (2002).
- R. Hilfiker, Polymorphism: In the Pharmaceutical Industry, Wiley-VCH, New York, pp 95- 138 (2006).
- S. Wishkerman and J. Bernstein, “Characterization of the polymorphs of aminoacetonitrile hydrochloride and crystal structure of the stable polymorph,” Cryst.Eng.Comm., 8, 245 - 249, (2006).
- A.P. Ayala, “Polymorphism in drugs investigated by low wavenumber Raman scattering” Vibn. Spec., 45, 112-116 (2007).
- H. Lee, K. Kimura, T. Takai, H. Senda, A. Kuwae and K. Hanai., Polymorphism of phenylpyruvic acid studied by IR, Raman and solid state 13C NMR spectroscopy,“ Spectrochim. Acta, 55, 2877-2882 (1999).
- A. L. Enculescu and J. R. Steiginga, “Raman Spectroscopy -- A Powerful Tool for Non-Routine Analysis of Pharmaceuticals,” Amer. Pharm. Rev., 5(1), 81-89, 2002.
- L. G. Tensmeyer and M. A. Heathman, “Analytical applications of Raman spectroscopy in the pharmaceutical field,” Trends Anal.. Chem., 8(1), 19-24, 1989.
- S. Folestad and J. Johansson, Raman Spectroscopy: A Technique for the Process Analytical Technology Toolbox, Amer. Pharm. Rev., 7(1), 82-87 2004.
- S. Wartewig and R. H.H. Neubert, “Pharmaceutical applications of Mid-IR and Raman spectroscopy,” Adv. Drug Del. Rev., 57(8), 1144-1170, 2005.
- W. P. Findlay and D. E. Bugay, “Utilization of Fourier transform- Raman spectroscopy for the study of pharmaceutical crystal forms,” J. Pharma.Biomed. Anal., 16, 921-930, 1998.
- S. Lowry, D. Dalrymple, A. Song, V. Rosso, C. Pommier and J. Venit, “Integrating a Raman Microscope into the Workflow of a High-Throughput Crystallization Laboratory,” J. Assoc. Lab. Auto., 11, 75-84, 2006.
- S. Pfeffer, “Application of FT-Raman and FT-IR Spectroscopy in Pharmaceutical Development,” Amer. Pharm. Rev., 7(5), 48-53, 2004.
- L.S. Taylor and F.W. Langkilde, “Evaluation of solid state forms present in tablets by Raman spectroscopy,” J. Pharm. Sci, 89, 1342-1353 (2000).
- S.C. Brown, M. Claybourn and V. Fawcett “Optimising Raman Spectroscopy to Quantify Polymorphic Forms of a Drug Molecule,” Amer. Pharm. Rev., 10(5), (2007).
- Susan Barnes, Jason Gillian, Ann Diederich, Delphi Burton and Darryl Ertl, “In Process Monitoring of Polymorphic Form Conversion by Raman Spectroscopy and Turbidity Measurements”, Amer. Pharm. Rev,, 11(2), (2008).
- Y. Hu, H. Wikström, S.R. Byrn and Taylor,”Estimation of the transition temperature for an enantiotropic polymorphic system from the transformation kinetics monitored using Raman spectroscopy,” J. Pharm. Biomed. Anal., 45(4), 546-551 (2007)
- J.K. Liang , S.R. Byrn , A. Newman , J. Stults and V. Smolenskaya, “On-line Raman spectroscopy in pharmaceutical process development: application and future prospects,” Amer. Pharm. Rev. 10(4), 45-51 (2007)
- Y. Hu, H. Wikström, S.R. Byrn and L.S. Taylor, “Analysis of the effect of Particle size on Polymorphic Quantitation by Raman Spectroscopy,” Appl. Spectros., 60(9), 977-984 (2006).
- R. Szostak and S. Mazurek, “FT-Raman quantitative determination of ambroxol in tablets,” J. Mole. Struc., 704(1-3), 229-233, 2004.
- L. Zhang, M. J. Henson and S. Sekulic, “Multivariate data analysis for Raman imaging of a model pharmaceutical tablet,” Anal. Chim. Acta, 545(2), 262-278, 2005.
- C. Saal, “Quantification of Polymorphic Forms by Raman Spectroscopy,” Amer. Pharm. Rev., 9(4), 76-81, 2006
- M.P. Marzocchi, V. Schettino and S. Califano, “Infrared Spectrum of Crystalline CH2I2. Crystal Structure and Phase Transition,” J. Chem. Phys., 45, 1400-1404 (1966).
- C.W. Brown, R.J. Obremski, J.R. Allkins and E.R. Lippincott, “Vibrational spectra of the polymorphic solids of methylene iodide,” J. Chem. Phys. 49, 4806 48l2 (l968).
Author Biographies
Michael Donahue is currently an application scientist at Real-Time Analyzers, Inc. in Middletown, CT. His research is concerned with in-vivo resonance Raman and computation methods to handle streaming spectra. His areas of interest include polymorphism, counterfeit analysis, process analytics, and chemometrics. He obtained his Ph.D. degree in analytical chemistry from the University of Rhode Island.
Edita Botonjic-Sehic is a lead scientist and program manager for technology development at Morpho Detection, Safran Group in Wilmington, MA. She obtained her BS degree in chemistry and mathematics from Assumption College and her Ph.D. in analytical chemistry from the University of Rhode Island. She was an intern scientist at Digilab, LLC and an application scientist at Axsun Technologies. More recently, she was a principal scientist for process analytical technology (PAT) at GlaxoSmithKine and a lead principal scientist for implementation of Pat at Barr Pharmaceutical/TEVA Pharmaceutical.
David Wells is currently is a Senior Manager of Chemistry working in MassBiologics in the Quality Control Department. He leads a team providing quality services to assure that MassBiologics products are of the highest quality possible. His areas of interest include method development in spectroscopy and chromatography supporting pharmaceutical material discovery, development, and manufacturing. Dr Wells has previously worked at MacrChem in transdermal drug development and Synta Pharmaceutical in drug product formulation and development. He received in Ph.D. in analytical chemistry from the University of Rhode Island.
Chris W. Brown is Professor Emeritus in Analytical Chemistry at the University of Rhode Island. His research interests are focused on the applications of optical spectroscopy. He was an NIH post-doctoral fellow at the University of Maryland, holds a Ph.D. from the University of Minnesota, and M.S./ B.S. degrees from Xavier University. He has 150 journal publications, 8 book chapters and one book.
This article was printed in the March 2011 issue of American Pharmaceutical Review - Volume 14, Issue 2. Copyright rests with the publisher. For more information about American Pharmaceutical Review and to read similar articles, visit www.americanpharmaceuticalreview.com and subscribe for free.