Introduction
Pharmaceutical industry and federal agencies are finding ways globally to counteract the increasing threats caused by pharmaceutical counterfeiting [1]. Recent estimates are that perhaps 15% of pharmaceutical drugs world-wide are counterfeited [2]. Several technologies are currently available to detect counterfeit drugs rapidly and efficiently. These include covert and overt features added to the packaging material and to the drug product itself, and authenticating the suspect drug for these features [3]. Another effective technique is to develop unique spectral signatures for the drug product and to test the suspect product against these signatures in order to spot counterfeits and also to authenticate legitimate products.
Near-Infrared (NIR) and Raman spectral techniques, which are complimentary in nature, have been used widely to detect counterfeit drugs [4 - 10]. Both techniques are rapid, nonintrusive and nondestructive that can be used for the analysis of many classes of pharmaceutical dosage forms. The nonintrusive nature of both techniques makes it feasible to analyze a drug product directly through the packaging, such as bottles or blisters, and through capsule shells for encapsulated products.
In the past five years, portable versions of these spectrometers have paved the way to detect counterfeit drugs in the field [8]. These portable spectrometers have the unique advantage of taking the “lab” closer to the areas where rapid detection of counterfeit products is desirable, such as deceitful manufacturing facilities, pharmacies, hospitals, and storage facilities. This article will discuss an overall strategy that can be used for the development and validation of NIR spectral signature libraries using portable spectrometers for counterfeit detection in the field. A detailed article on Raman spectral signature development and validation is planned. Also, a previous article on proof of concept in using these portable units for counterfeit detection was published, and the readers are referred to that article for more details [11]. Even though the study in the present article pertains to portable NIR spectrometers, the principles for spectral signature development and validation can also be applied to bench-top instruments.
The need for validating spectral signatures is increasingly becoming more important and relevant as counterfeit products are increasingly becoming more difficult to detect. Counterfeits designed to mimic authentic product but containing less amount of the active ingredient, or unauthorized generic versions are often difficult to detect and differentiate from authentic products chemically using qualitative spectral analysis. The unauthorized generics often enter into a legitimate market and supply chain via the internet [12].
Portable NIR Spectrometer
The portable NIR spectrometer used in this study has a tungsten lamp source and covers a spectral range of 1600 – 2400 nm. This wavelength range covers most of the combination and first overtone bands which are the strongest in the NIR region. The measurement time for a spectrum is typically five seconds and the spectral data can be transferred easily to a PC via a USB cable. The unit weighs approximately 3 lbs and the battery life is about 4 hours.
The spectral resolution for this portable unit ranges between 20 – 42 cm-1, which is appreciably lower than a typical bench-top FT-NIR instrument with a resolution of 2 cm-1. This lower spectral resolution was found not to be a limiting factor in using the portable spectrometer due to the inherent broad spectral peak shape for NIR bands [13]. Because the NIR spectral bands are broad, data pretreatment is typically necessary to convert the raw data into useful spectral signature information for counterfeit detection.
Even though the NIR technique works in both transmittance and reflectance modes, the portable units are designed only in the reflectance mode. The reflectance signal collected in NIR is diffuse reflectance in nature, and therefore probes both the surface and subsurface of a tablet, capsule powder, etc. The depth of penetration depends on the nature of the surface, such as the coating and color, and physical parameter, such as hardness and particle size; and these portable units typically probe more than 100 μm or so below the surface, which is sufficient to provide the spectral signature of the drug product as a whole and not only the surface material.
Authentic samples from several different lots were used to develop an individual spectral signature in order to capture all the variations in physical properties such as hardness, density, particle size, etc., which are critical parameters in NIR spectroscopy. This is in sharp contrast to Raman spectroscopy where the Raman signals are derived predominantly from the chemical components of the drug products, and therefore samples from one lot are usually enough to develop the spectral signature.
Identification and authentication of the drug product from the pretreated spectral data is performed in two ways: Spectral Match Correlation and Principal Component Analysis (PCA). For both the spectral match correlation and PCA analysis, the vendor software was utilized and it was found to be adequate with no need for any additional chemometric data treatment.
Spectral Signature Development and Validation
The first step in spectral signature development is to evaluate if Raman and/or NIR spectra can be used to provide a unique signature for a given drug product. For this purpose, the NIR and Raman spectra for a given product should be obtained from at least three lots (especially for NIR) as an initial feasibility study. From these data, a decision can be made whether to use both the Raman and NIR or only one of these techniques for the spectral signature. If both techniques provide unique signatures, the two of them together may constitute the spectral “fingerprint” for an individual product. The next step is to develop the signatures using several lots (manufactured at different sites if appropriate) and validate them using a well defined protocol. Each product strength for a given product should be treated as a separate entity and the signatures should be validated for them separately. Also, the signature library should be periodically verified and updated if there are any changes made to the manufacturing process, composition of excipients, site of manufacture etc.
The NIR and Raman spectral signatures developed for a given product using the portable spectrometers is validated for its intended use, which is to test and verify if a suspect product is counterfeit or authentic. Although this use may be viewed as a qualitative identity test requiring only validation for specificity as per ICH guideline [14], our experience is that other validation elements should be covered as well. Specifically, ruggedness and robustness should be evaluated along with specificity to challenge the use of the spectral signatures for product identification. The reason for this is that the portable units are intend to be used in the field where the conditions such as humidity and temperature can affect the sample conditions and the spectrometer, and thereby the results. Also, if the units are to be deployed in the field, it is highly recommended that the spectral signatures are rugged so that they perform the same way in more than one unit.
The robustness of the spectral signatures can be evaluated by deliberate changes made to the NIR instrument such as, influence of change in instrument part (ex: lamp) and/or to the data collection and pretreatment process [15]. We have evaluated the effect of change in lamp source on the spectral match values and the results are given in this article.
In both Raman and NIR techniques, the threshold spectral match value for the identification of authentic vs. counterfeit is determined during the validation of the spectral signature using several authentic samples and also by testing potential counterfeits. Sometimes, this is not practical since obtaining counterfeits is not always possible. In this case, authentic samples were stressed using extreme conditions, such as high temperature and humidity, to alter or degrade the material, and the match values for these degraded samples were evaluated to determine a useable threshold.
The NIR spectrum is often sensitive to both the physical and chemical characteristics of the product. Highly stressed conditions applied to authentic samples can result in changes in the physical properties, such as hardness and even changes to the film coating in the case of coated tablets. Chemical changes may include degradation of the drug product which may impact spectral features. In our experience, we have noticed that extreme stress conditions, such as 60oC combined with 75% relative humidity for an extended period has resulted in samples whose match values using the NIR technique were lowered to below 0.8 (1.0 being a perfect match).
If placebo samples are available, one can also use them to aid in determination of the match value threshold. In any case, the match threshold is ideally determined by testing it on both positive (authentic) and negative samples (such as counterfeits, highly stressed samples, generics and placebo). Also, to demonstrate ruggedness, the spectral signatures are tested using different portable units from the same vendor, and also by evaluating the day-to-day variability in the results as a part of validation. The spectral match value results from both the ruggedness and robustness studies are used to determine the provisional threshold match value for a given drug product. This provisional match value should be periodically evaluated by checking the match values from new lots of samples and a statistical analysis should be performed periodically to update the threshold, if needed.
The remainder of this article will detail the results we obtained for the development and validation of a NIR spectral signature for a film coated tablet product (referred to as Tablet A). Tablet A was used for the NIR signature development and validation and has only one strength. A detailed method development and validation protocol with acceptance criteria for the validation elements tested (specificity, ruggedness and robustness) was prepared for the NIR spectral signature development and contents are provided in this article, wherever applicable.
Spectral Signature Development
Three lots (Lot 1, 2 and 3) of Tablet A were used to develop the signature library. Three tablets from each lot were used for signature development and five spectra were collected from each side of each tablet, totaling thirty spectra for each lot and ninety spectra total for Tablet A. These ninety spectra together called the “training set” were initially treated as the reference signature library.
Determination of Spectral Match Limit
Five additional lots (Lots 4, 5, 6, 7 and 8) that are different from the lots used for signature development were used to test the reference signature library and to establish the initial spectral match limit using the instrument vendor software. Three tablets from each of the five lots were used to test the reference signature library and five spectra were collected from each side of each tablet, totaling thirty spectra for each lot.
To determine the match values for the spectral data in this study, the following data pretreatment regimen was used in the order shown:
- Standard Normal Variate (SNV) correction
- Savitzky Golay 2nd derivative with 5 point smoothing and 2nd order polynomial fit
- Unit Vector Normalization

Figure 1: NIR Spectrum of Tablet A Using Portable Spectrometer
Figure 1 shows the NIR spectrum of Tablet A using the portable spectrometer.

Figure 2: Data Pretreated NIR Spectrum for Tablet A Using Portable Spectrometer
Figure 2 shows the pretreated NIR spectrum for Tablet A.
Table 1: NIR Average Match Values for Tablet A Tested Using Portable Spectrometer 1
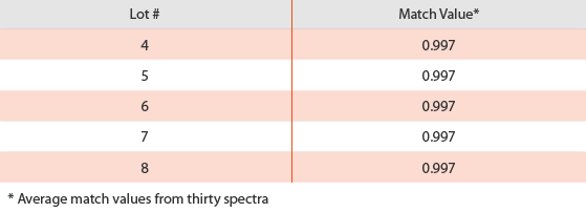
The average match values obtained for the five test lots against the reference signature library using spectrometer 1 are given in Table 1.
The threshold limit for the match value was determined using a 95% confidence limit from the total of 150 scans and was found to be 0.996. The match values were statistically treated as a normal distribution and a two sided tolerance limits were calculated [16]. Only the lower limit is reported, as the upper limit is considered to be 1.0 since this is the value for a perfect match.
Table 2: NIR Average Match Values for Tablet A Tested Using Portable Spectrometer 2

Ruggedness
second analyst tested the five lots given in Table 1 using a second spectrometer from the same vendor. These 150 spectra were matched against the library spectrum generated from the first spectrometer(training set of ninty spectra) and the results for average match value are given in Table 2.
The average match value determined using the second unit for each lot is within ±5% (protocol acceptance criteria) of the first unit. Using the match values from both units and with a 95% confidence limit, the provisional match threshold was caculated and was found to be 0.981.
Table 3: NIR Average Match Values for Tablet A Tested Using Portable Spectrometer 1 by Changing the Source Lamp

Robustness
The robustness of the NIR technique was tested by changing the NIR source lamp in the instrument (spectrometer 1) and testing the five lots given in Table 1. The average match value results are given in Table 3.
Results from Tables 1 and 3 indicate that while there is slight shift in the match values for all the five lots tested by changing the source lamp, the match values are well within the limit determined from the variations due to analyst/instrument (Refer to results from Table 2).
Table 4: NIR Average Match Values for Tablet A Stress Samples Tested Using Portable Spectrometer 1

Specificity
The specificity of the NIR technique and hence the spectral signature of the product was examined by testing stressed samples, and the match values were determined. The stress conditions along with the average match value results are given in Table 4.
From the match value results, it can be seen that extreme stress conditions, such as 60oC/75% RH for an extended period of time resulted in match value lower than 0.8. Samples stored for shorter periods of time under stress conditions also had match values below the provisional limit (0.981), while those stored at normal and intermediate conditions were within the threshold limit.
The specificity of the NIR spectral signature for Tablet A was also tested using placebo tablets. Six placebo tablets were used and five spectra were collected from each side of each tablet, totaling sixty spectra for the placebo using each portable unit. The average match values for the placebo tablets using the first and second units were found to be 0.935 and 0.918, respectively. These values are well below the provisional match value of 0.981 supporting the specificity for the NIR spectral signature for Tablet A.
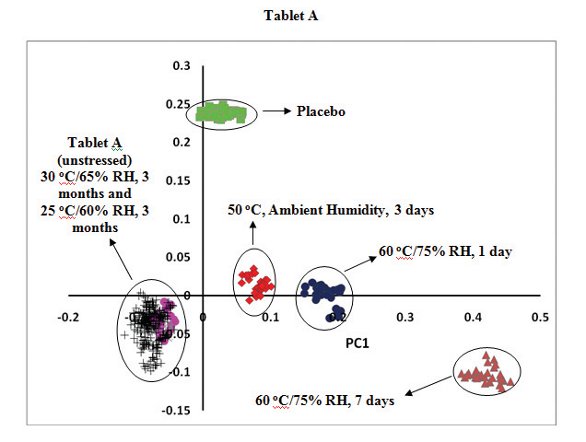
Figure 3: PC Score Plot for Tablet A Along with Placebo and Stress Samples of Tablet A
All the spectra collected for the placebo, stressed and authentic tablet samples using both NIR units for Tablet A were used to determine PC scores using the vendor software. The same data pretreatment used to determine the spectral match values was used to determine the PC scores. The first and the second PC scores were plotted for Tablet A along with the placebo and stressed samples and are shown in Figure 3.
From Figure 3 it is clear that the Tablet A samples (unstressed) can be differentiated from the placebo and the stress samples using thePCA model. The ellipse around each group of sample data is given for clarity purpose only and does not represent any statistical limit.
The PC score plot along with the match values for the stressed and placebo samples clearly indicate that the NIR spectral signature that was developed and validated for Tablet A can be used to identify potential counterfeits. The provisional match value of 0.981 can be used for the reference signature spectra, i.e., initial 90 spectra from training set along with the ones collected from both the units for ruggedness (300 spectra), totaling 390 spectra. These spectra can be potentially loaded into other portable units for deployment in the field for possible counterfeit and substandard drug detection.
Conclusion
counterfeit drugs threaten to infiltrate the legitimate supply chain, there is an ever increasing need to find ways to rapidly detect their presence in the field. The results in this article detailed an effective way to develop and validate NIR spectral signatures for counterfeit detection in the field using a portable NIR spectrometer. These portable devices were found to be easy to use with minimum user training required, and once the spectral signatures are developed, validated and loaded into the portable spectrometer, suspect products can be tested within a few minutes. They can be potentially utilized as a screening tool in the field by non-scientific personal.
References
- Food and Drug Administration (FDA) website, “Reporting of Counterfeit Drug Products”, July 2009, http://www.fda.gov/Drugs/DrugSafety/ucm170314.htm
- R. Cockburn et al., “The Global Threat of Counterfeit Drugs: Why Industry and Governments must communicate the Dangers”, PLoS Medicine (2005) e100.
- Anti-Counterfeit Technologies for Protection of Medicines, The World Health Organization (WHO), March 2010, www.who.int/entity/impact/events/IMPACT-ACTechnologiesv3LIS.pdf
- P. Sacre, E. Deconinck, T. Beer, P. Courselle, R. Vancauwenberghe, P. Chiap, J. Crommen, Comparison and combination of spectroscopic techniques for the detection of counterfeit medicines, J. De Beer, Journal of Pharmaceutical and Biomedical Analysis., 53 (2010), 445 – 453.
- M. de Veij, A. Deneckere, P. Vandenabeele, D. de Kaste, L.Moens, Detection of counterfeit Viagara with Raman spectroscopy, Journal of Pharmaceutical and Biomedical Analysis, 46 (2008), 303 – 309.
- Y. Roggo, K. Degardin, P. Margot, Identification of pharmaceutical tablets by Raman spectroscopy and chemometrics, Talanta 81 (2010) 988 – 995.
- P. de Peinder, M. J. Vredenbregt, T. Visser, D. de Kaste, Detection of Lipitor counterfeits: a comparison of NIR and Raman spectroscopy in combination with chemometrics, Journal of Pharmaceutical and Biomedical Analysis, 47 (2008), 688 – 694.
- Andrew J. O’ Neil, Roger D. Jee, Ged Lee, Andrew Charvill and Anthony C. Moffat, Use of Portable Near Infrared Spectrometer for the Authentication of Tablets and the Detection of Counterfeit Versions, Journal of Near Infrared Spectroscopy, (2008), 16, 327 – 333.
- M. B. Lopes, J. C. Wolff, Investigation into classification/sourcing of suspect counterfeit Heptodintrade mark tablets by near infrared chemical imaging and classical least squares estimation, Analytica Chima Acta 641 (2009) 46 – 51.
- . Anthony C. Moffat, Sulaf Assi and Robert A. Watt, Identifying counterfeit medicines using near infrared spectroscopy, Journal of Near Infrared Spectroscopy, 18, 1 (2010), 1 -15.
- R. Kalyanaraman, G. Dobler and M. Ribick, Portable Spectrometers for Pharmaceutical Counterfeit Detection, American Pharmaceutical Review, April (2010), 38 – 45.
- G. Jackson, Faking it: the dangers of counterfeit medicine on the internet. International Journal of Clinical Practice, 63.2, 181-184.
- L. Herberholz, O. Kolomiets and H. W. Siesler, Quantitative analysis by a portable near infrared spectrometer: can it replace laboratory instrumentation for in situ analysis? NIR news, vol. 21, No. 4, May/June 2010, 6 – 8.
- ICH Harmonized tripartite guideline, Validation of Analytical Procedures: Text and Methodology Q2(R1), November 2005
- N. Broad, P. Graham, P. Hailey, A. Hardy, S. Holland, S. Hughes, D. Lee, K. Prebble, N. Salton and P. Warren, Guidelines for the Development and Validation of Near-Infrared Spectroscopic Methods in the Pharmaceutical Industry, Pharmaceutical Applications, John Wiley and Sons Ltd., 2002, 1 – 21.
- United States Department of Commerce, National Bureau of Standards Handbook 91, Issued August 1, 1963, Appendix T-14, 15.
Author Biographies
Ravi Kalyanaraman is a Senior Scientist at Bristol-Myers Squibb Company in Analytical Technology group with Technical Operations. He received his Ph.D. from University of Idaho in 1996 and has been with Bristol-Myers Squibb since 2002. His recent work with Bristol-Myers Squibb has been focused on developing new and novel techniques to detect pharmaceutical counterfeits. His interests are mainly in using vibrational spectroscopic techniques, such as Raman and Near-Infrared (NIR) for pharmaceutical counterfeit detection and for product authentication. He is also a co-lead of an analytical team that is involved in the analysis of products received from complaints and from corporate security groups.
Michael Ribick is a Department Director at Bristol-Myers Squibb Co. He received his MA degree in Physical Chemistry from University of Missouri and has been with Bristol-Myers Squibb since 1983. His most recent work has been focused primarily with governing the development and validation of analytical procedures to support manufacturing and supply chain operations in the Bristol-Myers Squibb network. His department provides analytical expertise and support to site Quality Control Laboratories, Product Complaints, and Corporate Anti-Counterfeiting efforts. He is also responsible for the reference standard program that supports marketed products and is a member of the UPS Expert Committee on Reference Standards.
George Dobler is an Associate Director of Analytical Technology within the Bristol-Myers Squibb Co. Worldwide Quality and Compliance division. He received an MS in Chemistry from St. Joseph’s University and has 20 years of experience in the pharmaceutical industry in roles within Analytical R&D, Quality and Compliance, and Analytical Technology in support of technical operations activities and initiatives. His current role focuses primarily on providing analytical expertise in the areas of Technology Transfer, Product Complaints, Corporate Anti-Counterfeiting efforts, and support to company and third part Manufacturing and Testing sites.
This article was printed in the May/June 2011 issue of American Pharmaceutical Review - Volume 14, Issue 4. Copyright rests with the publisher. For more information about American Pharmaceutical Review and to read similar articles, visit www.americanpharmaceuticalreview.com and subscribe for free.