Abstract
For many biopharmaceutical drug products the last manufacturing step involves freeze-drying. As freeze-drying may be hazardous for the protein’s physical stability, this step can, when not well controlled, transform a product with an acceptable quality into one to be rejected. Knowledge on the protein’s conformational stability during freeze-drying processes is highly desired, as it may facilitate the development of freeze-drying cycles, increase process efficiency and create possibilities for preventing product lost. This paper discusses the suitability of Near-infrared (NIR) and Raman spectroscopy as potential in-line process analyzers for this purpose.
Introduction
Protein pharmaceuticals have become a major class of therapeutic molecules, and it is expected that their market share will increase considerably in the next decades. In contrast to the conventional small molecular weight drugs, these fragile structures with complex 3D-structure are thermodynamically stabilized, and to properly execute their biological activity the native conformation needs to be energetically preferred. But any change in its micro-environment, including any processing step, but also transportation and storage, may represent possible hazards to decrease the stability of protein molecules. This creates great challenges for the manufacturing and formulation development of biopharmaceuticals.
Because of the increased long-term storage stability and easier worldwide distribution, lyophilized biopharmaceuticals are often preferred over the liquid formulations. During the freeze-drying process the water is removed, hence the protein fraction will be concentrated several fold resulting in an amorphous cake. The lyophilization process itself, however, can generate an arsenal of freezing and drying stresses, which might physically destabilize the folded protein molecules [1]. Especially the formation of aggregates is a critical quality issue, because their presence in the administered product can potentially cause life-threatening immune responses or reduced therapeutic activity. Generally partial protein unfolding will precede aggregation, exposing hydrophobic residues that favor intermolecular interactions between protein molecules. The nature of the intermediate states preceding aggregation can vary from transiently expanded species within the native state ensemble to molten globule structures [2-3]. It is a general rule that more protein unfolding during freeze-drying increases the risk for aggregation at the time of reconstitution and administration of the product [4]. Therefore, maximizing the stability of the native conformation by avoiding protein unfolding during the entire freeze-drying process is strongly recommended to deliver freeze-dried proteins of acceptable quality.
Analytical tools (such as circular dichroism, fluorescence spectroscopy, Fourier-transform infrared spectroscopy…) can efficiently detect the presence of structural perturbations in proteins in freeze-dried and/or reconstituted biopharmaceutical products. However, they all have in common that the analysis will occur after the freeze-drying process has been completed. Also, because of the mainly empirical character of stress-specific stability studies, the process itself remains partly a black box and the formulation behavior during freeze-drying is not fully understood.
Non-invasive spectroscopic techniques, such as Near-infrared (NIR) and Raman spectroscopy, using fiber-optic probes have been proposed as potential tools to in-line and real-time monitor protein unfolding and/or obtain mechanistic information about the formulation behavior during freeze-drying. In this paper we discuss the potential of both technologies.
Potential In-line Monitoring Tools
Where an ATR-FTIR fiber optic probe can perfectly be used when proteins are in solution [5], its invasive character hampers its use for freeze-drying processes. During a freeze-drying process the starting material (solution) undergoes several transformations leading to the end product (dry cake). The process starts with a freezing phase, where most of the water is converted into ice. The solutes are crystallized or transformed into a solid amorphous system. Next, in the primary drying step it is aimed to remove the ice crystals by sublimation under vacuum. Finally, there is the secondary drying step, also under vacuum, where most of the unfrozen water is removed by desorption. Besides their non-invasiveness, NIR and Raman spectroscopy do not require sample preparation, and enable obtaining chemical and physical information about the sample in an extremely fast way. This makes them potentially applicable for in-line monitoring during processes. Their suitability for in-line detecting process end points, product characterization (solid state of excipients) and physical phenomena occurring during freeze-drying (process understanding) was earlier shown [6-7]. Both NIR and Raman spectroscopy complemented, and also mutually confirmed each other, suggesting that a combined use of both process analyzers can cover most of the critical process aspects [8-9]. Apart from this, conformational stability is another critical aspect for the freeze-drying of proteins, which will be considered here.
Table 1 - Potentials/ advantages and disadvantages of diff erent techniques for in-line monitoring protein conformational instability during freeze-drying

Near-infrared Spectroscopy
The overwhelming signals for water and ice in the near-infrared region make reflectance NIR spectroscopy unsuitable to be used during cooling, freezing and sublimation in a freeze-drying process. Nevertheless, its application during secondary drying, i.e. from the moment that all the ice is sublimated in the measured sample spot, can be useful. Protein dehydration, i.e. the (partial) removal of the hydration shell surrounding the protein molecules, is an important stress factor for the protein’s conformational stability during any drying process [10].
The near-infrared region is due to its combination bands and overtones less suitable for determining the secondary structural elements in proteins [11-12]. However, the amide A/II combination band, arising from the amide A and the amide II protein backbone vibrations, has been indicated as an interesting marker band for the protein’s conformational stability. References [11, 13] showed the dependence of the peak position of this band on the extent of hydrogen bonding by the amide groups making up the folded protein structure. When a protein molecule unfolds there is a general weakening of the intra-molecular hydrogen bonding strength, because it looses its cooperatively folded structure [14], which will be reflected by an increasing amide A/II band position [11]. On the other hand, when water or stabilizers interact with the protein’s backbone, the increased extent of hydrogen bonding will induce a relative decrease in amide A/II frequency [13]. At low water content, as present during the secondary drying phase, NIR spectroscopy also enables monitoring the water elimination.
When monitoring these two features, i.e. the amide A/II peak position and water elimination (here expressed as an Apparent Water Absorption or AWA), a good correlation between them was found in the absence of protein unfolding (Fig. 1, yellow trace) [15]. This trend was consistently followed in formulations where proteins experienced solely dehydration (and no unfolding) during freeze-drying with different secondary drying conditions (time, temperature). On the other hand, when there was protein unfolding, the process trajectories showed consistent deviations from this trend towards higher amide A/II frequencies. In case of modest and reversible protein unfolding, the deviations from the trend were generally smaller than in case of a stronger and irreversible protein denaturation [15]. An example is shown in Fig. 1. Hence, NIR spectroscopy may have a potential for the early detection of protein unfolding during the process.

Figure 1 - Process trajectory described by water elimination (decrease in AWA) and amide A/II frequency during protein dehydration in the measured ice free part of diff erent IgG formulations.
Another interesting observation using this approach was that mechanistic information on protein-lyoprotectant hydrogen bond interactions could be obtained. It could be observed when and to what relative extent there is hydrogen bond interaction during the secondary drying phase [15]. Interactions between sucrose and the protein backbone were detected directly after sublimation of the illuminated sample spot, and their extent was relatively higher with increasing sucrose concentration. At the end of secondary drying, at constant temperature, the process trajectories still indicated water loss while the amide A/II frequencies remained unchanged. This observation suggested a water substitution effect of sucrose. Hence, NIR spectroscopy may also have some potential for revealing mechanistic process information on the working mechanism of (novel) lyoprotectants.
Raman Spectroscopy
Unlike NIR, Raman spectroscopy has sensitivity for the protein’s secondary structure. The amide I (1600-1700 cm-1) and amide III (1200-1340 cm-1) regions in the Raman spectrum are known to be the most characteristic for determining protein secondary structural elements [12]. Protein concentrations ranging from 5-40 mg/ml can be typically analysed with Raman spectroscopy. In the present study different formulations containing approximately 35 mg/ml IgG were freeze-dried. To observe whether or not there was protein denaturation during freeze-drying, we used ATR-FTIR spectroscopy (amide I region) as a reference technique before and after freeze-drying, as well as in the reconstituted product. A dispersive Raman spectrometer, employing a 785 nm laser diode and a CCD camera, was used in combination with a fiber-optic probe for measuring the same samples. Instrument parameters, such as laser power, exposure time and number of accumulations, were optimized.
When looking at the amide I region for native-like freeze-dried IgG in the Raman spectrum, the band near 1670 cm-1 dominates the spectrum (Fig.2, in green). This band indicates the presence of β-sheet structures, which are its most represented secondary structural elements. The amide I band in the Raman spectra was not much influenced by the signals of amorphous sucrose and mannitol or of the tested buffer components, since different formulations with native-like IgG gave analogous amide I Raman spectra (Fig.2, in green). In samples with structural perturbations of IgG (confirmed by FTIR), the peak near 1670 cm-1 was relatively lower and broader, or just higher, compared to those found for native-like samples (Fig.2, in red).
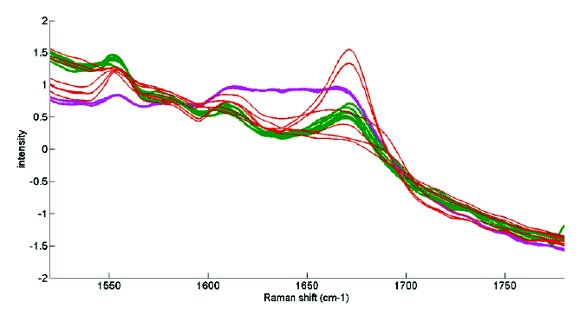
Figure 2 - Amide I (1600-1700 cm-1) Raman spectra for diff erent IgG formulations. Native-like freeze-dried IgG in diff erent buff ers with and without sucrose and mannitol is in green. Freeze-dried IgG with perturbed secondary structure is in red, and native IgG in solution is in purple. Pre-processing: standard normal variate and Savitzky-Golay smoothing
Compared to the Raman spectra in solution (Fig. 2, in purple), those of the freeze-dried products indicate a clearer signal, because the protein molecules are concentrated and dehydrated. However, in comparison to NIR spectroscopy, the Raman spectrum is less influenced by the presence of water and ice in the sample. This opens possibilities to use the technique during the entire freeze- drying process, i.e. from the protein in solution until the freeze- dried end product. But the physical changes that happen during the freeze-drying process, i.e. concentration of the protein fraction and elimination of moisture, can influence the Raman spectrum. Raman spectra may also be influenced by temperature and pressure variations, which will typically occur during a freeze-drying process. As these spectral changes are of no importance when measuring the protein’s conformational stability, a proper removal of their disturbing effects from the Raman spectra should be considered.
Since it is not possible for in-line measured spectra to interpret them one by one, a challenge is how to quantify or classify protein denaturation in a straightforward way based on the spectral changes? A popular approach for quantifying the amount of denaturation, commonly applied in FTIR spectroscopy, is calculating the % similarity via the area of overlap with a reference spectrum of a native sample [16]. The amount of deviation from the reference spectrum is then taken as a measure to quantify the amount of denaturation. The advantage is that the output is very simple, i.e. a numerical value.
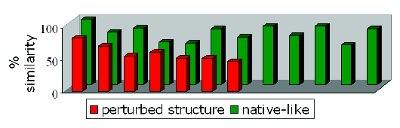
Figure 3 - % similarity with a native-like ‘reference’ Raman spectrum calculated via area of overlap for diff erent freeze-dried IgG formulations.
This method was applied on the Raman spectra of IgG samples, freeze-dried in various formulations and with different conditions. The Raman spectrum of a native-like freeze-dried product was used as a reference. The % similarities tend to be generally lower for the Raman spectra of denaturated samples, i.e. those with clear signs of protein unfolding or aggregation (Fig. 3). However, it appeared difficult to distinguish products with little denaturation from the native-like ones. Since any change in the spectrum, regardless its importance to protein secondary structure, has a similar contribution to the decrease in % similarity, the specificity of the approach was low and there was a lot of variability between the values for samples containing native-like proteins (RSD 15.59%). Therefore this approach should be applied with caution, and it is recommendable to use it jointly with other visual interpretation methods, which makes it less interesting for monitoring purposes during a process.
When working with spectroscopic data, typically defined by many variables, Principal Component Analysis (PCA) is a great tool to reduce the number of variables to a new set that describes the spectral variability more efficiently [17]. The new variables, so called principal components, are linear combinations of the original ones. They are defined in such a way that they explain most (remaining) variability in the data and are orthogonal to each other. The projections of the objects onto the principal components are the scores. Fig. 4 shows a PCA score plot (PC1 versus PC3) for the same Raman spectra as used for the % similarity calculation. Although the number of samples in this preliminary experiment was low, and should be extended, the PCA score plot indicated that nearly all the scores of the samples with perturbed structure were located outside the cluster of those from ‘native-like’ samples. One sample with very little signs of unfolding was included in the 95% confidence limits, based upon hotelling T2 statistics. Multivariate data reduction methods might be useful for the in-line monitoring of protein conformational stability with Raman spectroscopy.
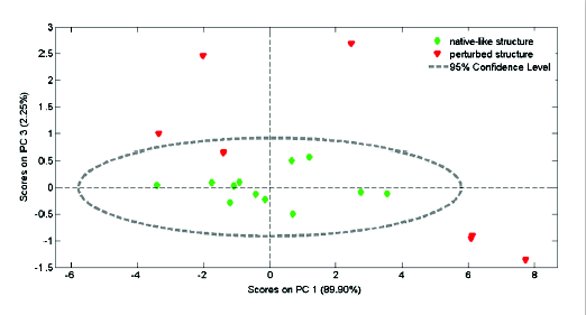
Figure 4 - PCA score plot (PC1 versus PC3) for amide I Raman spectra of different freeze-dried IgG formulations.
Conclusion
Near-infrared and Raman spectroscopy show interesting potential to be used as in-line monitoring tools for the conformational (in)stability of pharmaceutical proteins during freeze-drying processes. More research with both techniques will further reveal their practical feasibility for early detection of protein denaturation, and for gathering mechanistic process knowledge. Their use as in-line process analyzers may open new perspectives for developing cost-effective freeze-drying cycles, according to the Process Analytical Technology and Quality by Design concepts.
Acknowledgements
The authors thank prof. W. Friess and J.C. Kasper for their support. S.P. thanks the Research-Foundation-Flanders (FWO) for financial support.
References
- J.J. Hill, E.Y. Shalaev, G. Zografi, J. Pharm. Sci. 94, 2005, 1636-1667
- B.S. Kendrick, J.L. Cleland, X. Lam, T. Nguyen, T.W. Randolph, M.C. Manning, J.F. Carpenter, J. Pharm. Sci. 87(9), 1998, 1069-1076
- B.S. Kendrick, J.F. Carpenter, J.L. Cleland, T.W. Randolph, Biophysics 95, 1998, 14142-14146
- J.F. Carpenter, M.J. Pikal, B.S. Chang, T.W. Randolph, Pharm. Res. 14, 1997, 969-975
- C.L. McFearin, J. Sankaranarayanan, A. Almutairi, Anal. Chem. 83, 2011, 3943-3949
- T.R.M. De Beer, M. Alleso, F. Goethals, A. Coppens, Y. Vander Heyden, H. Lopez De Diego, J. Rantanen, F. Verpoort, C. Vervaet, J.P. Remon, W.R.G. Baeyens, Anal. Chem. 79, 2007, 7992-8003
- T.R.M. De Beer, P. Vercruysse, A. Burggraeve, T. Quinten, J. Ouyang, X. Zhang, C. Vervaet, J.P. Remon, W.R.G. Baeyens, J. Pharm. Sci. 98(9), 2009, 3430-3446
- T.R.M. De Beer, M. Wiggenhorn, R. Veillon, C. Debacq, Y. Mayeresse, B. Moreau, A. Burggraeve, T. Quinten, W. Friess, G. Winter, C. Vervaet, J.P. Remon, W.R.G. Baeyens, Anal. Chem. 81(18), 2009, 7639-7649
- T.R.M. De Beer, M. Wiggenhorn, A. Hawe, J.C. Kasper, A. Almeida, T. Quinten, W. Friess, G. Winter, C. Vervaet, J.P. Remon, Talanta 83, 2011, 1623-1633
- S. Luthra, J.P. Obert, D.S. Kalonia, M.J. Pikal, J. Pharm. Sci. 96(9), 2007, 2242-2250
- Y. Liu, R.K. Cho, K. Sakuri, T. Miura, Y. Ozaki, Appl. Spectrosc. 48, 1994, 1249-1254
- R. Tantipolphan, T. Rades, N.J. Medlicott, Curr. Pharm. Anal. 4, 2008, 53-68
- D.S. Katayama, J.F. Carpenter, K.P. Menard, M.C. Manning, T.W. Randolph, J. Pharm. Sci. 98, 2009, 2954-2969
- A. Cooper, Biophys. Chem. 85, 2000, 25-39
- S. Pieters, T. De Beer, J.C. Kasper, D. Boulpaep, O. Waszkiewicz, M. Goodarzi, C. Tistaert, W. Friess, J.P. Remon, C. Vervaet, Y. Vander Heyden, Anal. Chem. 84, 2012, 947-955
- B.S. Kendrick, A. Dong, S.D. Allison, M.C. Manning, J.F. Carpenter, J. Pharm. Sci. 85(2), 1996, 155-158
- B.G.M. Vandeginste, D.L. Massart, L.C.M. Buydens, S. De Jong, P.J. Lewi, J. Smeyers-Verbeke, Handbook of chemometrics and qualimetrics: Part B, Elsevier Science, Amsterdam, 1998, 1-713
Author Biographies
Sigrid Pieters is a Ph.D. student at the department of Analytical Chemistry and Pharmaceutical Technology from the Free University of Brussels (VUB). A major part of her research involves the evaluation of NIR and Raman spectroscopy as in-line process analyzers to monitor protein denaturation and lyoprotection during freeze-drying processes. Her work is funded by the Research Foundation Flanders (FWO).
Thomas De Beer,Ph.D., is a professor in Process Analytical Technology at the Faculty of Pharmaceutical Sciences from the University of Ghent. His research goals include the implementation of PAT systems in (innovative) pharmaceutical production processes, such as freeze-drying, hot-melt extrusion, and continuous from-powder-to-tablet processing.
Yvan Vander Heyden, Ph.D., is a professor at the Vrije Universiteit Brussel, Belgium, department of Analytical Chemistry and Pharmaceutical Technology, and heads a research group on chemometrics and separation science.