Abstract
The harvest process most often used during the primary recovery of cell-based biopharmaceuticals is continuous centrifugation followed by depth filtration. While it is widely used in the industry, little attention is typically paid to this unit operation because of the lack of analytical tools to develop and monitor the performance of this step. Turbidity, which is a measure of cloudiness, has been used up to now as the common output for the performance of this step. However, this output does not provide any direct information on the number of particles removed or their size. Nevertheless, these parameters are key to understand the effectiveness of the harvest operation. In this paper we describe how a CCD-microscope can be used to develop an optimized harvest operation by determining the number of particles and their size distribution of particles present in the centrate or in the eluates of the depth filters.
Introduction
The harvest process is that seeming ubiquitous first step in biopharmaceutical purification (or the last step in the cell culture process) that is considered simplistic in its performance and usually does not get a lot of attention during process development. Nevertheless, it is often one of the most difficult steps to transfer from one site to another or to scale up from bench scale to manufacturing scale. The harvest unit operation typically consists of continuous centrifugation followed by a multistep depth filtration. The primary function of the harvest process is to separate process solids (cells and cell debris) from the process (bioreactor) supernatant, although based on our own experience and available literature the depth filter portion of the harvest process can also impact host cell protein and DNA levels [1]. It has even been reported that the depth filtration has the capability to provide some clearance of adventitious viruses [2].
Given the multiple roles that this step is able to play it is remarkable to frequently hear the following opinions within the biopharmaceutical industry about this unit operation:
“Nobody characterizes this step. The agencies don’t care about. It’s mechanical. Besides how are you going to measure it?”
“We are experts and we are able to change the depth filters fast if they get plugged.”
“Harvest never scales up correctly.”
“All you need for harvest is a sufficient amount of depth filters.”
However, we realized ourselves that more attention should be paid to the development of this unit operation when an early stage GMP harvest process that took three hours to complete at pilot scale suddenly lasted for over 17 hours at manufacturing scale. After review of all available development and process data we realized that the turbidity data that were collected during the development were not very informative and that additional analytical methods were needed to understand and troubleshoot the entire harvest process.
The Harvest Process in Short
A typical harvest process is composed of disc-stack centrifugation followed by depth filtration using filters based on diatomaceous earth [3-5]. One of the common problems encountered is the scaling up of pilot centrifuge settings to production scale. Initially, it might seem that scaling based on relative centrifugal force would be appropriate, but this fails to account for geometric differences between centrifuges. Thus, it is more appropriate to scale based on the concept of equivalent settling area [8]. Based on this concept it is recommended that the centrifugation process be scaled using the equation [6, 7]:
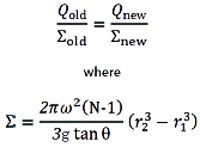
Q = flow rate
ω = angular velocity
N = number of discs
g = gravitational acceleration
r1 = inner radius of a disc
r2 = outer radius of a disc
The centrifuge typically removes larger particles (solids) which are accumulated along the walls of the bowl and are periodically discharged. The centrifugation step is typically followed by one or two stages of depth filtration. The depth filter removes particles by several modes including electrostatic effects, mechanical retention, and particle size exclusion [5, 9]. These are the effects that several vendors have leverage to introduce filters that provide not just particle removal but also initial host cell protein, DNA, and viral reduction.
Typical Analytics: Turbidity
The typical tool for analyzing the success of the harvest process is turbidity measurement. Based on the 1999 EPA guidance manual [10] turbidity is defined as follows:
Turbidity is a principal physical characteristic of water and is an expression of the optical property that causes light to be scattered and absorbed by particles and molecules rather than transmitted in straight lines through a water sample.
The 2004 EPA Guidance manual [11] simplified it to the following:
Turbidity is the measure of how clear a liquid is and how much light is scattered by the sample.
If we replace the term water or liquid with process or bioreactor supernatant this definition can be applied to the harvest process and turbidity becomes in essence a measure of the cloudiness of the solution. Typically, this cloudiness is measured against Formazin standards and the result is often expressed in Nephelometric Turbidity Units (NTUs). The actual device that measures the turbidity of a solution projects light (the type of light is method dependent) through a sample and a sensor detects the intensity of the light passed through the sample as well as scattered at 90° to the light source [12]. Depending on the method light scatter (at other angles) may also be measured and factored into the final output.
The power of this analysis is that the instruments and standards are readily available from several vendors. The instruments are inexpensive and easy to operate. However, one of the issues typically encountered is that turbidity results obtained on different style units and with different Formazin standards were compared to each other. These results are often not comparable and this can lead to confusion and misunderstandings. Even the units of the same vendor can have different light sources, optical benches, measurement systems, standard preparations, as well as different international standards associated with the individual unit. Thus, it quickly becomes an exercise of comparing apples to oranges when data were not obtained with identical turbidimeters.
Applying turbidity to the harvest process can reveal that each sub-step of this unit operation is reducing or not reducing cloudiness (particles). However, the information that is not obvious from the turbidity results is the number and size of particles remaining in or removed from the process supernatant during each step of the harvest. Monitoring the turbidity during the process can only indicate that there is a change, but the reason for the change may be elusive.
New Analytics: Electronic Image Microsopy and Image Analysis
Just as the photography business has been changed by the introduction of CCD and CMOS image sensors so has process analytics. Several vendors provide systems that can determine particle size distribution and number of particles. Many of these systems are available with flow cells which can even be installed on the GMP plant floor. Some of these units use laser and optical analysis whereas others just use optical analysis. We used a flow-through optical unit for our proof of concept tests. The optical unit acts as a video microscope and can operate in several different microscopy modes (back-lit, dark-field, and cross polarization).
The key to an optical unit is its image analysis software. The software analyzes a frame to calculate a particle diameter distribution, the number of particles per frame (which can be converted into particles/mL), a mean diameter, and the particle roundness (just to name a few) as potential outputs. Furthermore, the units that are set up for process applications can be equipped to send out an alarm should a defined parameter be out of specification. In order for the software to provide quantitative information a reticle (a grid of defined spacing, typically etched on a piece of glass) is needed to calibrate the distance measurement.
Proof of Concept Experiment
The first experiment was meant to test whether it was possible to see the effect of each step of the harvest process and if a general time-dependent effect could be seen. As this was the first experiment, samples were taken periodically during the run and pumped through the imaging system rather than running the system in its in-line mode.
Experimental Set-up
One hundred litres of a mammalian cell-based harvest broth was processed through a disc-stack centrifuge into a multilayer, single-stage, depth filter. Centrifugation samples were taken at approximately 2 and 12 minutes into a 14 minute centrifugation cycle. Additionally, three samples were taken exiting the depth filter over a 3 hour time period. The individual samples were circulated through the CCD system for approximately five minutes in order to obtain 3000 frames of data. The system used was able to identify particles ranging from 0.4 – 480 μm.
For comparison, a sample of unprocessed cell culture fluid also analyzed via the image processing software. Prior to the execution of the experiment the appropriate zoom level, distance calibration, and image intensity were determined and set.
The image intensity setting is crucial for detecting the presence or the absence of particles. The software can also be set to distinguish air bubbles from cell particles. However, this was not an issue during the experiments because we were able to achieve an essentially bubble-free system. About every tenth image (~300 frames out of 3000 frames) was actually evaluated during the analysis. All the data were processed in a serial manner which enabled us to execute all analytical algorithms and, as a result, to explore the full capability of the software. The turbidity of each sample was measured using a laser based turbidimeter calibrated with Stablcal Formizin standards.
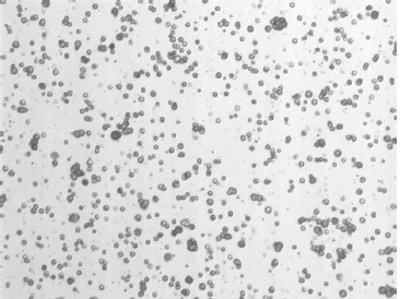
Figure1- Unprocessed bioreactor material
Results and Discussion
A typical image of unprocessed bioreactor supernatant shows a combination of single cells, aggregated cells and cellular debris (Figure 1). As a result of the centrifugation step the number of particles is reduced by ~12-fold over the unprocessed material as indicated by the reduction of the average number of particles per analyzed frame (Figure 2). Interestingly, the number of particles increased initially again from the centrifugation step to the early stages of the depth fi ltration. At this time, it is unclear if this is a real eff ect or not. Concomitantly with the decrease in the number of particles, the average particle diameter is decreased by a factor of ~3.5 (Figure 3). In contrast to the particle number, the average particle diameter does not increase from the centrifugation step to the early stages of the depth fi ltration. In parallel to the image analyses, turbidity measurements were also taken and they were consistent with the particle counting data. An average value of 200 NTUs (unprocessed), 20 NTUs (centrate), and 2 NTUs (depth fi ltrate) were obtained for this harvest process.
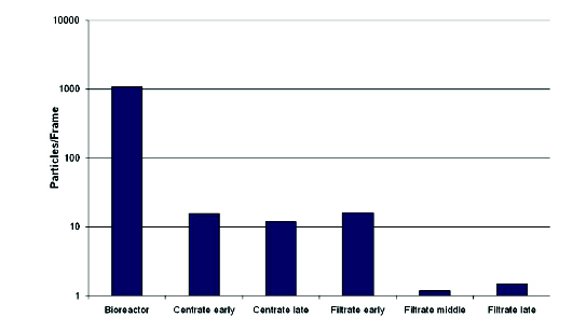
Figure 2 - Average number of particles during a typical harvest as determined by CCD Technology
The average particle diameter data (Figure 3) provide a good overview on the size of the remaining particles. But these data also allow a more detailed look at the distribution of specifi ed particle size ranges throughout the harvest process (Figure 4). Interestingly, the unprocessed bioreactor material shows a bimodal distribution of particle sizes. Particles smaller than 10 μm in diameter are usually associated with cell fragments whereas individual cells, based on lab experience, are expected in the range of 10-20 μm. From the data obtained it is apparent that, while the number of particles continues to decrease throughout the harvest process, those that remain in the solution are typically 5 μm in size or smaller (Figure 4). A more detailed analysis of the particles smaller than 5 μm (at resolution of 1μm) further showed a shift in the distribution to smaller particle sizes.
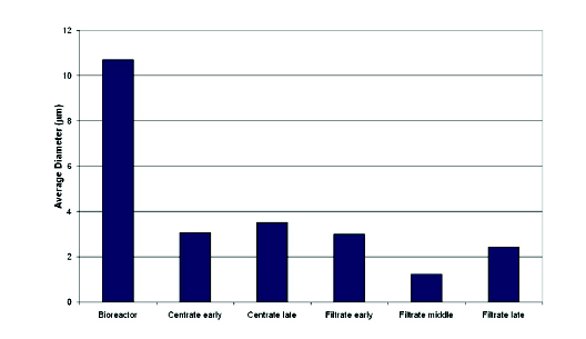
Figure 3 - Average diameter of particles during a typical harvest as determined by CCD Technology
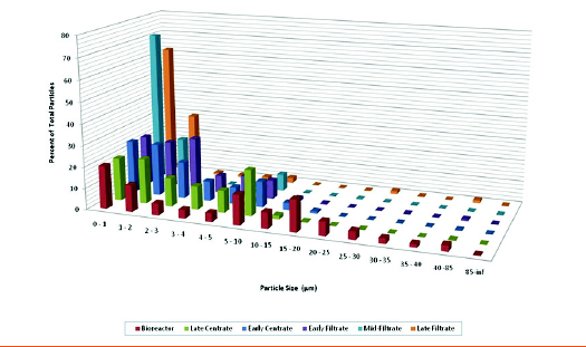
Figure 4 -Particle size distribution during diff erent stages of Harvest Operation
Based on these data the centrifuge is able to remove the majority of particles that are 5 μm in size or larger. The depth fi lter used for the experiment did further decrease the overall number of particles in the process fl uid and the size distribution of the particles became more skewed toward the smaller particle sizes.
Application to Process Development
The proof-of-concept study described above indicates that the CCD technology is a useful tool for developing a harvest process and appears to be particularly practical for determining the optimal Q/Σ for the centrifugation step, which is the key parameter used for scaling of centrifugation operations on the concept of equivalent settling area.
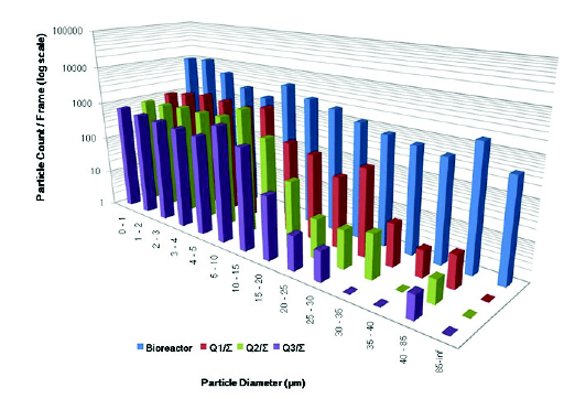
Figure 5 - Application of CCD Technology to determine optimal centrifugation conditions
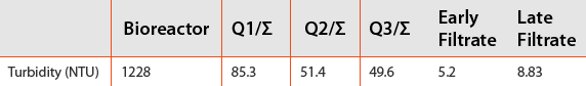
To test if the CCD technology could be applied to optimize a harvest operation the Q/Σ values for a harvest process on a lab-scale disc stack centrifuge were varied and the centrates were analyzed via particle counting and turbidity measurements. Figure 5 shows that Q/Σ at the setting #3 had the lowest number of particles in the centrate, which was consistent with the turbidity measurements indicating the lowest “cloudiness” for this sample (Table 1). It is important to notice that consistent with the previous experiment the majority of the remaining particles were smaller than 5 μm. This reduced the number of potential depth fi lter types that will need to be screened.
Table 1 - Turbidity during determination of optimal centrifugation conditions
More recently, the CCD unit is being evaluated for the analysis of the depth fi lter step (operating parameters, choice of fi lter, etc.) and it is expected that the data to be obtained will also demonstrate the utility of this device for development of this step of the harvest operation. Furthermore, work is being planned to evaluate the impact of cell viability on the performance of the centrifugation and the depth fi ltration steps.
Conclusions
CCD-microscopy and image analysis was successfully applied to the centrifugation step of the harvest operation to get an insight into the performance of this step. It results in the greatest reduction in cellular debris and the particles remaining in the centrate are typically less than 5 μm in size. The data also showed that the performance of the centrifugation process is dependent on the Q/Σ ratio. Similar work is currently in progress for the analysis of the depth fi ltration step.
In summary, the work presented indicates that it is possible to develop a harvest process driven by data directly related to harvest process and not just by circumstantial data as has been done in the past.
Acknowledgements
The authors would like to acknowledge the technical assistance of Kevin Carrigan and Joan Wozny in running the harvest operation.
References
- Yigzaw Y., Piper R., Tran M., & Shukla A.A., (2006). Exploitation of the Adsorptive Properties of Depth Filters for Host Cell Protein Removal During Monoclonal Antibody Purifi cation. Biotechnol. Prog. 22: 288-296.
- Tipton B., Boose J.A., Larsen W., Beck J., & O’Brien T., (2002). Retrovirus and Parvovirus Clearance from and Affi nity Column Product Using Adsorptive Depth Filtration. BioPharm. September; 43-50.
- Russell, E., (2003.) Evaluation of Disc Stack Centrifugation for Clarifi cation of Mammalian Cell Culture. Master’s Thesis; Tufts University. 3-4.
- David, Y., Blanck, R., Lambalot, C., and Brunkow R., (2003). The Clarifi cation of Bioreactor Cell Cultures for Biopharmaceuticals. Pharma. Tech. March; pp 62-76.
- Purav, D., Dizon-Maspat, J., and Cano, T., (2009). Evaluation and Implementation of a Single- Stage Multimedia Harvest Depth Filter for a Large-Scale Antibody Process. BioPharm. Int. June Supp. 8-17.
- Doran, P.M, (1997). Bioprocess Engineering Principles. San Diego: Academic Press. 228-229.
- Ambler, C.M., (1952). The Evaluation of Centrifugation Performance. Chem. Eng. Prog. 48: 150-158.
- Boychyn,M., Yim, S.S.S., Bulmer M., More .J, Bracewell D.G., Hoare M., (2004). Performance prediction of industrial centrifuges using scale-down models. Bioprocess and Biosystems Engineering 26:385-391.
- Doran, P.M, (1997). Bioprocess Engineering Principles. San Diego: Academic Press. 386.
- EPA Guidance Manual: Turbidity Provisions April 1999. Chapter 7-1.
- LT1ESWTR EPA Guidance Manual: Turbidity Provisions August 2004. Chapter 7-1. 1
- Sader, M.J. (1998). TURBIDITY SCIENCE: Technical Information Series—Booklet No. 11. Hach Company, Loveland CO. 7-8.
Author Biographies
Sheldon Oppenheim is a Senior Engineer I at Millennium: The Takeda Oncology Company. He has been with Millennium for 9 years, serving in both Cell Culture and Purifi cation groups. While at Millennium Sheldon has worked in the areas of high throughput purifi cation process development, bioreactor design, fl uid modelling and harvest operations. Prior to joining Millennium, Sheldon worked at Massachusetts Institute of Technology, Rensselaer Polytechnic Institute, and The University of Iowa. Dr. Oppenheim received his Ph.D. at The University of Iowa (Iowa City, Iowa) in Chemical Engineering.
Norbert Schuelke is an Associate Director at Millennium: The Takeda Oncology Company and is the head of the Purifi cation Process Development Group at Millennium. Dr. Schuelke has been with Millennium for over 6 years. Prior to joining Millennium he held positions at Progenics Pharmaceuticals, Inc., the University of Pennsylvania, and the Rockefeller University. Dr. Schuelke received his Ph.D. at the University of Regensburg (Germany).