Associated Vendor :
Abstract
Aesthetic appearance is a Critical Quality Attribute (CQA) of a freeze- dried drug product and plays a key role in its release to the consumer. A collapsed cake may be a result of poorly designed process conditions or a change in physical parameters that may have gone unnoticed during the drying process. This work presents the application of Near Infrared Spectroscopy (NIRS) and Multivariate Data Analysis (MVDA) methods as potential Process Analytical Technology (PAT) tools for testing collapse in freeze-dried products, both for in-process and finished freeze-dried products. The sensitivity of NIRS to the cake microstructure and physical state of water was leveraged for detecting and classifying collapse in products undergoing drying and in the finished freeze-dried products. Our results show the suitability of the NIRS for identifying in-process collapse/melt-back during freeze- drying and for classifying the collapse in the finished freeze-dried products. Comparative analysis of the NIR data using different MVDA methods showed the strong potential of linear discriminant analysis (LDA) for identifying the appearance of the in-process and finished freeze-dried products.
Keywords: Freeze-drying, Cake collapse, NIRS, PAT, Chemometrics
Subscribe to our e-Newsletters
Stay up to date with the latest news, articles, and events. Plus, get special offers
from American Pharmaceutical Review – all delivered right to your inbox! Sign up now!
Introduction
Following Quality by Design (QbD) guidelines,1 biopharmaceutical manufacturers put enormous effort in developing and implementing Process Analytical Technology (PAT) tools for monitoring freeze-drying processes. These tools help monitor both processes and products to achieve the desired quality in the product.2 Despite significant technological advances, it is still not possible to ensure that 100% of freeze-dried cakes reach the Critical Quality Attributes (CQA). The International Council for Harmonisation of Technical Requirements for Registration of Pharmaceuticals for Human Use [ICH Q8 (R2)] defines a CQA as a property (i.e., physical, chemical, biological, or microbiological) or characteristic that should be within the appropriate range for ensuring the desired quality of the product.1 One CQA is the aesthetic appearance of the cake, described as a uniform and elegant cake structure of the dried product.3 Aesthetic appearance is determined while the product is undergoing the drying process. A possible factor affecting cake appearance is product collapse, defined as loss to cake microstructure that is established during freezing.4 An increased product temperature caused by early ramping into secondary drying results in product melt-back during the drying process, and may have a significant impact on the appearance of the cake.5
In accordance with good pharmaceutical practice, the United States Pharmacopeia (USP) recommends inspecting all vials in a batch, also termed 100% batch inspection.6 Product acceptance with regards to its aesthetic appearance is subject to acceptance by visual inspection in the production environment. However, sole reliance on human intervention to inspect cake appearance can be fallible on the production line, as thousands of vials are produced. Failure to detect a cake defect in the finished cake, such as collapse or melt-back, can have a deleterious effect on the patient, as this defect might be the result of excess product moisture that may affect the drug’s safety and efficacy.6 In some instances, cake collapse may cause poor solubility and increased reconstitution time.7 Recently, Patel et al.3 summarized the challenges related to the visual inspection of lyophilized drug products and provided insights on acceptable cake appearance from an industrial perspective.
Several offline tools have been developed for characterizing the appearance of freeze-dried cakes, but as these techniques are invasive and require longer testing times, they are only commonly used in the development stages.8 Here, we present the potential of NIRS in combination with MVDA methods for identifying collapse in products during the process and in the finished freeze-dried cake. The proposed approach could provide assurance and accelerate the practice of visual inspection of freeze-dried cakes.
Materials and Methods
Sample preparation and NIRS measurement procedure
A 15% (w/v) glycine solution was used as a model formulation for the freeze-dried products. The samples were dried using a laboratory-scale freeze dryer. Three categories of samples were produced: 1) partially collapsed cakes, 2) fully collapsed cakes, and 3) normal freeze-dried cakes; each category comprised 25–35 samples. Cake collapse was produced by manipulating the vials during drying. We observed that the degree of collapse was closely related to the amount of moisture in the freeze-dried samples; therefore, two different moisture levels were selected for inducing partial and full collapse (Figure 1).

To induce partial collapse, samples containing 5 ± 2% (w/w) moisture were removed from the freeze dryer and left at room temperature (20°C) until cake shrinkage was observed. To induce full collapse, samples containing 20 ± 5% (w/w) moisture were removed from the freeze dryer and left at room temperature until cake melt-back was observed. The moisture content was determined by gravimetry, where the difference between the initial and final product weight was calculated.9,10
The NIR spectra were acquired using a diffuse reflectance NIR spectrometer covering the wavelength range of 900–1700 nm. The measurements acquired consisted of an average of 128 spectra, with an integration time of 12 ms. The vials assigned to partial and full collapse were scanned before and after collapse was induced. After the NIR spectra had been obtained, the vials were replaced in the freeze dryer to complete the drying cycle. Once dry, all three categories of the samples (Figure 2) were scanned to obtain the spectra for the different categories of finished freeze-dried products. NIR spectra were acquired in triplicate at 60° intervals around the cylindrical vials; later, the spectra obtained on each vial were averaged to obtain one spectrum per vial.
Data structure and Chemometric methods
The dataset of the finished samples consisted of 92 spectra × 125 wavelengths, one for each of the 92 samples in the three categories: partially collapsed, completely collapsed, and normal products. The dataset of the in-process samples was composed of 114 spectra × 125 wavelengths. The 114 spectra were: 32 completely collapsed samples and 25 partially collapsed samples, all of which were scanned twice (before and after product collapse).
The raw and preprocessed spectra were examined to obtain information related to the collapse and melt-back in the freeze-dried cakes. This was carried out via chemometrics methods such as Principal Component Analysis (PCA), Partial Least Squares Discriminant Analysis (PLS-DA), and Linear Discriminant Analysis (LDA), applied on the finished and in-process sample dataset for classifying the samples into the different categories. PCA is a projection method for maximizing the variance of the X matrix (spectra), and does not take the Y matrix (CQA) into account. PLS-DA is a projection method for maximizing the covariance between X and Y, where Y is a diagonal matrix representing the class of each sample. LDA is a projection method for maximizing the separation of each X group based on the Y matrix, that is, a known class of each sample; however, this does not seek to maximize variance. All data analysis, spectral pre-processing, and chemometric model building steps were performed using Python 3.7.
Results and Discussion
Identifying and classifying collapsed versus normal finished freeze-dried products
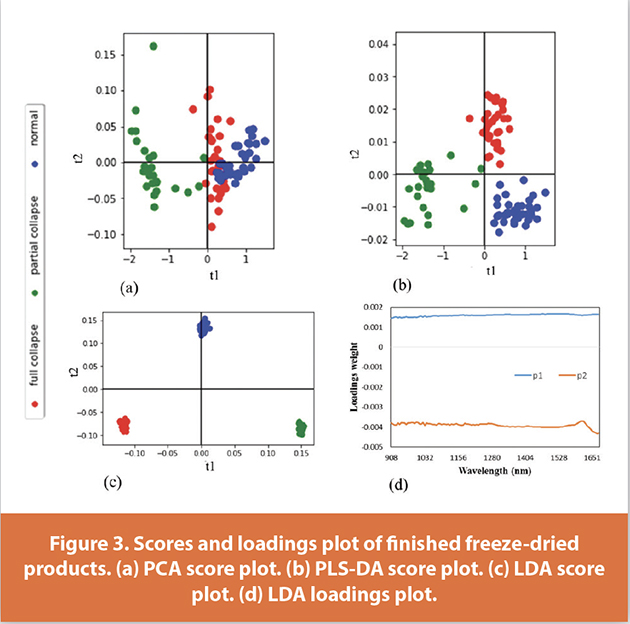
In the finished freeze-dried products, the spectral baseline information was used to classify complete collapse, partial collapse, and normal freeze-dried products. The spectra were simply mean centered prior to model building. Figure 3 (a, b, c) shows the comparative score plots of the different methods (PCA, PLS-DA, LDA); the samples are colored according to category (partial and full collapse, and normal freeze-dried). In all cases, two latent variables were sufficient for discriminating the spectra belonging to different categories. In PCA and PLS-DA, spectra separation could be seen on the first component axis (PC1), but the samples tended to overlap, as PCA and PLS-DA tend to maximize the variance and covariance between samples. A clear separation and clustering of spectra respective to the categories could be seen in the LDA score plot, as LDA tends to maximize the separation of the group of samples based on the known sample category. The LDA loadings (Figure 4 (d)) were mostly flat, which means that the entire baseline is used to separate the samples into different categories. And there is limited to no impact of moisture on different categories of the samples. The LD1 loadings separate the samples based on the product’s aesthetic appearance contributed by the baseline changes in the samples’ spectra. The LD2 loadings separate the samples based on the product concentration changes. The partially and completely collapsed samples had lower scores on the LD2 axis, as the product in some cases had shrunk and was not homogeneously distributed inside the glass vial. However, the higher LD2 scores of the normal freeze-dried products could be correlated with the higher product concentration, as the cake in this condition was intact and homogenously distributed in the glass vial.
Identifying in-process collapse (meltback) in the products during the freeze-drying process
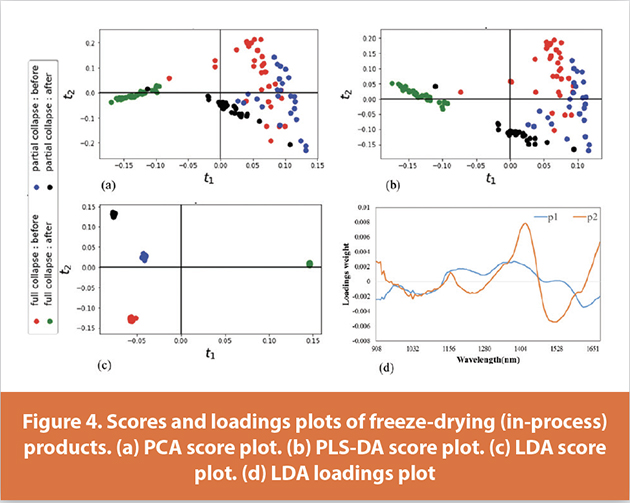
In the in-process products, partial and complete collapse were identified using the spectral signature. The spectra of both categories of samples, obtained before and after collapse as induced, were pretreated using the Standard Normal Variate (SNV). The spectra showed a distinct water overtone band when there was a change in the product’s physical state (from ice to liquid). Figure 4 shows comparative score plots of the different methods (PCA, PLS-DA, LDA); the samples are colored according to category (partial and full collapse, and normal freeze-dried). In all methods, two latent variables were sufficient for discriminating between the samples.
In the PCA and PLS-DA score plots, the separation of the samples into different categories could be seen only on the PC-1 axis; however, the LDA score plot showed a clear separation of the samples on both the LD1 and LD2 axes. On the LD1 axis, the samples were separated into two broad categories. The LD1 loadings had higher weights at 1366 nm, indicating that the product concentration changes (the alkyl group, in this case) contributed to the separation seen on the LD1 axis. Samples existing in a full collapse state showed sedimentation of the product at the bottom of the vial; therefore, they had comparatively higher scores. The LD2 loadings indicate that the free moisture present in the samples’ interstitial spaces contributed to the grouping of spectra on the LD2 scores axis. The partially collapsed samples had higher LD2 scores, as they contained larger amounts of free moisture, whereas samples prior to full collapse had lower scores, as they contained less free moisture. This is in accordance with the literature that presents NIRS ability in identifying the state and nature of water present inside the samples.11
Conclusion
This study evaluates the potential of NIRS for identifying the cake defects encountered in the manufacturing of freeze-dried drug products. Defects in the products, such as partial and complete collapse, were produced by mimicking abnormal process conditions that might arise during the routine manufacturing process. The samples were tested during the process (in-process) and after the process had been completed. The in-process samples were tested before and after collapse had been induced. The NIRS data were analyzed using PCA, PLS-DA, and LDA methods, and the comparative results from these three methods have been presented.
The results show the potential of NIRS for identifying the different cake defect intensities in the finished freeze-dried products, and also for identifying product collapse during freeze-drying. Moreover, the comparative results showed that choosing the appropriate method is important for characterizing the samples into different categories based on their nature. Among the methods used, LDA was most appropriate for discriminating samples.
References
- U.S. Department of Health and Human Services Food and Drug Administration, Center for Drug Evaluation and Research (CDER), C. for B. E. and R. (CBER). ICH Q8(R2) Pharmaceutical Development; U.S. Department of Health and Human Services Food and Drug Administration Center for Drug Evaluation and Research (CDER) Center for Biologics Evaluation and Research (CBER): Sillver Srping, 2009; pp 1–25.
- FDA. Guidance for Industry PAT: A Framework for Innovative Pharmaceutical Development, Manufacuring, and Quality Assurance; 2004; pp 1–16..
- Patel, S. M.; Nail, S. L.; Pikal, M. J.; Geidobler, R.; Winter, G.; Hawe, A.; Davagnino, J.; Rambhatla Gupta, S. Lyophilized Drug Product Cake Appearance: What Is Acceptable? J. Pharm. Sci. 2017, 106 (7), 1706–1721..
- Pikal, M. J.; Shah, S. The Collapse Temperature in Freeze Drying: Dependence on Measurement Methodology and Rate of Water Removal from the Glassy Phase. Int. J. Pharm. 1990, 62 (2–3), 165–186.
- Koganti, V. R.; Shalaev, E. Y.; Berry, M. R.; Osterberg, T.; Youssef, M.; Hiebert, D. N.; Kanka, F. A.; Nolan, M.; Barrett, R.; Scalzo, G.; Fitzpatrick, G.; Fitzgibbon, N.; Luthra, S.; Zhang, L. Investigation of Design Space for Freeze-Drying: Use of Modeling for Primary Drying Segment of a Freeze-Drying Cycle. AAPS PharmSciTech 2011, 12 (3), 854–861.
- United States Pharmacopoeia. Visual Inspection of Injections. Chapter <1790>. Rockville, MD: United States Pharmacopeial Convention 2016.
- U.S. FDA. Lyophilization of Parenteral (7/93). 2014.
- Haeuser, C.; Goldbach, P.; Huwyler, J.; Friess, W.; Allmendinger, A. Imaging Techniques to Characterize Cake Appearance of Freeze-Dried Products. J. Pharm. Sci. 2018, 107 (11), 2810—2822.
- May, J. C.; Grim, E.; Wheeler, R. M.; West, J. Determination of Residual Moisture in Freeze- Dried Viral Vaccines: Karl Fischer, Gravimetric and Thermogravimetric Methodologies. J. Biol. Stand. 1982, 10 (3), 249–259.
- Trelea, I.-C.; Fernanda, F.; Stéphanie, P. Dynamic Modelling of the Secondary Drying Stage of Freeze-Drying Reveals Distinct Desorption Kinetics for Bound Water. Dry. Technol. Taylor Fr. 2016, 34 (3), 335–345.
- Workman, J. ;; Weyer, L. Water. In Practical Guide to Interpretive Near-Infrared Spectroscopy; CRC Press, Inc., 2007; pp 63–70.
Author Biographies
Azheruddin Mohammed is a researcher working on the development of Process Analytical Technologies (PAT) tools for monitoring freeze- drying processes. During his Master’s degree in Chemical engineering, Mr. Azheruddin spent years with Pfizer Inc. exploring tools capable of remotely monitoring various quality attributes of the in-process and the finished freeze-dried products. Before joining the Pfizer Chair on process analytical technologies in pharmaceutical engineering, he worked for a few years as a products specialist in the pharmaceutical instrumentation industry.
Ryan Gosselin is a specialist in process engineering and on-line quality monitoring through the use of multivariate data analysis, chemometrics and data mining. His work mainly focuses on industrial process optimization through the use of spectral and imaging probes. He co- supervises the Pfizer Industrial Research Chair on Process Analytical Technologies (PAT) in pharmaceutical engineering. This unique partnership seeks to develop tools and methods to measure critical process parameters as well as monitor and control the processing of particulate solids.
Antoine Cournoyer is Senior Manager within the Manufacturing Intelligence team in Global Technology and Engineering at Pfizer. In his role, he currently supports, PAT, Data Analytics and Process Analytics development and implementation projects for the Sterile injectable sites mainly across North America and Asia. Antoine joined Pfizer in 2003 working in Technical Services at the Montréal manufacturing site. He then became PAT Scientist and worked in a global PAT development and implementation role as part of the Montréal, Québec, Canada team. Antoine holds an MBA, a Master degree in Pharmaceutical sciences and a Bachelor degree in Chemical Engineering.