Associated Vendor :
Abstract
Pharmaceutical manufacturing continues to expand the use of Raman spectroscopy and is especially useful in CHO cell-based processes such as mAb production. By developing models, Raman can be used to measure and control various aspects of upstream and downstream biological manufacturing. The upstream Raman models have demonstrated the capability to measure critical cell culture attributes and metabolic concentrations, however the accuracy of these measurements can vary.1 The prediction accuracy has been shown to improve by increasing the sampling frequency and adopting machine learning models which resulted in the ability to control metabolic concentrations within cell culture when enabled with closed loop control. Recent cell culture studies have accomplished glucose control within a ± 0.5 g/L range of the targeted concentration over the course of a multi-day process. The ability to successfully monitor and control glucose and other critical cell culture metabolites has provided insights and capabilities to increase titer production and provide more consistent product quality data while also greatly advancing the effectiveness of troubleshooting.
Introduction
Introduction to Quality by Design and Process Analytical Technologies
Implementation of new and advanced technologies play a major role in improving the manufacturing process of pharmaceutical products. Improving process consistency and process yield greatly benefits companies that produce complex molecules. It is important to produce as much drug substances as possible at the lowest cost while also ensuring the process and product adhere to patient safety, efficacy, and regulatory standards. In the early 2000’s the Food and Drug Administration (FDA) put forward the policy of Quality by Design (QbD). QbD is the systematic approach to pharmaceutical development and manufacturing with the idea of ensuring quality is built into a process by using systems, technologies, or analyses.2 Process Analytical Technology (PAT) is the tool that can help the industry realize the goals of the QbD initiative which focuses on using technology to improve the consistency of final product qualities. PAT is used to “measure or control quality and performance attributes to ensure final product quality”.3 The final stage of these technologies is implementation in the manufacturing process. However, before the final implementation there are often several stages of testing and proof of concept needed. Robust experimentation is important in understanding the technology’s limitations and capabilities before risking the compliance of the high-cost product, and the patient’s safety.
Subscribe to our e-Newsletters
Stay up to date with the latest news, articles, and events. Plus, get special offers
from American Pharmaceutical Review – all delivered right to your inbox! Sign up now!
Introduction to Raman
Process Analytical Technologies come in a range of shapes, sizes and a variety of uses. It has been shown that Raman spectroscopy is an increasingly useful technology for the manufacturing of mAbs and other complex biological products.1 Raman spectroscopy is the phenomenon of capturing light scattering from excitation of molecular bonds. The change in the scattered light’s wavelength is unique and based on the polarizability of a particle. There are examples which have shown that Raman spectroscopy can be used to identify and check the quality of key raw materials, monitor metabolite concentrations, and control various cell culture parameters.1 Raman is especially useful in the production of mAbs due to the nature of the media used. Water has low polarizability and therefore does not create high background noise when analyzing the spectrum of a water-based process.4
Raman probes when used in-situ allow real-time monitoring of the cell culture process through models built using Raman spectra. Using these real-time Raman-backed predictions, experiments have shown that different metabolite concentrations can be controlled.1 The capability to control different metabolite concentrations enables more complex nutrient screening experiments and more exact feeding strategies. The real-time predictions can greatly improve process understanding by pinpointing the metabolic shift from lactate production to consumption. By combining the process knowledge gained from the real-time predictions and the nutrient understanding from the metabolite control experiments, the titer production can be increased, and the product quality can be more consistent. Improving prediction accuracy and designing new control schemes are two major development areas for Raman technology that are being investigated.
Raman Integration and Process Development
Objective
The effectiveness of using Raman technology to trend and control mAb manufacturing needs to be understood for a successful GMP implementation. To have greater understanding of the technology’s capabilities, several small-scale experiments were designed to expand and test these capabilities. The objective of these experiments was to improve the Raman analyzing process thus optimizing the modelling accuracy to develop advanced capabilities. Improving the Raman analyzing process would increase the consistency of the prediction accuracy while also determining strategies to make implementation into a GMP commercial manufacturing suite more seamless. To further build lab capabilities, trending real-time metabolites and culture health enables decisions to be made to manipulate feed strategies or change the raw material composition entirely based on lower than expected productivity. Enabling Raman based glucose control is another valuable capability. For example, small-scale studies may be conducted to determine the most effective glucose range to maximize titer production while also meeting product quality criteria.
The most important aspect of Raman technologies is the modelling capabilities. The Raman predictions are only as accurate as the model analyzing the spectra. Typically, Raman models rely heavily on robust historical data sets to pull from. Given the large number of products in an organization’s portfolio and subsequent process changes, robust historical data sets can be difficult to generate. To support advancement of Raman technology, a novel learning model, referred to as Real-Time Just-In-Time learning (RT-JITL) was created.5 It is a machine learning model that is superior for its use because of its ability to self-calibrate.5 The model is capable of readjusting its predictions by taking off-line sampling data as it becomes available to improve model accuracy. At the beginning of these experiments off-line samples were scheduled every 24 hours and therefore the model was recalibrating itself on the same schedule. However, as the experiments progressed, additional off-line samples were scheduled to help increases the model’s accuracy. The ability of the model to recalibrate increase the confidence in the accuracy of the predictions when analyzing new processes that do not have large databases to support the model. For products with robust data sets, the ability to recalibrate the model adds additional accuracy.
Experiment Design and Rationale
Two experiments consisting, of monoclonal antibody fed batch upstream processes were designed to evaluate and improve the Raman JITL modelling process with best practices. The Raman probe is set up to send newly acquired spectra data to a network which houses the RT-JITL machine learning model used to translate the data into the desired predictions. Visualizations were developed to decipher the metabolite trends and discover inconsistencies within the model. For these experiments the Raman RT-JITL model focused on predicting glucose, glutamine, glutamate, lactate, viable cell density, viability, and titer.
The first experiment was designed to ensure communication between the network, Raman and visualizations were functioning properly. The greatest advantage of the RT-JITL model is the ability to model without prior datasets. The experiment sought to validate the ability of the RT-JITL model to determine the metabolite concentrations and cell culture indicators of a process with no prior Raman data. Once model outputs were validated against off-line measurements, the decision could be made to make changes to the process such as manipulating the feed scheme. Since Raman data is collected much more frequently than analytical samples, the time when the culture’s nutrients supplied by either the basal media or media feeds begins to deplete can be easily established. The Raman derived insights enable decisions to change the total number, the volume, or the timing of feeds. The second experiment focused on controlling glucose using the lessons learned from the first experiment. The goal of controlling glucose with closed loop control was to understand the optimal glucose concentration for maximum titer production while also meeting in process characterization acceptance criteria.
Data and Analysis
The first experiment showed the ability to generate accurate predictions. The RT-JITL model produced 12% accuracy when measuring glucose. It was noticed the Raman model generated large noise and error following large bolus feeds. Due to the nature of the RT-JITL model, the error was reduced the next day following the model recalibration based on new offline data. Developing a process to avoid this high error section of the process was critical to ensuring the modelling predictions were accurate.
With this finding, changes were made to improve prediction accuracy. Post feed sampling was utilized in order to improve the accuracy following nutrient feeds. The post feed sampling was expected to limit the duration of the error following feeds by allowing the model to recalibrate itself with the additional off-line sample data. For the second experiment focused on implementing a Raman controlled glucose strategy, improving the model accuracy is critical. This experiment consisted of reactors with two different feeding strategies. One strategy employed the large bolus feed scheme used in the first experiment and the second strategy used a gradual feed scheme with lower feed volumes but additional feed times. The gradual feed scheme was expected to limit the impact that the bolus feeds had on the prediction error seen in the first experiment. The hope was to eliminate the large spikes in the predictions created by the large bolus feeds and thus improve the accuracy following the bolus feeds.
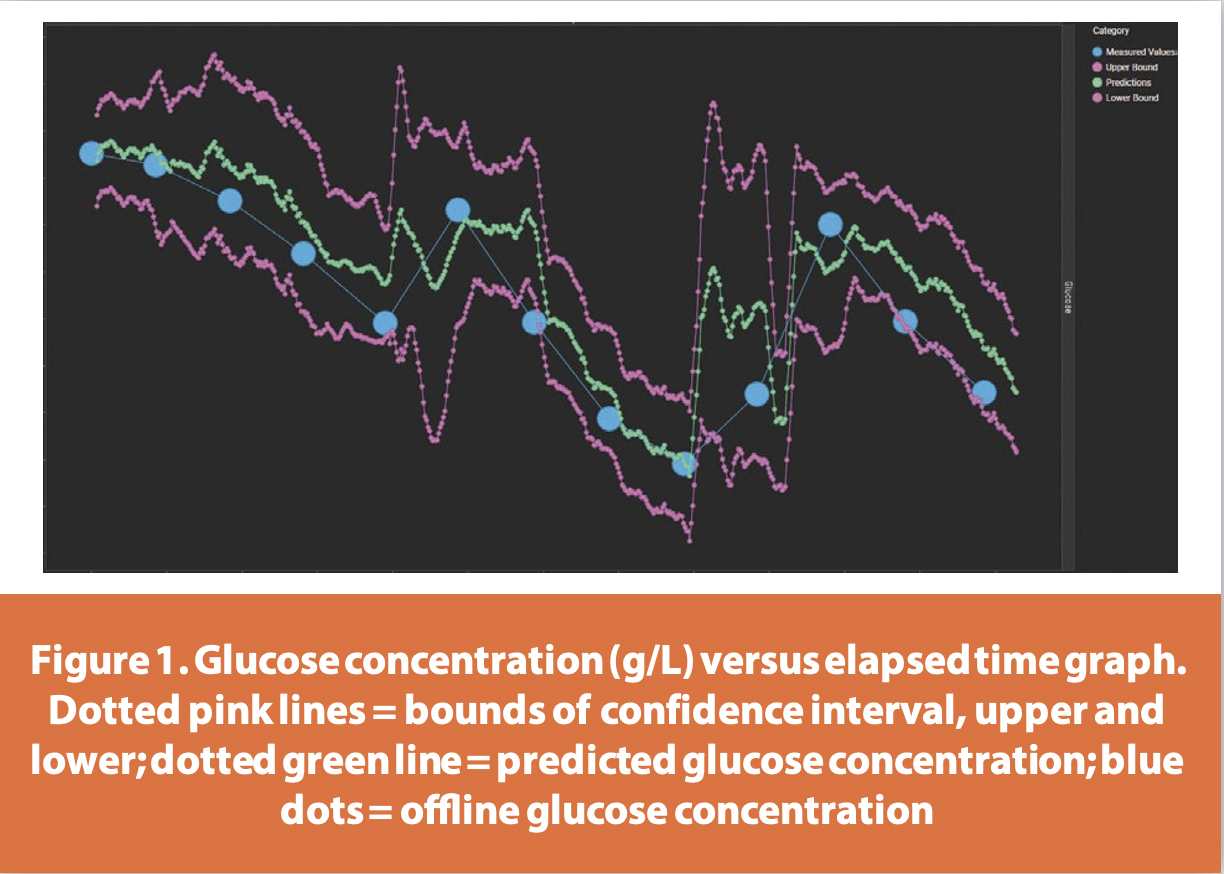
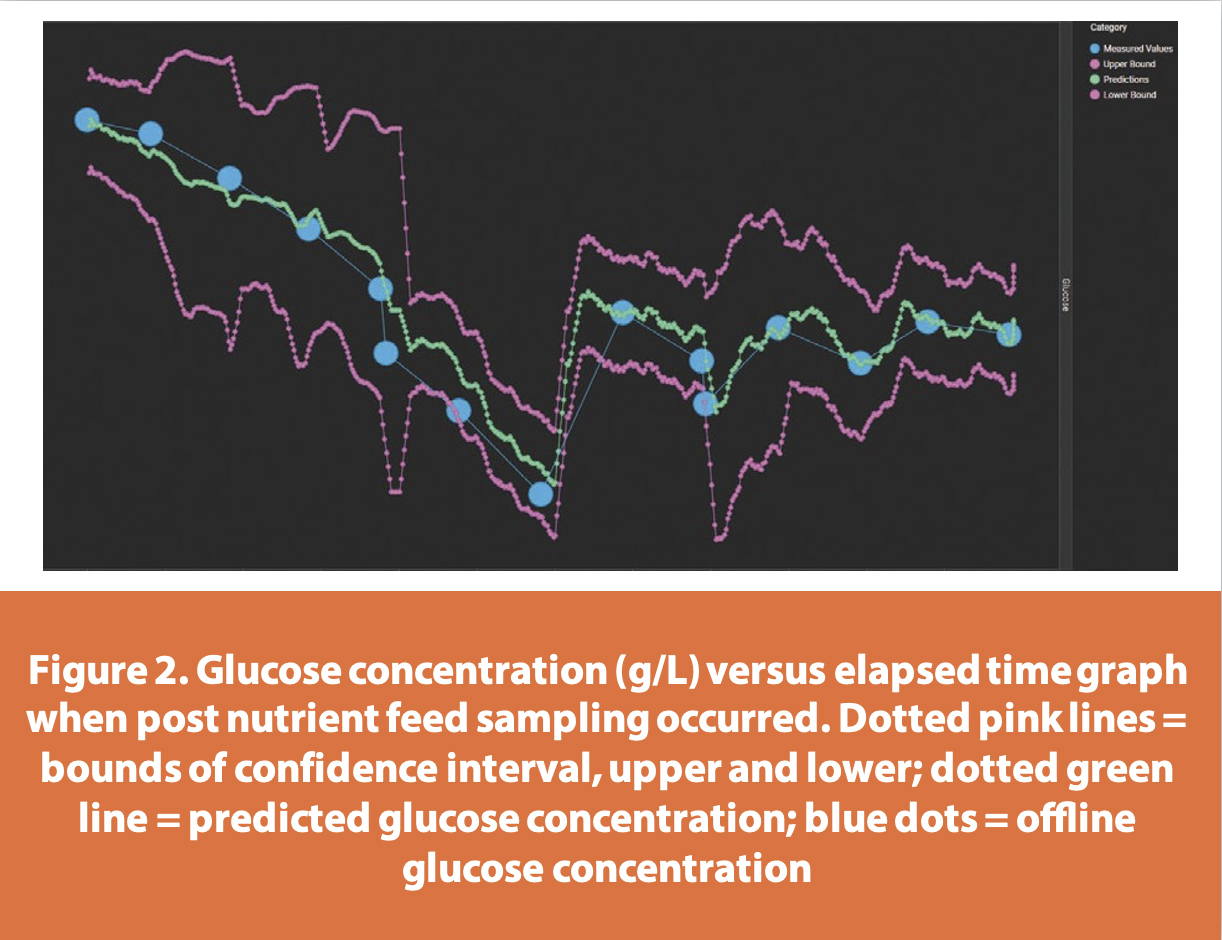
The prediction accuracy improved 6% from 12% in the first experiment to 6% in the second by implementing the post feed sampling strategy. The improvement in accuracy can be seen in Figures 1 and 2. The confidence interval for Figure 2 is significantly tighter especially following the feed days than in Figure 1. This change to the sequence of operations greatly improved the Raman controlled glucose strategy as realized by the tightening of the error during feeds. Subsequently the reduction in error helped ensure the glucose control was acting in the proper situations instead of over or under feeding. A proper glucose feeding strategy is critical to consistently produce mAbs. If the glucose concentration is too low, then the carbon source will switch. On the other hand, if the culture is over fed due to a bad control scheme or poor Raman predictions cell productivity can decrease.
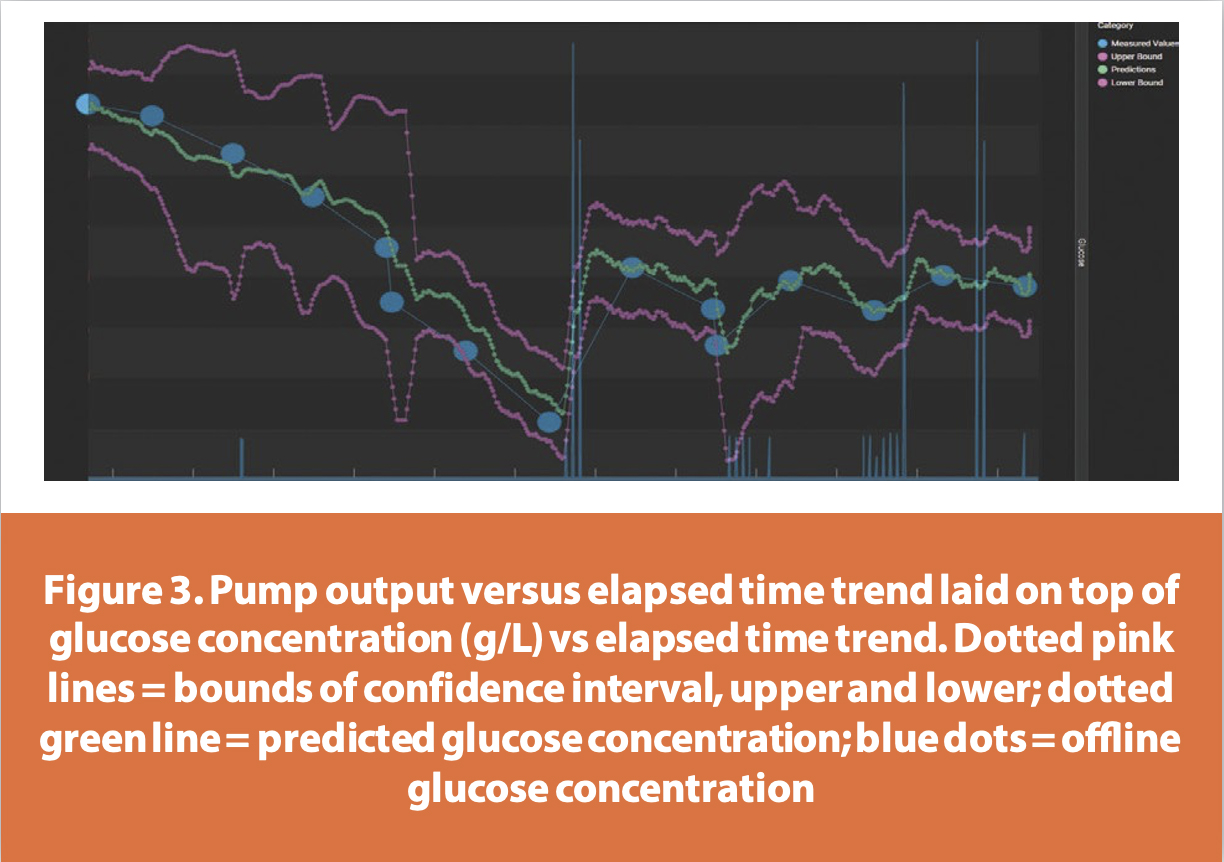
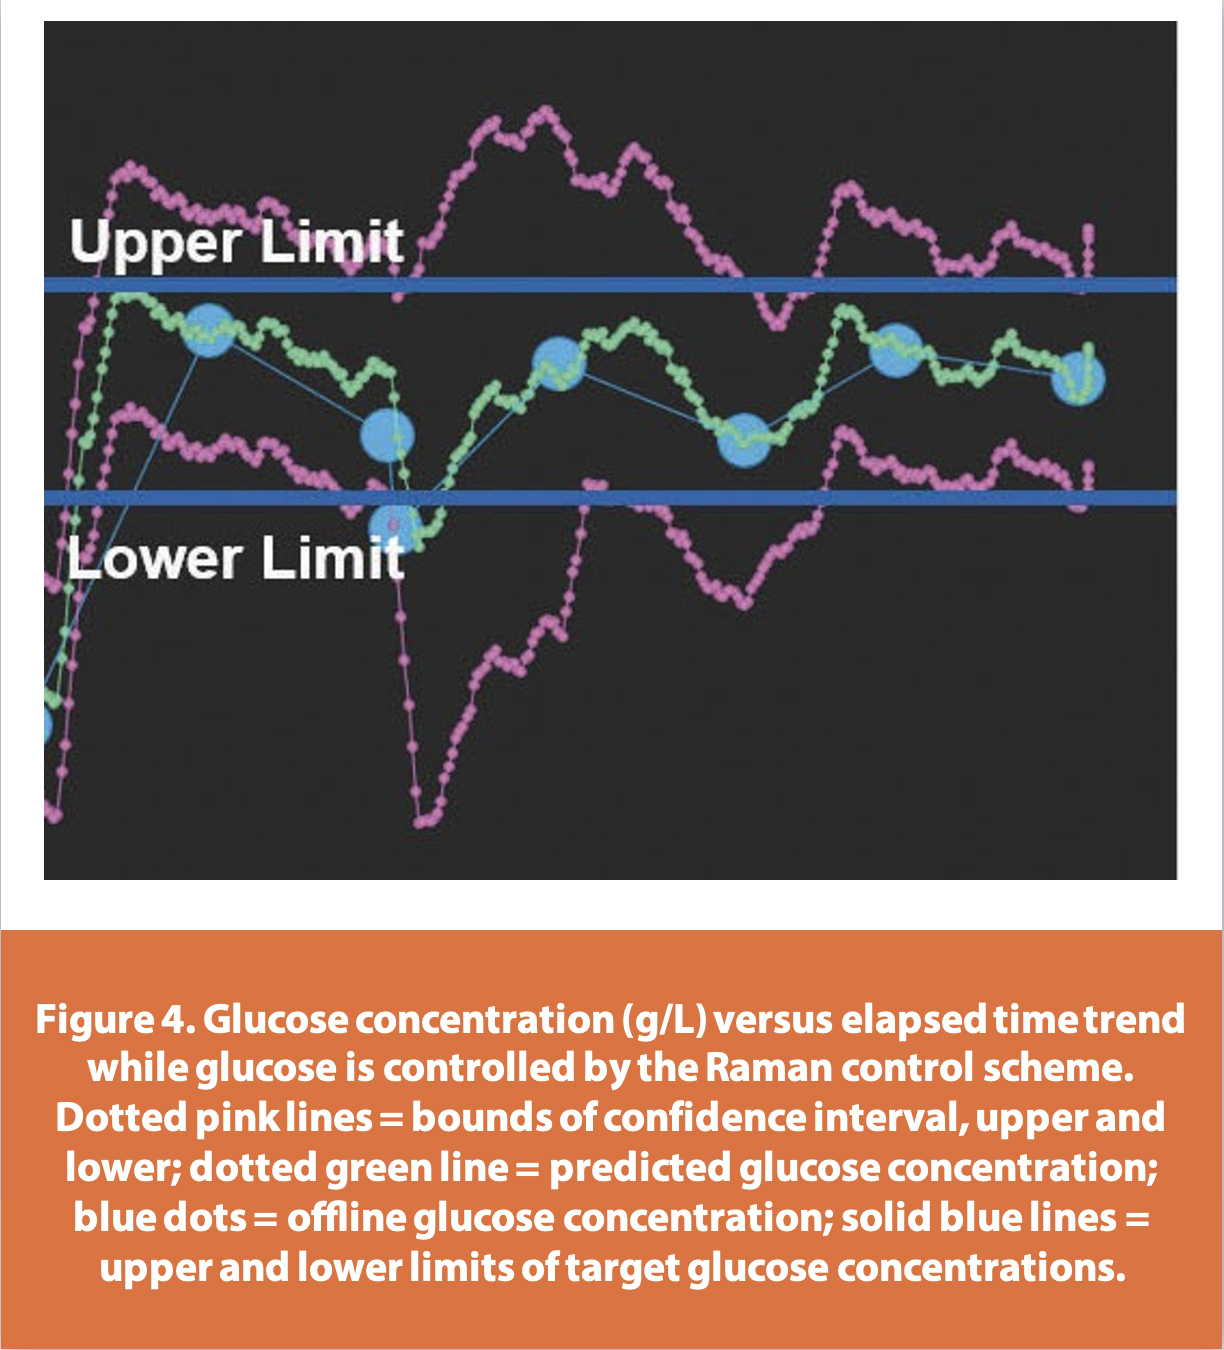
During the experiment, the Raman glucose control loop operated effectively. One important aspect of the experiment was the removal of glucose from the nutrient feed. This change ensured that all glucose fed to the system was fed from the closed loop glucose control. Figure 3 shows the reaction of the predicted glucose concentration to the activation of the glucose feed pump. As the glucose concentration drops out of the desired range, the pump kicked on and supplies the culture with the required glucose feed. The glucose concentration was able to be controlled within a +/- 0.5g/L range of the targeted concentration. The effectiveness of the control scheme can be seen in Figure 4. Figure 4 shows how the glucose concentration was maintained within the target glucose range throughout the duration of the experiment. The off-line sample point that falls out of the range in Figure 4 is due to a feed diluting the glucose concentration. Per Figure 3, the glucose control loop kicked in at this point and fed glucose until the concentration was back within the targeted range. The glucose control did not improve cell culture productivity, however. The final day titer values ended up being lower than the process average. The takeaway from this result is that the target glucose concentration was too low to supply the energy and carbon needed to maximize titer production. The takeaway can also be seen in the amount of glucose fed over the course of the experiment. In previous experiments more glucose was fed to the culture than was fed by the Raman glucose control loop. The target glucose concentration needs to be increased in order improve cell productivity and subsequently titer production.
Conclusion
Process analytical technologies such as Raman spectroscopy have the potential to drastically increase the efficiency of biological manufacturing processes. For upstream cell culture processes Raman was used for monitoring and controlling purposes. In order to ensure the most productive and accurate use of Raman, the complex machine learning model, RT-JITL, was used. Modelling accuracy is essential to making the most of Raman’s capabilities. The ability to recalibrate itself made the RT-JITL model highly successful in predicting metabolite concentrations and cell culture parameters. The RT-JITL model is designed to be accurate even when there is a lack of historical data to feed the model as shown in the first experiment. Using more frequent sampling especially directly after nutrient feeds, improved the modelling accuracy by 6%. The increased accuracy made the RT- JITL an effective model in a closed loop Raman control scheme. Even though the glucose control did not increase final day titer, the model was able to maintain the glucose concentration within a target range for the duration of the experiment.
References
- Esmonde-White K, Cuellar M, Uerpmann C, Lenain B, Lewis I. Raman spectroscopy as a process analytical technology for pharmaceutical manufacturing and bioprocessing. Anal Bioanal Chem. 2016;409(3):637-649. doi:10.1007/s00216-016-9824-1
- Quality Systems Approach to Pharmaceutical Current Good Manufacturing. U.S. Food and Drug Administration. https://www.fda.gov/regulatory-information/search-fda-guidance- documents/quality-systems-approach-pharmaceutical-current-good-manufacturing- practice-regulations. Published 2006. Accessed March 1, 2021.
- Guidance For Industry PAT - A Framework For Innovative Pharmaceutical Development, Manufacturing And Quality Assurance. Office of Training and Communication; 2004. https://www.fda.gov/regulatory-information/search-fda-guidance-documents/ pat-framework-innovative-pharmaceutical-development-manufacturing-and- quality-assurance. Accessed February 6, 2021.
- reserved M. Raman vs. IR Spectroscopy. Mt.com. https://www.mt.com/us/en/ home/applications/L1_AutoChem_Applications/Raman-Spectroscopy/raman-vs- ir-spectroscopy.html#:~:text=The%20differences%20between%20Raman%20 and%20IR%20spectroscopy%3A,absorption%20of%20light%20by%20molecules. Published 2021.
- Tulsyan A, Schorner G, Khodabandehlou H, Wang T, Coufal M, Undey C. A machine‐ learning approach to calibrate generic Raman models for real‐time monitoring of cell culture processes. Biotechnol Bioeng. 2019;116(10):2575-2586. doi:10.1002/ bit.27100
Author Biography
Matt Demers is a Senior Associate within Amgen’s Process Development organization and is pursuing a Master of Science in Biotechnology at Brown University. His thesis research focuses on Raman and PAT development for biologics manufacturing. Matt performed his undergraduate education at the University of Rhode Island. He majored in Chemical Engineering, graduating first in his class, and received a Nuclear Engineering minor.