Harald Ehlen - Sr. Bioanalytics Applications Specialist, Europe, Repligen Corporation
Joe Ferraiolo - Director, At-Line Applications, Bioprocess Analytics, Repligen Corporation
Paul Mania - Bioanalytics Applications Specialist - Repligen Corporation
Nigel Herbert - Sr. Bioanalytics Applications Specialist, Repligen Corporation
JiaBei Zhang - Research Associate I, Downstream Process Development - Gene Therapy, PTC Therapeutics, Inc.
Yan Chen - Senior Scientist, Downstream Process Development – Gene Therapy, PTC Therapeutics, Inc.
Ying Hou - Associate Director, Downstream Process Development – Gene Therapy, PTC Therapeutics, Inc.
Introduction
Today, one of the primary challenges in the production of consistent quality of recombinant adeno-associated virus (rAAV) remains the fact that current analytical tools are insufficient to meet all needs, due to high variability (CV 20%–40%), low sample throughput, long turnaround times, and thus the inability for true in-process testing. Real-time monitoring will reduce the risk of batch loss by eliminating the dependency on offline testing.
To understand how we can make vector bioprocessing faster and more cost-effective, it is important to detail the main technical challenges that currently exist in developing a robust analytical viral vector process.
One major challenge is that the process development cycle is time-consuming, especially when the process development team requires many development cycles for achieving a robust and consistent comparability between the development lots. The current analytical methods for evaluating the AAV titer during the final steps of purification are tedious and do not accurately assess viral concentrations. There is an urgent need to generate robust titer concentration data in real time. It should ideally be an analytical method to process an abundance of samples with no sample manipulation required.
Gene therapy companies want to maintain independence with their supply chain of raw materials for viral vector and mRNA-based products (e.g., plasmids). The ability to have rapid and reliable titer and purity assays for the starting material is critical for assessing the attributes of the product.
Much of the work being done with in-process testing requires wait/hold-up times while the material is being processed, which unfortunately doesn’t expedite the progress of the actual product itself. Our objective is to give scientists a tool to be able to analyze their samples in real time, without any sample manipulation, to understand exactly what stage they are at in the process. The focus is to give the industry the tool to make real-time decisions in the process, without requiring additional time to post calculations, without hold-up time, or only relying on the analytics technology that is currently available.
The main bottlenecks are in the development of the viral vector during the manufacturing process and having access to large amounts of samples. The first point of concern are the last two purification steps when the non-product-related impurities and the empty capsids must be removed from the final product (during TFF step). This requires multiple samples with different formulations. Running multiple development lots is required to know the optimal time to move forward with the engineering runs in manufacturing. At this point, multiple samples must be analyzed quickly to define the many conditions affecting product shelf life for the best possible formulation, storage, and shipment.
Furthermore, as has been referenced in Gimpel et. al., results between orthogonal methods are often not in agreement. There is a great need for better at-line process controls, offering quick and direct total viral vector analysis, with high dynamic range during development to enhance throughput and improve decision-making. Real-time monitoring will reduce the risk of batch loss by eliminating the dependency on offline testing.
In gene therapy downstream process development involving viral vectors such as rAAV, each process development cycle is very time-consuming, and the process development team requires many development cycles before achieving a good, consistent process, good comparability between the development lots, and optimal product recovery yield. There is typically a delay between cycles due to the lack of in-process analytical test methods and the long turnaround times for results from having to send samples to an internal laboratory for testing, which often has its own backlog of test samples. Process development scientists must either wait for the results or proceed at risk; most often the former. The ability to have a rapid in-process analytical test method facilitates faster decision-making in process development, allowing acceleration of the stages in development and ultimately reducing the number of cycles and advancing much sooner to reliable and low-risk engineering runs followed by manufacturing runs. Reducing the number of cycles in process development saves not just raw materials and cost, it ultimately gets the gene therapy product to market faster.
We will discuss in this paper a rapid, two-minute reproducible method for titer determination of rAAV, which is a critical quality attribute (CQA). The ability to obtain a rapid and reliable titer would also allow gene therapy companies to gain or maintain independence from their supply chain of raw materials for viral vector and mRNA-based products, including plasmids.
Currently, there are four techniques to measure AAV titer and empty-full capsid ratios: Droplet digital PCR (ddPCR), ELISA, transmission electron microscopy (TEM), and analytical ultracentrifugation (AUC). ddPCR is precise but has a smaller dynamic range, therefore requiring exact sample dilution. ELISA and analytical ultracentrifugation require precise and time-consuming sample preparation for accurate results. TEM has the benefit of providing a visual analysis; however, manually counting a large number of particles within multiple images can be very time-consuming. Other methods that are currently being evaluated in the gene therapy market include high-performance liquid chromatography (HPLC), capillary electrophoresis, dynamic light scattering, and traditional UV-Vis spectroscopy.
Traditional UV-Vis spectroscopy utilizes a standard UV-visible spectrophotometer that uses a 10 mm fixed pathlength. When analyzing samples that are outside of the concentration range of the spectrophotometer, it is necessary to dilute or perform other manipulations on the sample to obtain a reliable reading. Careful manipulation of a sample can take between 30 minutes and 3 hours, depending on the operator and their expertise. More importantly, it increases the risk of error and the overall quality of the results.
One of the ways in which we can monitor the process is by using Repligen’s Slope Spectroscopy® method (Figure 1). Slope Spectroscopy is not an absolute absorbance-based technology. It is a UV technology that looks at the change of absorbance over multiple pathlengths of interest, generating a linear slope regression to calculate the OD (optical density) value. The R2 value (coefficient of determination) confirms how accurate the slope regression measurement is, resulting in a simple pass/fail metric.
The CTech™ SoloVPE® System is capable of undiluted sample analysis, without the need for any sample manipulation, in less than one minute. This enables the Slope Spectroscopy method to provide a process feedback control that allows for real-time decision-making and a significant increase in the overall quality of the measurement.
The SoloVPE data is processed immediately to allow more rapid process understanding and a design of experiments approach that can potentially reduce process development time for titer impurity measurement for multiple drug modalities, including proteins, plasmids and AAVs. Current methods such as dPCR/ELISA, qPCR/ELISA, ddPCR/ELISA, TEM, and AUC do not deliver results quickly or easily so that they can be implemented in real time. This impacts process control and creates risks which can result in process hold times or, most unfortunately of all, the overall integrity of the batch (see Table 1 for method comparison).
In this publication, the SoloVPE System will be compared against ddPCR, dPCR, qPCR, ELISA, and TEM to evaluate viral genome titer, viral capsid titer, and empty/full capsid ratios of AAV standards and customer-provided viral vectors. The purpose of this publication is to understand how and where a UV-Vis technique could potentially offer a solution to the industry to leverage our experience, and the progress we have made in using the Slope Spectroscopy method, to see if we can potentially reduce variability, increase the throughput due to no sample manipulations or dilution, and prove a more robust analytical tool for the industry.
Materials and Methods
Materials
Repligen
- SoloVPE instrument [Part No. SYS-VPE-SOLO5]
- Cary 60 UV-Vis spectrophotometer [Part No. IN-CARY 60 or Agilent Part No. G686OA]
- Fibrette® Optical Component [Part No. OF0002-P50]
- Fused silica vessel–small [Part No. OC0005-1]
- Fused silica vessel–micro [Part No. OC0005-3]
- Sample vessel holder–small [Part No. HM0178]
Virovek
- AAV 2 Empty [Lot No. 20-481]
- AAV 2 Full [Lot No. 19-460]
- AAV 8 Empty [Lot No. 21-413]
- AAV 8 Full [Lot No. 19-464]
- AAV 9 Empty [Lot No. 21-077]
- AAV 9 Full [Lot No. 19-475]
Vigene
- AAV 2 Empty [Lot No. AAV2-0720-ET]
- AAV 2 Full [Lot No. AAV2-0720-FL]
- AAV 8 Empty [Lot No. AAV8-0920-ET]
- AAV 8 Full [Lot No. AAV8-0720-FL]
- AAV 9 Empty [Lot No. AAV9-0720-ET]
- AAV 9 Full [Lot No. AAV9-0720-FL]
Bioprocessing Technology Institute (BTI)
- Bio-Rad QX200 Droplet Digital PCR System [Part No. 1864001]
- Qiagen QIAcuity Digital PCR System [Part No. 911001]
- Thermo Fisher Talos L120C TEM [Part No. N/A]
- Progen AAV2 Xpress ELISA kit [Part No. PRAAV2XP]
- AAV 2 [Lot No. Batch A – 100%]
- AAV 2 [Lot No. Batch A – 75%]
- AAV 2 [Lot No. Batch A – 50%]
- AAV 2 [Lot No. Batch A – 25%]
- AAV 2 [Lot No. Batch A – 0%]
- AAV 2 [Lot No. Batch B – 100%]
- AAV 2 [Lot No. Batch B – 75%]
- AAV 2 [Lot No. Batch B – 50%]
- AAV 2 [Lot No. Batch B – 25%]
- AAV 2 [Lot No. Batch B – 0%]
- AAV 2 [Lot No. Batch C – 100%]
- AAV 2 [Lot No. Batch C – 75%]
- AAV 2 [Lot No. Batch C – 50%]
- AAV 2 [Lot No. Batch C – 25%]
- AAV 2 [Lot No. Batch C – 0%]
Methods
Notes on AAV standards and samples used in this study
For the present study we have used AAV standards/reference materials obtained from Vigene and Virovek, as well as three AAV batches that were manufactured by the BTI in Singapore. The standards are widely accepted as standard material used in the gene therapy industry. Furthermore, using AAV standards that are provided with a certificate of analysis allowed us to compare the results obtained with UV-Vis variable pathlength technology with expected titer results obtained via the current technologies in order to investigate the accuracy of our new method. Lastly, the standards represent AAV material purified through standardized manufacturing processes with minimal levels of host cell impurities that might impact spectroscopic data. AAV material manufactured by BTI was analyzed with different PCR methods, ELISA, and TEM for a comparative analysis of current AAV analytical technologies. For each batch (Batch A, Batch B, and Batch C) manufactured by BTI Singapore, two parallel processes were run. For one process, all three required plasmids were transfected into cells to yield AAV particles loaded with viral genomes (e.g., named Batch A Full). For the second process, only the expression plasmids were transfected to yield empty viral particles without a viral genome (e.g., named Batch A Empty). Additional samples from each batch were generated by volumetric mixing of empty and full samples from that batch and the ratios in the sample names depict the ratio of full/empty sample in the mixture, e.g., Batch A 75:25 corresponds to a mixture containing 75 vol% of Batch A Full and 25 vol% of Batch A Empty sample. However, as full capsids were not enriched in the process, a “Full” sample was not expected to consist of 100% full capsids. The actual %full results were determined in this study and are shown in Table 2.
Real-time PCR, ELISA, and TEM
For AAV standards, the titer, and empty/full data were retrieved from the manufacturer’s analysis certificates. For purified AAV samples obtained by BTI Singapore, viral capsid titers were determined using the AAV2 Xpress ELISA kit (Progen) according to the manufacturer’s instructions. Digital or droplet digital PCR analyses of viral genome titers were performed using the QIAcuity digital PCR system (Qiagen) or QX200 Droplet Digital PCR System (BioRad), respectively. Transmission electron microscopy analysis of empty and full viral capsids was conducted on a Talos L120C TEM system (Thermo Fisher Scientific). For estimation of %full results on the AAV batches, a limited number of images (three to four) were analyzed for each batch and sample, and full and empty capsids were counted (total of 500–700 particles per sample).
Slope Spectroscopy Measurements
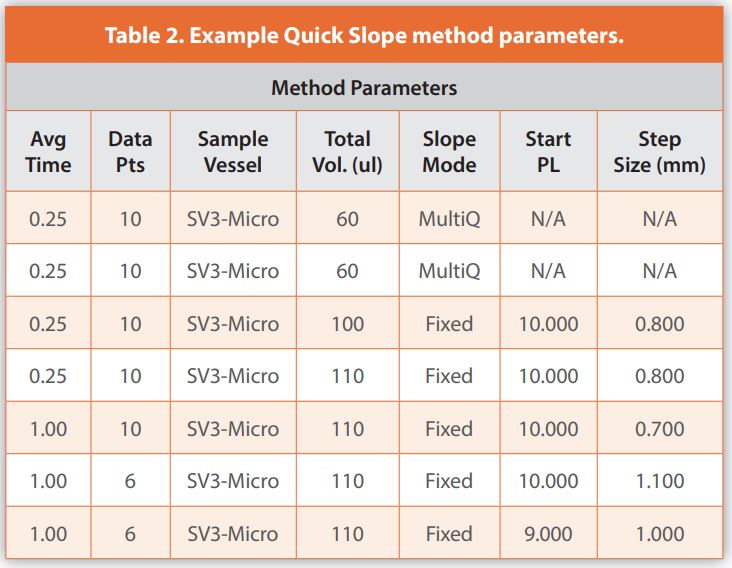
Slope absorbance measurements at 260 nm and 280 nm wavelength of AAV standards and in-process samples were performed using the SoloVPE System and analysis performed in SoloVPE System Software v3.1.338 using the Quick Slope application. Slope absorbance results were further processed using Microsoft Excel. A requirement for baseline correction was excluded by measuring the corresponding sample buffers for each sample and confirming that the buffers did not exhibit a slope higher than 0.01 Abs/mm at the wavelengths of interest. Quick Survey spectral scans across a series of pathlengths indicated no significant light scattering could be observed at 320 nm and/or 350 nm wavelengths. Hence, no scatter correction was applied in the measurements and samples were measured neat without sample preparation other than equilibration to ambient temperature and thorough mixing prior to measurement. The Quick Slope method parameters were adjusted according to sample concentration and available sample volumes (see Table 2), to achieve optimal R2 correlation coefficient values for the slope regressions. In brief, each measurement included 6 to 10 data points at varying pathlengths to generate linear regressions, with averaging times for each absorbance data point of 0.25 second or 1 second. Measurements were either taken in MultiQ-M mode (automatic pathlength optimization), when 5 mm maximum pathlength was sufficient, or Fixed-M mode (manual pathlength settings), when 10 mm maximum pathlength was required. For each sample and wavelength, triplicate measurements were performed to calculate mean slope values and %RSD.
Calculation of titer results and empty/full ratios based on slope absorbance data
Nucleic acids such as the AAV viral genome exhibit an absorption maximum at 260 nm wavelength whereas proteins, such as the AAV viral capsid proteins show a maximum at 280 nm, therefore the viral capsid and viral genome titers can be determined by absorbance measurements at those wavelengths. However, the spectral profiles of nucleic acids and proteins overlap to a certain extent, i.e., the capsid protein will contribute to absorbance measured at 260 nm and the viral nucleic acids will contribute to absorbance at 280 nm. When calculating titer data, the spectral overlap needs to be considered in the calculations. Total slope absorbances mfull at 260 nm or 280 nm wavelengths each consist of contributions from the AAV capsid proteins (mc ) and DNA (mD):
Based on the Beer-Lambert law (m=ε · x · conc; ε = extinction coefficient, conc = concentration), these equations can be expressed as:
Solving these equations for the concentrations results in:
Simplifying these equations by introducing the constants R and K, which are ratios of the extinction coefficients
yields:
Assuming one full AAV capsid will contain one viral genome, the percentage of full capsids in the sample can be calculated as:
For the AAV capsids, we applied the A260 and A280 extinction coefficients of 3.72 x 10⁶ M-1 cm-1 at 260 nm wavelength and 6.61 x 10⁶ M-1 cm-1 at 280 nm, which were experimentally determined by Sommer et al. (2003). For the viral genomes, the extinction coefficients were determined based on the average extinction coefficient for single- stranded DNA at 260 nm wavelength of 27 (mg/ml)-1 cm-1, multiplied with the molecular weight of the actual AAV genome sequences to convert into molar extinction coefficients. The extinction coefficients of DNA at 280 nm wavelength were calculated as 0.555x the EC at 260 nm wavelength based on A260/A280 ratio of 1.8 for pure DNA.
Percent difference data were calculated to compare SoloVPE vg and cp titer results with results obtained through other methods such as quantitative PCR and ELISA. When titer data were compared, %difference was calculated on a log10 scale ε · x · conc; (e.g.:
a procedure often followed in the industry. For percent difference calculations of %full data, however, results were not expressed in logarithmic scale.
Results
AAV samples of different serotypes from Virovek, Vigene, and BTI were used to validate viral genome titer, viral capsid titer, and empty/full capsid ratios with the SoloVPE System. Method accuracy, linearity, repeatability, and precision were all assessed. Expected viral genome titers were performed either by dPCR, ddPCR, qPCR, or TEM, and expected viral capsid titers were performed by ELISA. Capsid titers of AAV standards obtained from Virovek were determined by the manufacturer using a proprietary densitometric assay. Each test performed on the SoloVPE was measured using a micro fused silica vessel with at least 60 microliters of volume. All results within each validation study demonstrated great agreement against the current technologies.
Accuracy
The full and empty AAV2, AAV8, and AAV9 standards, provided by Vigene, were used to assess the accuracy of the SoloVPE System. The system compared the various serotypes against qPCR and ELISA to evaluate differences in viral genome titer as well as viral capsid titer.
All results demonstrated a log10 %difference below 25% against each method (Table 3). Similar to the precision data, the viral capsid titer results showed greater agreement than the viral genome titer results. The SoloVPE System demonstrated fair agreement compared to other technologies (Table 3).
Accuracy of this method was demonstrated from the precision, linearity, and repeatability assessments. The criterion within each test method was met, and all results were within specifications based on the information provided by our current collaborators. As a result, the method is considered accurate for analyzing viral genome titer, viral capsid titer, and %empty/full ratio.
Linearity
The AAV9 Full [Lot No. 19-475], provided by Virovek, was used to assess the linearity of the SoloVPE System. A dilution series of the material was made and measured on the system. The dilution consisted of the AAV9 stock solution and water, which can be seen in Table 4. The stock solution was first measured by qPCR and the SoloVPE to determine the viral genome titer. Based on the dilution, the expected viral genome titer was calculated using the qPCR stock measurement as the base value. The SoloVPE System was used to measure the viral genome titer of each diluted sample. Table 4 demonstrates that the R2 value for each slope measurement was ≥0.999. Figure 2 demonstrates great linear agreement between the measured values and the expected values, resulting in an R2 of 0.9996. The expected genome titer dynamic range of the sample was between 1.8E+13 and 3.375E+11.
Repeatability
The full and empty AAV2, AAV8, and AAV9 lots, provided by Virovek, were used to assess the repeatability of the SoloVPE System. The samples were measured in triplicate, using the same Fibrette Optical Component, and the same aliquoted sample within the same sample vessel. All samples required the same method parameters for analysis. Repeatability of the triplicate slopes and viral genome titer measurements were below 2%, demonstrating repeatable results for three serotypes (Table 6).
Note: Capsid titer data marked with an asterisk were not determined by ELISA, but back calculated based on empty/full ratios determined by size exclusion chromatography-multi angle light scattering (SEC-MALS) and the vg titer determined by qPCR.
Precision—Reproducibility
The AAV2 samples provided by BTI were used to assess the precision of the SoloVPE System. The system compared several batches of the sample against qPCR, ddPCR, and dPCR to evaluate differences in viral genome titer. Most results demonstrated a log10 %difference below 20% against each method (Table 7). Additionally, the system’s viral capsid titer results were compared against the ELISA method. All results were also well below 20%, showing greater agreement than the viral genome titer results (Table 8). The percent empty/full capsid ratios were evaluated with the SoloVPE and compared against the values that were determined by qPCR, ddPCR, dPCR, and TEM. The ratios were calculated using the viral genome titer and viral capsid titer results. The SoloVPE demonstrated fair agreement compared to the other technologies (Table 9).
In-Process Application
Cell culture harvest containing an AAV gene therapy candidate was used for downstream purification process development at PTC Therapeutics Inc. Unit operations tested include affinity chromatography, polishing chromatography, and Tangential Flow Filtration (TFF). Selected in-process samples from various runs were tested using SoloVPE System to obtain genome titer and capsid titer. The genome titer results were compared against a qPCR assay, and the capsid titer results were compared against an ELISA assay. Some samples were also tested by SEC-MALS. The SoloVPE System demonstrated fair agreement against qPCR and ELISA, with the largest viral genome log10 %difference being 7.32% and the largest capsid genome log10 %difference being 5.96% (Table 10).
We also calculated the percentage of full capsids based on the measured viral genome and capsid titers for the AAV in-process samples. Based on qPCR/ELISA data, the %full numbers ranged from 0.56% for the empty sample to 27% for a TFF2 load sample. SoloVPE results were in excellent agreement with 7% or less difference to the qPCR/ELISA data, except for two samples exhibiting larger differences (see Table 11).
Additionally, 37 samples that underwent post-affinity chromatography were compared against the SoloVPE and qPCR. The intermediate samples showed excellent correlation between the two methods when assessing viral titer concentrations. The linear correlation can be seen in Figure 3.
Discussion
Our present study demonstrates the suitability of the SoloVPE System for viral genome and capsid titer determination as a rapid and easy-to-use method that can be performed at-line in a process development environment. All measurements of AAV samples were performed in triplicates and linear regressions of absorbance/pathlength data achieved an R2 ≥0.999, showing that each measurement was in linear relationship with Beer’s law. In the repeatability study, all triplicate serotypes performed on the SoloVPE demonstrated %RSD results ≤2% for the measured m260 and m280 slope data as well as calculated genome titers. It is imperative to note that the current technologies have a much wider tolerance for viral titer analysis. Even with trained operators and careful sample preparation, these methods can produce much higher %RSD than the ±2% typically achieved with the SoloVPE System. In a recent review article detailing current analytical technologies for AAV, Gimpel et al. (2021) discussed %RSD ranges for PCR-based titer determination methods of up to 30% and ELISA of up to 15%, leading to nearly 40% RSD when both methods are combined for empty/full determination. Moreover, ELISA methods typically exhibit a dynamic range of only 1–2 logs, i.e., that sample concentrations often need to be adjusted via laborious dilution steps to allow measurement, whereas all samples were measured neat on the SoloVPE System. Even the choice of PCR method can lead to substantial differences in genome titer results, as seen in the results of our comparative study using the AAV material from BTI (see Table 7). Additionally, the Vigene AAV2 Empty sample was tested by both qPCR (see Table 3) and ddPCR, (not shown) where qPCR testing was performed by Vigene, and ddPCR testing at Repligen. The qPCR test resulted in a viral genome titer of 6.35E+09 vg/ml and the ddPCR gave a viral genome titer of 2.20E+08. Both methods are considered industry standards, even though these titer results differ by nearly 15% on a log10 scale.
When compared to the other methods, the SoloVPE System demonstrated reproducible, linear, repeatable, and accurate results. In the precision study, the viral genome titer log10 %differences were all below 12% except for one sample. Additionally, the viral capsid titer log10 %differences were below 2%, showing excellent agreement between SoloVPE and PCR and ELISA data. In the linearity study, the SoloVPE System exhibited excellent dilution linearity with an R2 of 0.9996 over the tested concentration range of 1.7E+13 to 4.1E+11, which also matched closely with the expected titer results based on qPCR data for the undiluted stock. The undiluted stock representing a fairly high concentrated AAV sample of ~1.8E+13 vg/ml showed m260 slope results of ~0.23 Abs/mm and m280 slope results of ~0.15 Abs/mm. It is known from other applications with highly absorbing or highly concentrated molecules such as plasmids or monoclonal antibodies, that the SoloVPE System can easily measure slope absorbances of 50 Abs/mm and higher. Based on this, we hypothesize that the SoloVPE System can reach an upper limit of quantitation of at least 1.0E+15 vg/ml, but we could not obtain samples concentrated higher than 3.8E+13 for the present study. Nevertheless, our data indicate a dynamic range for the SoloVPE System from the low to mid E+11 range up to low E+15 vg/ml.
We also compared the SoloVPE data to current methods in an accuracy study. In this set of measurements of three AAV serotypes obtained from Virovek, the viral genome titer log10 %differences were all below 9% except for the AAV 2 Empty sample. Additionally, the viral capsid titer log10 %differences were below 4%, showing great agreement. A comparative study of SoloVPE System versus three different PCR methods (qPCR, dPCR, and ddPCR) using AAV material manufactured by BTI in Singapore showed that the difference between SoloVPE System and the individual PCR methods was less than 10% on a log10 scale for most samples, and a similar difference in-between the different PCR methods was observed (see Table 7). In addition, the determination of AAV capsid titer by SoloVPE or ELISA methods showed high comparability of both methods (see Table 8). In a similar study performed with PTC Therapeutics, the SoloVPE System was used for determination of viral genome and capsid titers of in-process samples. Comparing those data with qPCR/ELISA results for the same samples shows excellent agreement of the results, proving suitability of the SoloVPE System as an at-line test for the later process steps in an AAV downstream process, post-Chrom1, at Chrom2, and at TFF2 steps.
In the present study, we also assessed if the SoloVPE method can be applied to estimate the ratio of empty and full AAV capsids, which is crucial to understand since empty AAV capsids are considered process-related impurities. The %full values were calculated based on vg and cp titers determined by different methods on a subset of samples from BTI and the in-process samples from PTC Therapeutics. In general, %full results determined by the SoloVPE System were closely matching the PCR/ELISA data (PTC samples) or at least showing the same trend as the other methods demonstrating that the SoloVPE System provides a rapid method for empty/full analyses. Calculated %full data for the AAV samples from BTI showed some variation between all of the tested methods, which were the SoloVPE System, qPCR/ELISA, dPCR/ ELISA, ddPCR/ELISA, and TEM. A certain spreading of results obtained by different methods was expected, as the %full results are calculated from the results of capsid and genome titer data so that the uncertainty of the %full results is comprised of the combined (progressed) errors for both methods. Nevertheless, SoloVPE and PCR methods all showed the same trend of %full data for the different samples. In this particular data set, empty samples appeared to have a higher %full ratio than determined by qPCR methods. This could be due to host cell impurities in the tested AAV material, for which the level of residual host cell DNA was not assessed. Even for the three different PCR methods, empty capsids that were expressed without a genome showed vg titers in the E+10 to E+11 range, indicating the presence of unspecific DNA targets in the samples. The SoloVPE method is not specific to DNA sequence and might therefore be able to measure higher levels of unspecific nucleic acid impurities than PCR. In contrast, %full data calculated for the in-process samples from PTC Therapeutics showed excellent agreement for most samples with %differences of less than 7% further demonstrating feasibility of the SoloVPE method for empty/full assessment and providing additional indication that a higher deviation between SoloVPE %full data and other methods may be sample related. Gaining a better understanding of which factors impact accuracy of the SoloVPE method for empty/full determination remains a question for further studies.
In summary, the SoloVPE System can accurately measure viral vectors between viral titers of E+11 vg/ml and E+14 vg/ml. Our data has demonstrated that the linearity and accuracy begin to fall outside its acceptance criteria if samples are measured below the range of E+11. The dynamic range of the SoloVPE will allow for samples exceeding the E+14 range. In addition, our results show that the serotype of the viral vector does not have any influence on the range at which the system can measure. The calculation of empty/full data from the determined titer data further provides valuable information on empty capsid as a process-related impurity.
The SoloVPE System provides a significant advantage in terms of time to results and ease of use of the system compared with the technologies predominantly established in the industry at present. A triplicate combined measurement of viral genome and capsid titers typically takes less than five minutes and requires no sample preparation other than equilibration of the sample to room temperature and thorough mixing. Compared to any of the other current methods that can take a day to weeks and requires extensive training of analysts, the SoloVPE method provides substantial time savings. Therefore, the SoloVPE System is highly suitable as an at-line test in downstream processing in process development to make real-time decisions especially during the late bioprocessing steps. For other biotherapeutic modalities such as mAbs, bioconjugates, and recently mRNA, the SoloVPE is routinely implemented as at-line test in GMP manufacturing, which could also be a perspective for viral titer determination.
These current methods are still required to analyze the early steps of the bioprocess when high levels of host cell DNA and protein impurities would falsify the SoloVPE results. However, as the current study with the PTC Therapeutics in-process samples demonstrate, the SoloVPE System is well suited for rapid analytics following post-affinity chromatography steps when most of the impurities are removed. An excellent example of added value for a rapid AAV titer would be just prior to the TFF2 step. Being able to know the titer just before the TFF2 step would allow you to plan your diafiltration and buffer exchange steps for your first step of TFF2, thus preventing any chance of over-concentrating your drug substance and having to then dilute it down. For the second step of TFF2, a rapid titer concentration from the SoloVPE System would enable you to determine the dosing for your second step of TFF2 during the formulation step for your drug product. In addition, the CTech™ FlowVPX® System can be implemented as an in-line process monitoring tool for real-time monitoring of AAV titer during the TFF process, using the same Slope Spectroscopy method as the principal technology for true process analytics.
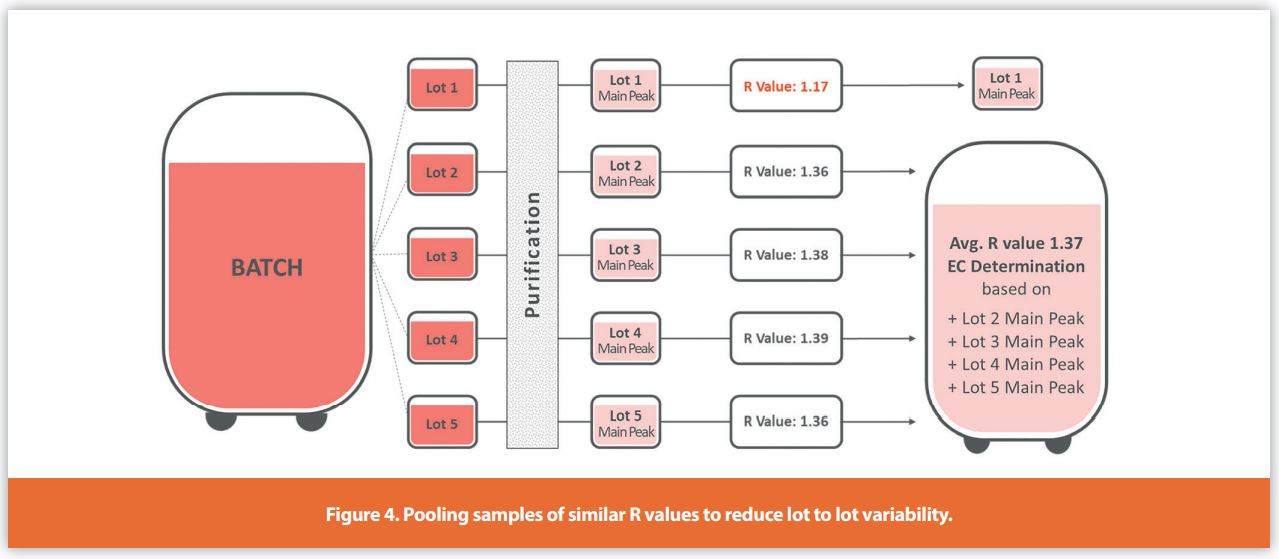
The titer data generated by the SoloVPE System can be processed to determine empty/full ratios of the AAV samples. Alternatively, the ratio of m260 and m280 slope absorbance data (R value) can already provide an estimation of the percentage of full capsids in a process sample. Several studies have shown that there is a direct correlation between the R value and the %full data (e.g., Sommer et al. 2003), where an R value of ~0.6 and ~1.5 corresponds to 0% or 100% full capsids, respectively. Therefore, assessment of the R value can provide rapid information e.g., on lot-to-lot comparability or quick characterization of fractions eluted from an ion exchange or size exclusion chromatography. This strategy could also provide flexibility when the whole production harvest shall not be processed at one time, but instead, splitting the harvest into multiple lots that are processed separately that can be analyzed simultaneously. The ability to make decisions rapidly allows users to avoid losing the batch and verify the consistency of each lot prior to the pooling.
It is important to emphasize that the context of this publication is not to replace the current analytical methods. However, through collaborations with our customers, the consensus is that Slope Spectroscopy method represents a solid complementary analytical tool for providing real-time feedback and eliminates the wait times associated with the current methods which influence how quickly or slowly the process goes through step-to-step changes. The SoloVPE System requires little to no sample preparation, operation and maintenance, and operator training, generating accurate data in less than a minute. The SoloVPE System has proven to be a reliable analytical method to support viral vector analysis.
Acknowledgements
Eric Shih, Director, R&D, Repligen Corporation
Rene Gantier, Senior R&D Director, Advanced Bioprocess Applications, Repligen Corporation
Zai Zakaria, M.S., Global Commercial Lead – Strategy & Innovation, Repligen Corporation
References
- Gimpel, A. L., et al. Analytical methods for process and product characterization of recombinant adeno-associated virus-based gene therapies. PDF file. March 2021. www. moleculartherapy.org
- Wright, J.F. Manufacturing and characterizing AAV-based vectors for use in clinical studies. PDF file. April 17, 2008. www.nature.com/gt
- Taylor, S.C., Laperriere, G., & Germain, H. Droplet digital PCR versus qPCR for gene expression analysis with low abundant targets: from variable nonsense to publication quality dataI. PDF file. May 25, 2017. www.nature.com/scientificreports
- Sommer, J.M., Smith, P.H., Parthasarathy, S., Isaacs, J., Vijay, S., Kieran, J., Powell, S.K., McClelland, A., & Wright, J.F. (2003). Quantification of adeno-associated virus particles and empty capsids by optical density measurement. Molecular therapy: The journal of the American Society of Gene Therapy. https://pubmed.ncbi.nlm.nih.gov/12573625/
Subscribe to our e-Newsletters
Stay up to date with the latest news, articles, and events. Plus, get special
offers from American Pharmaceutical Review – all delivered right to your inbox!
Sign up now!