Ernie Hillier- Principal Owner,EJH Consulting
This article will begin by reviewing the Guidance for Industry PAT - Framework for Innovative Pharmaceutical Development Manufacturing and Quality Assurance, written by the FDA in September 2004. It will discuss the core principles from the FDA initiative by considering the past 18 years of continuous improvement, ongoing innovation, and enhancements to existing technology. It will also cover the incorporation of new technologies and the implementations that are critical to the search for better learning, knowledge, understanding, and the control of a process. Increased knowledge allows for faster development times and a better controlled process, in which a higher quality product can be delivered in a timelier manner.
The FDA views Process Analytical Technology (PAT) as being a mechanism to design, analyze and control pharmaceutical manufacturing and processes throughout the measurement of Critical Process Parameters (CPP) which affect the Critical Quality Attributes (CQA). However, the FDA also suggests that this was not a state-of-the-art endeavor for pharmaceutical manufacturing, compared to other industries. Improving product quality came at a great effort and cost, and some of this was highlighted as product waste as high as 50%. There was also an inability to scale to final product, as well as additional concerns over the ability to analyze and understand the reasons for manufacturing failure.1
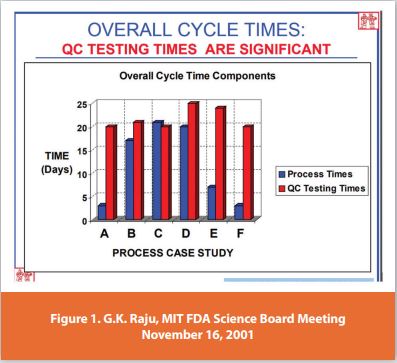
One early reference for the FDA was Professor G. K. Raju’s 2001 presentation to the FDA Science board,2 discussing manufacturing time versus Quality Control (QC) test times. In this presentation, one graph cited a manufacturing example with six companies comparing those parameters. By means of one example, one company had a three-day manufacturing time and a 20-day QC test time. We can consider what manufacturing does during those 17 days. Refer to Figure 1 below. What happens if, on day 17, QC finds a problem with the batch? Can the material be reworked? Will all the raw material from that process need to be thrown away? Professor Raju points out the ongoing challenges with testing quality throughout the process. As we know from the FDA’s point of view ‘quality cannot be tested into products; it should be built-in or should be by design.’3
As a result of a Quality by Testing paradigm, drug shortages and recalls were increasing at an alarming rate before the COVID-19 pandemic; since then, the raw material shortages have made the situation even more serious. As a final point, it has been consistently reported that $50 billion/year losses in manufacturing are caused by inefficient processes. Is it time to change this business model?
A model that incorporates Quality by Design (QbD) and PAT delivers a quality process and product. Within a corporation, an emphasis on quality should be a business priority from the initial design stages. Focusing on full process knowledge to implement total quality control should be the overarching focus for the business. When we look towards PAT processes, which provide an understanding of all steps in the workflow – with major technological improvements of the analytical tools – we can now see a path towards continuous manufacturing. The implementation of sensors and system measuring tools provides a greater understanding of the workflow and can be the final piece in the puzzle to ensure process and product control. Finally, using Critical Process Parameters (CPPs), we can gain process understanding and knowledge; measuring and deriving Critical Quality Attributes allows feedback and feed-forward control of the process to give higher yields and better product quality. In summation, this should provide the corporation with a solid and sustainable business model that delivers the highest quality product to the customer/patient, while providing a solid return on investment and a competitive advantage.
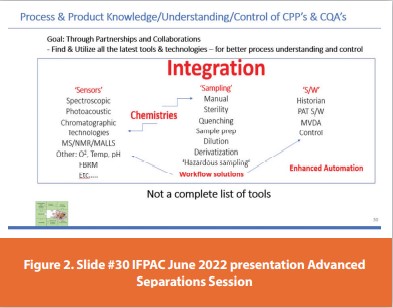
It is important to consider the tools that fit into a QbD/PAT implementation and to make Continuous Manufacturing a reality. Figure 2 is titled ‘Process & Product Knowledge/Understanding/Control of CPPs and CQAs’. The lists on the diagram contain several tools that are part of the scientist’s kit. Please note that this is not a complete list, and this paper will only touch on a few of them. The instruments fall into the following categories - Sampling, Chemistry, Sensors, and Software (S/W). As you can see, although this is not a complete list, it includes tools that are critical to each step in the workflow. The key takeaway from Figure 2 is the need to integrate all the tools, to have a holistic-system approach to make the timeline from drug discovery to manufacture both quicker and safer. This has been an ongoing process for the past 18 years and it is still ongoing. Progress has only been possible through scientific vision and endeavor, as well as meaningful collaborations between vendors and end-users of the hardware and software.

About chemistries specifically, this example focuses on column chemistries that apply to both UPLC and UHPLC. These chemistries would be applied specifically to LC hardware systems. The innovation that the breakthroughs and LC technology achieve is its combination of hardware systems that can operate at much higher pressures to be able to accommodate 1.2-micron chemistry columns that provide increases in chromatographic speed, sensitivity, and resolution to be part of the PAT Toolbox. Regarding sterility in sampling biologics, it’s paramount both for the proper functioning of a bioreactor and for delivering a debris free sample be delivered to the LC System which is the tool that is analyzing the CQA of interest (for example, amino acids or vitamins).
For processes in small molecule manufacturing, Figure 2 highlights the need to be aware of hazardous sampling scenarios, where proper attention must be paid to the safety of the operator and the facility to guard against potential explosions or exposure to toxins.
Figure 3 depicts the early sensors that were initially deployed as PAT tools within the manufacturing process. These sensors are still critical tools in both development and manufacturing; however, new innovations mean that more tools are becoming available all the time.
These tools are not new to the scientist in the laboratory, but they were not considered PAT tools in the early days. They are very powerful tools which expand the knowledge and understanding of the many complicated workflows that the scientist encounters in their search for knowledge – the tools listed and not listed in this article provide critical information about the process.
Choosing a specific tool for measuring CQAs within a process requires understanding of the type of data required and the speed of acquisition required. Other questions include: what are the levels of detection needed? What type of detector is needed?
Column chemistry is also useful for sensitivity and selectivity. How complicated is the process matrix? Is additional sample preparation needed? Can this workflow step be automated? Is there another sensor that could do the job that is simpler and meets the need?
High Performance Liquid Chromatography (HPLC) is the gold standard in the laboratory. The challenges with HPLC technology relate to the speed of analysis, when compared to spectrophotometric technologies. However, the breakthroughs in the speed, sensitivity, and resolution of HPLC technology, both from a hardware as well as a column chemistry perspective, have delivered a PAT solution for the laboratory and for continuous manufacturing.
Figure 4-A compares the speed of the HPLC versus the UPLC. The HPLC has a runtime of 25 minutes, while the UPLC takes 30 seconds to process the same chromatographic sample. Please note that, for Figure 4, the values are not hardened factors of all chromatographic separations, regarding the impact of speed, sensitivity, and resolution factors.
As we look at Figure 4-B, the sensitivity increase is also significant which provides the analyst with the ability to see lower levels of detection which were not available prior to this technological breakthrough.
Figure 4-C contains a comparison of peptide mapping with traditional HPLC and with UPLC technology. In the top chromatogram, there is a separation that yields 70 peaks – which is the level of performance that was delivered for probably around 40 years. In 2004, with the inception of UPLC technology, the exact same peptide map shows a total of 168 peaks. This reveals a 2.4 times increase in chromatographic information and knowledge for the peptide map in this example. Alongside an increase in the number of visible peaks, there is also an increase in sensitivity, which translates into much lower levels of detection. In this final example, the runtime for both the HPLC and UPLC is 60 minutes, however speed was not the driving force; the main goal was to optimize the chromatography to obtain the maximum amount of information from this peptide map. In all cases, the aim is to find the optimum conditions to provide the greatest amount of information about your process.
Other factors to consider when choosing the right sensor, or tool, include when the information is needed, whether a qualitative answer is good enough or whether a higher degree and a quantitative answer is required for that process knowledge at that point in time.
Figure 5 displays an array of PAT sensors and tools. Each have specific qualities that are essential for the measurement of the CQAs or CPPs. The information provided by the sensors and software packages delivers process knowledge and understanding, by enabling the monitoring and identification of CQAs and CPPs – which will then be input to the manufacturing control system. Each sensor, from a variety of potential instrument vendors, has specialized software as part of its analytical systems and outputs that communicates using a unique language.
In the laboratory, there are many analysts with different expertise and specialized equipment knowledge, who are subject matter experts with the various tools shown. As we consider the evolution of these technological tools and the great advances in process knowledge and understanding, the next step in the PAT journey is to integrate highly technical and analytical sensor data into a format that allows every process stakeholder to easily access and understand it, and to use it to control the manufacturing process.
Key PAT tools in the laboratory and manufacturing process include multivariate data analysis tools, historians, and control technologies. A central PAT hub, that operates as a knowledge manager facilitates improved understanding and control. The connection of the PAT puzzle pieces means that the industry can move with greater confidence towards continuous manufacturing.
Figure 6 provides an overview of how the PAT system can be configured, from the laboratory to manufacturing. It is not a complete picture of the complicated workflows in both the small and large molecule world, as there are many more steps, as well as other PAT sensors that are needed to complete it. The Distributed Control System (DCS) kicks off the process by communicating with the sampling devices and the Knowledge Management System. This begins the sampling process from a reactor to one of the many PAT sensor – in this case it’s a PATROL system. For a large molecule system, sampling is aseptic and clarified, and for small molecule it is safe. All controls and methods are initiated from the Empower software. Information from the Distributed Control System (DCS), Knowledge Management & Empower tells the PAT sensor system which reactor is delivering the sample and the type of analysis required.
Once the analysis is complete, the data returned (values, peak identifications, etc.) indicate the state of the reaction at that moment in time. The knowledge management system passes the information from to the control system which evaluates the values against the control tables and defines the adjustments that may need to be made to the reaction. If any action is required, the appropriate process changes will be initiated.
Several years ago, the possibility that separations, Mass Spectroscopy (MS) and Nuclear Magnetic Resonance (NMR) which are critical tools in the lab and now become part of continuous manufacturing was inconceivable. They were in the background, supporting PAT from a process learning perspective. High-end MS has been a major tool in biologics in the last couple of years, with its ability to deliver incredible amounts of information, using a Multi-Attribute Method (MAM). MAMs can handle a large amount of data on multiple CQA’s that would previously require multiple and different assays to be run.
In closing, we may assess the business impact of PAT and continuous manufacturing. For multiple major pharmaceutical companies, it has been proven to reduce raw material and inventory cost, reduce manufacturing footprint, and lower energy usage. This improved efficiency can deliver a positive environmental impact, as using fewer materials inherently produces less waste and rework. Further gains include improved quality, yield, flexibility, mobility, manufacturing utilization, and safety.
In essence, this strategy meets the FDA objective of fewer product recalls, higher quality, safer and more timely medications.
References
- IFPAC Annual Meeting Jan21-Jan 24, 2014, Lawrence X. Yu Ph.D. Director (acting) Offi ce of Pharmaceutical Science Food and Drug Administration
- PHARMACEUTICAL MANUFACTURING: NEW TECHNOLOGY OPPORTUNITIES... G.K. Raju Presentation November 16th, 2001
- FDA Guidance for Industry. PAT—A Framework for Innovative Pharmaceutical Development, Manufacturing, and Quality Assurance. September 2004.
Author Biography
After 39 years at Waters Ernie Hillier has retired and has formed EJH Consulting with the focus on helping the industry continue to evolve in Process Analytical Technology to implement Continuous Manufacturing. During his career, the roles have been in new HPLC systems and chemistry evaluation, Product Marketing for Detectors, Operations as Manager of the Technical Product Management Group responsible for Quality. In this last role this experience has led to a better understanding of process which has led to his final role His final role was Principal Systems Product Manager for PATROL (PAT), Alliance and Breeze Systems. He has a BS degree in Chemistry and Biology from Northeastern University. Ernie is also on the Scientific Board of IPFAC and chair of the Advanced Separations Session as well as on the International Scientific Advisory Board for Chemistry Today. Lastly working with a technical team supporting Separation Science in organizing and moderating Conferences and Expert panel discussions focused on QbD/PAT and Continuous Manufacturing.
Subscribe to our e-Newsletters
Stay up to date with the latest news, articles, and events. Plus, get special
offers from American Pharmaceutical Review delivered to your inbox!
Sign up now!