Scott Hooper-Director Microbiology / MRL AR&D, MSD AG
James Francis-Technical Director, Micron View LLC
Feng Jin Liew- Technology and Application Consultant, Mettler-Toledo Thornton
Mike Russ- Head of QCLS/Analytical Science and Technology, Genentech Inc
Allison Scott- Senior Principal Scientist, Azbil North America Research and Development – BioVigilant
Philip Villari- Associate Principal Scientist, Merck & Co., Inc.
Stefan Weber- Director Microbiology / MRL AR&D, MSD AG
Abstract
Bio-Fluorescent Particle Counters provide superior monitoring capabilities over the traditional plate count method due to their ability to monitor continuously with no sample preparation or manipulation, and also over classical particle counters due to their ability to discriminate between inert and biological particles. Resolving inert and biological particles from total particles can provide critical diagnostic information in air and water systems. This article presents four case studies illustrating the use of Bio-Fluorescent Particle Counters in resolving complex environmental monitoring investigations.
Bio-Fluorescent Particle Counters (BFPCs) are laser-based particle counting monitors used to measure inert and biological particles, referred to as Auto-Fluorescent Units (AFU), in clean water or air systems. The fact that the instruments can detect both inert and biological particles provides powerful advantages over classical particle counters, which only detect particles based on size without classifying them by type. Furthermore, the continuous as opposed to intermittent detection of biologic particles provides a distinct advantage over the traditional plate count method by offering a superior Environmental Monitoring (EM) profile of pharmaceutical manufacturing conditions for improved product quality decisions.
The Basis for Bio-Fluorescent Particle Counting Technology
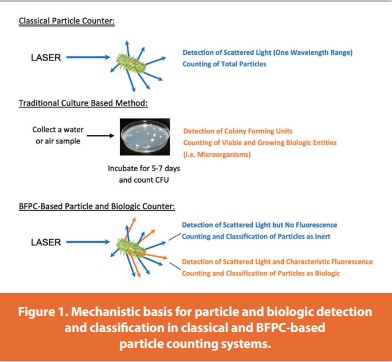
Particle counting has a long history, stretching back to the middle of the last century, and can be applied to both air and water systems. In these classical systems, a light beam intersects a stream of air or water. As a particle travels through the beam, the physics of light scatter allows detection of the particle and classification of its size via Mie scattering. BFPCs take this principle and layer on an additional level of detection. Biologicals (bacterial and fungi) contain biomolecules that fluoresce at specific wavelengths when illuminated by specific shorter wavelengths of light. The addition of another detector(s) in BFPC systems, tuned to a specific range of wavelengths, creates a system that detects particles and assigns the particles to presumptive biologic and inert categories. In contrast to Colony-Forming Units (CFU) derived from traditional culture-based sample analyses, the unit of measure for BFPC is the AFU. Figure 1 illustrates the mechanisms behind classical and BFPC-based particle counting in comparison with the traditional culture-based method.
The Need for Improved/Faster Environmental Monitoring Methods
On-going public health risks associated with COVID-19 and the need to manufacture billions of dosage units for worldwide distribution quickly have cast a spotlight on improving or replacing slow and inefficient methods of manufacturing. Among these methods is microbial environmental monitoring, which typically requires 5-7 days of incubation to obtain a result stating whether the process stream or environment was suitable or not. BFPC-based detection provides real-time feedback on the level of inert and biological particles in an environment, allowing enhanced process understanding of the environment that can save countless days of waiting on results. BFPCs also allow for rapid troubleshooting and diagnosis of environmental excursions. This supports product and production time savings due to the accelerated path to a root cause since the detection is not dependent on colony growth.
Real-World Use of BFPC Monitoring
While BFPCs have been commercially available for more than a decade, the number of open literature reports of fi eld applications is somewhat limited. An early report showed that a BFPC-based air monitor could provide comparable results at a faster rate than conventional methods in pharmaceutical cleanrooms.1 Similarly, Sandle et al. used the same model instrument to evaluate cleanroom conditions in real-time.2 In 2015, a study by Anders et al. demonstrated the utility of a BFPC water monitor for extending the hold time of a water system.3 Lipko et al. published their experiences with using a BFPC water analyzer for monitoring a high purity water system in 2018.4 Also in 2018, there were two studies published describing the use of BFPC analyzers (both air and water) for facilitating the re-start of production facilities.5,6
These studies clearly demonstrate that BFPC-based systems have advantages over conventional methodologies and are effectively employed in the industry. In addition to these reports, the following four case studies add to this body of knowledge. These examples illustrate a variety of uses for air and water BFPC monitoring systems.
Cleanroom Air Shutdown and Recovery Study: Case Study 1
The following case study at a pharmaceutical company shows a non-GMP investigation using an air-based BFPC to determine the impact and recovery time of shutting down the HVAC system in a Grade C cleanroom. Quality Assurance wanted to assess the impact of shutting down the HVAC system on biological and dust particles, as well as recovery of the environment after restarting. Personnel stated that they often have a short period, usually around two hours that the HVAC system is stopped. If the environment can be restored simply by running the HVAC system, there is no need to do extra cleaning and reconfirmation, which will save time and labor.
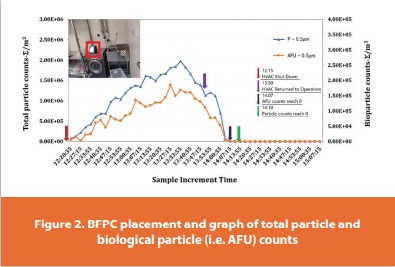
The BFPC was installed in a 12 square meter, Grade C laundry room. The HVAC system was stopped, all personnel left the area and the BFPC sample was started at 12:20 pm. The HVAC system was restarted at roughly 2:00 pm.
As shown in Figure 2, after the HVAC system was turned off, the AFU and total particle (P) counts began to rise. When the HVAC system was restarted, the AFU and total particle counts began to decline dramatically. The number of particles per meter cubed dropped to zero within 20 minutes of the HVAC restarting. It was determined that if the HVAC system was suspended for two hours and then restarted, without other measures, the system could complete self-purification within 20 minutes.
Verification of Claims of a Low Particulate Wall Refurbishment System: Case Study 2
An air-based BFPC has been approved for non-GMP use in classified and unclassified areas of a manufacturing facility as a troubleshooting and non-GMP investigational tool. The BFPC is used for quickly assessing conditions to pinpoint concerns, then standard GMP methods are used to develop the GMP data needed to confirm and close the investigation. Using the instrument in this manner cuts approximately one week of time and significant amounts of wet laboratory labor. In a novel non-GMP investigation, an air-based BFPC instrument was used to corroborate vendor claims that their proprietary wall surface abrasion and painting method was sufficiently clean that it could be used in classified spaces without causing environmental excursions.
The BFPC was stationed next to a test wall located in a controlled but not classified room and was programmed to repetitively sample the air over the course of the day, including the time throughout the vendor’s work. As shown on the left in Figure 3, air particulate counts showed the highest peak around 12:00 pm. Increased air particle levels can also be seen around 09:00 am, 10:00 am and for an extended period between 1:00 pm and 2:00 pm when abrasion and paintwork took place. Interestingly, air particulate levels are, although elevated, lower than during the period when manufacturing personnel left the production area for lunch.
These data verified the vendor’s claims that their wall abrasion and painting system could operate without generating excessive particulates and provided valuable insight into environmental condition dynamics in this controlled but non-classified room. It is also worth mentioning that the increase in biological air particulate levels also coincides with personnel flow in and out of the manufacturing area. These results are also reflected by the determination of airborne biological particulate (Figure 3, on the right).
The real-time feedback provided by the BFPC is a powerful diagnostic tool for evaluating environmental conditions. Due to this real-time feedback, utilizing an air based BFPC in this application eliminated at least a week of biological particulate analysis time that would have been required with the use of traditional environmental monitoring methods.
Troubleshooting a Contaminated WFI Water System: Case Study 3
This case study shows the use of a BFPC for water as an investigative tool to determine the root cause of recurring contamination events in a pharmaceutical Ambient Water for Injection (AWFI) system. Numerous investigations using the traditional method were performed, prior to employing the BFPC, in an attempt to determine the root cause. This included increasing sanitization frequency to one hour every day, which did not resolve the issue and intermittent contamination continued. The water system was passivated one month before the investigation using the BFPC began, and daily one-hour hot water sanitization continued throughout the study. Traditional plate count samples were collected daily at a sampling port after the BFPC system. After the two weeks, two observations were noted in the BFPC data:
- An average of ~130,000 AFU per 100ml were observed, and
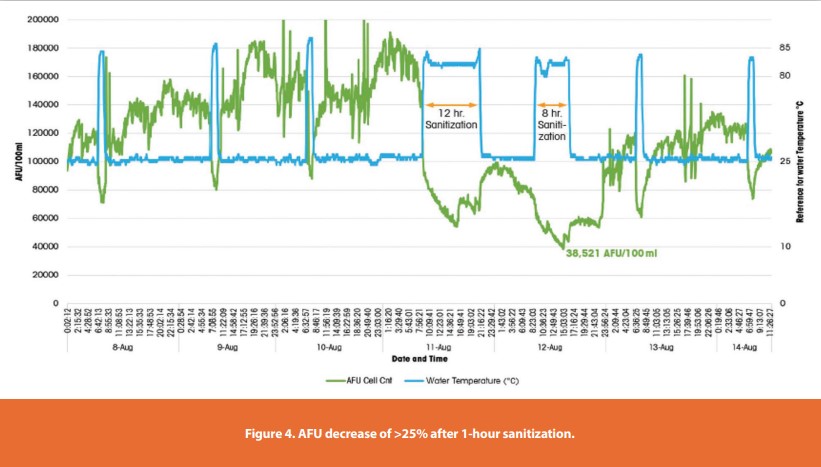
- A drop of >25% in AFUs occurred during the daily one-hour hot water sanitization (Figure 4).
Given the higher than expected AFU counts as compared to CFU results, the BFPC was confirmed to be working as designed after sampling with a second BFPC that provided comparable AFU results to the initial BFPC test.
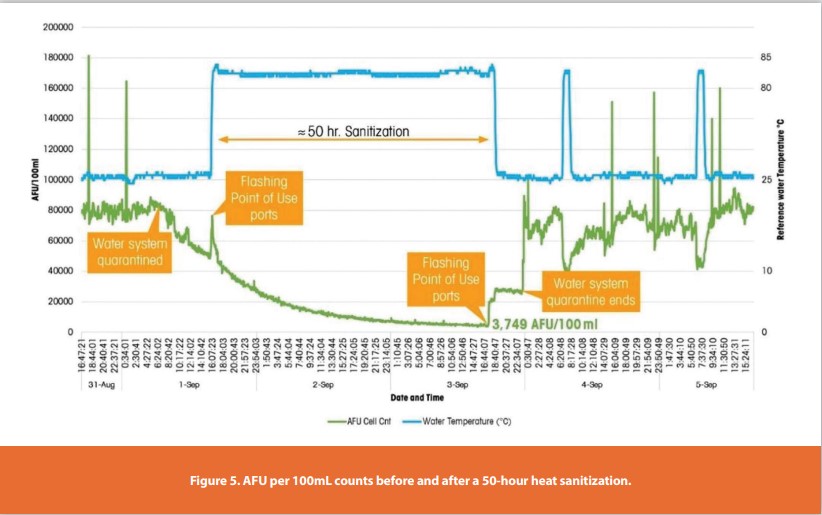
To understand the drop in AFU counts further, a decision was made to increase the sanitization time. Initially, an increase from one hour to 12-hours and 8-hours, on two consecutive days, was performed. While the two long sanitizations proved effective in reducing the AFU counts to less than 40,000 AFU per 100ml on the second day, the benefits were short-lived and the next day the water system reported results as high as 120,000 AFU per 100ml. Next, a longer two-day sanitization was performed, during which the water system was quarantined (Figure 5). By the end of the 50-hour sanitization, AFU counts dropped to less than 4,000 AFU per 100ml; however, after complete, the AFUs spiked to pre-sanitization levels.
Further investigation of the data showed that an increase in AFU counts correlated to loop feed water. Essentially, dirty water was being introduced into the AWFI system. CFU numbers were within recommended levels and significantly lower than detected AFU, potentially due to VBNC organisms and microorganisms damaged by the UV germicidal lamp. Through less than two months’ use of a BFPC system, this company was able to identify a definitive root cause, something they had not been able to do with plate enumeration for more than a year.
Diagnosis of Non-Biological Water Loop Particulates: Case Study 4
The following case study demonstrates how one company utilized a water-based BFPC to support an investigation into the source of high particulate counts on a newly commissioned Purified Water (PW) system. After BFPC installation on the return of the PW loop, baseline particle and AFU count data were obtained. Although AFU counts were low, particle counts greater than 30,000 particles per milliliter were detected. An investigation was undertaken to determine the root cause of these high particulate counts.
A 50-nanometer inline water filter was placed between the water loop and BFPC to confirm zero particle counts on the BFPC with highly filtered water and, primarily, to collect a particle sample for compositional analysis. Over the course of three days, the filter material changed from white to orange, indicating significant particle capture. A water sample, collected from a nearby port, and this filter were analyzed by Scanning Electron Microscopy (SEM) and for EDX elemental composition to gain information that might help identify the source of the high particulate counts. Ferrous particles were identified in both samples, indicating that rouge was a likely source of the higher than expected particle counts.
The BFPC was then placed on a cart and taken to different loop locations to investigate where high particulate counts were and were not present. The hot loop outlet, storage tank outlet and ambient loop return all showed more than 30,000 particle counts per milliliter. However, sampling performed at the RO and distillation system outlets showed less than 240 particles per milliliter and 600 particles per milliliter, respectively. These results indicated that the high particulate counts were originating from the combined hot loop and heated tank system. Further investigation resulted in a finding of insufficient passivation in the new loop. Through continuous detection of total particle counts, mobile sampling capabilities, and real-time reporting, BFPC systems can support investigations and faster root cause assessment.
Summary
The four case studies presented here provide a broad range of examples of the application of BFPC-based particle counters in both air and water-based systems. The studies demonstrate that these systems can provide answers at an essentially real-time rate and provide opportunities for novel approaches to problem solving that were not previously possible. Case Study 2, for instance, is an example of these instruments to monitor inert and biological particles in real-time over an extended duration and in a novel application. Case study 4 allowed a quick diagnosis of incomplete passivation resulting in particulate loads. Case Studies 1 and 3 are investigative approaches that are more conventional, and in each instance, they resulted in a significantly more rapid resolution of the problems than had traditional methods been used. In fact, Case Study 3 unsuccessfully employed traditional culture-based methods for a year prior to using the BFPC monitor.
These studies, and the referenced studies that preceded them, clearly demonstrate that BFPC-based air and water systems can provide real-time monitoring and possibilities for issue resolution that are not available using traditional methods. Agencies across the globe have recognized the potential for such technologies to provide improvements in monitoring and quality and have implemented frameworks for the adoption of novel methods into pharmaceutical processing facilities. BFPC-based monitors are clearly superior to traditional methods but are not directly substitutable in regulated processes without appropriate validation (see for instance Hjorth et. al. for a discussion of validation considerations).7
Conclusions
The case studies given in this paper and the other cited studies give clear evidence that bio-fluorescent particle counters (BFPCs) have major advantages over conventional methods in providing results in real-time and instantaneous discrimination of inert versus biological particles. These advantages provide the promise of improving or replacing slow and inefficient methods of manufacturing monitoring and environmental control.
References
- Bolotin C, Varnau B, Nelson JR, Bhupathiraju VK, Jiang JP. Evaluation of an instantaneous microbial detection system in controlled and cleanroom environments. BioPharm International. 2007;20.
- Sandle T, Leavy C, Jindahl H, Rhodes R. Application of rapid microbiological methods for the risk assessment of controlled biopharmaceutical environments. Journal of Applied Microbiology. 2014;116(6):1495-1505.
- Anders HJ, Ayres FB, Bolden J, et al. Online Water Bioburden Analyzers: A Case Study for the Extension of Purified Water Hold Times. Pharmaceutical Engineering. 2015;35:119-124. 4. Lipko B, Termine B, Walter S. Case Study: Retrofitting Two New High-Purity Water Systems. Pharmaceutical Technology Biologics and Sterile Drug Manufacturing. 2017;18–26. Available at: http://files.pharmtech.com/alfresco_images/pharma/2019/04/24/ afdeeb30-52a1-4b1e-b5a0-bd32528a2648/PT_Biologics-and-Sterile-Drug-Manufacturing_5-1-2017.pdf
- Montenegro-Alvarado JM. Leveraging rapid microbiological methodology in forensic evaluation to identify elusive root cause. American Pharmaceutical Review. 2018. Available at: https://www.americanpharmaceuticalreview.com/Featured-Articles/353500- Leveraging-Rapid-Microbiological-Methodology-in-Forensic-Evaluation-to-Identify[1]Elusive-Root-Cause/
- Montenegro-Alvarado JM, Salvas J, Weber J, Mejías S, Arroyo R. Pfizer Case Study: Rapid Microbial Methods For Manufacturing Recovery After Hurricane María. Pharmaceutical Online. 2018. Available at: https://www.pharmaceuticalonline.com/doc/pfizer[1]case-study-rapid-microbial-methods-for-manufacturing-recovery-after-hurricane[1]mar-a-0001
- Hjorth J, Annel P, Noverini P, Hooper S. GMP Implementation of On-Line Water Bioburden Analyzers. Pharmaceutical Engineering. 2021. Available at: https://ispe.org/ pharmaceutical-engineering/january-february-2021/gmp-implementation-online[1]water-bioburden#
Author Biographies
The Process and Environmental Monitoring Methods (PEMM) working group is composed of members from the pharmaceutical and personal care industries, BFPC instrument manufacturers, and industry consultants whose aim is to support the adoption of and education on real-time BFPC methods for air and water applications.
Scott Hooper holds a PhD in Microbiology and has over thirty-five years’ experience in industry and academe, having held positions in both the USA and in Europe. His most recent assignment was as Head of Microbiology at MSD’s Werthenstein BioPharma facility in Switzerland.
James Francis is a member of the PEMM working group, and Technical Director at Micron View LLC. He focuses on the development and evaluation of environmental monitoring instrumentation, and specializes in real time microbial monitoring applications for both air and water.
Feng Jin Liew is a Technology and Application Consultant at Mettler-Toledo Thornton. He specializes in microbial detection and monitoring of Pure Water and Water for Injection. He has been involved in rapid microbiological methods, mycology, fermentation, and bioprocessing. He holds a master’s degree in bioproducts and biosystems engineering and a bachelor’s degree in environmental sciences from the University of Minnesota – Twin Cities.
Mike Russ currently works at Genentech as the Head of the QCLS/ Analytical Science and Technology group located in Oceanside CA. In this role, he is responsible for overseeing method transfers and validations, new technology evaluations and implementation as well as technical support for the Microbiology, Adventitious Agent and Biochemistry testing labs.
Allison Scott facilitates the PEMM working group and is a senior principal scientist at Azbil North America Research and Development, BioVigilant. She has been a member of the Azbil BioVigilant team since 2010, where a majority of her work has focused on the evaluation of the company’s BFPC system, its diverse applications in air and water monitoring, and in supporting end users in its implementation.
Philip Villari has worked for Merck & Co., Inc. for over twenty-five years. Since 2000 he has worked in the Merck Research Laboratory Division performing microbiological testing for pharmaceutical, biological, and vaccine development products. Philip also collaborates cross-functionally with internal and external industry colleagues to bring Rapid Microbial Methods to the forefront of pharmaceutical microbial quality testing.
Stefan Weber holds a PhD in microbiology from the Swiss Federal Institute of Technology. He has over 15 years of microbiology experience in academic research and pharmaceutical industry. Since 2016 he is working in the QC department of MSD’s parenteral drug production facility at Werthenstein BioPharma in Switzerland
Subscribe to our e-Newsletters
Stay up to date with the latest news, articles, and events. Plus, get special
offers from American Pharmaceutical Review delivered to your inbox!
Sign up now!