Jennifer Probst-Intern; Kevin Ly- Intern; Valentin Legras- Intern; Avinash Murthy- Senior Scientist; Ana Filipa Borges- Senior Scientist; Patrick M. Piccione- Senior Principal Scientist, F. Hoffmann – La Roche AG, Basel, Switzerland.
Abstract
While data science is attracting significant industry interest, actual delivery does not always live up to its promises. A successful digital transformation strategy relies on changing attitudes and mindsets as one of its key aspects. This article shows how to accelerate cultural change towards data science-driven thinking in pharmaceutical companies. Literature best practice is followed by the personal experience of the authors. Specifically, we describe our “Swarm” philosophy to deliver many small, quick projects in a bottom-up fashion. This principle supports managed culture change starting at the shop floor, and relies on communication, collaboration and a focus on concrete value. Several supporting frameworks and tools are outlined. Further, we give an overview of our portfolio of projects, illustrated with two hands-on detailed examples. Our key learnings are articulated along the following three dimensions: strategy; people; and projects. This article illustrates the importance of combining agility with rigor, as well as that of a locally embedded resource to demonstrate value quickly.
Introduction
Nowadays, the digital transformation (DT), including data science, is an omnipresent topic with high business expectations.1,2 At the World Economic Forum 2016, the value of digital transformation over the next 10 years was estimated to exceed the striking amount of $100T.1 The success of DT has been demonstrated by the notable rise of today’s giant digital corporations, albeit accompanied by concerns regarding power, privacy and taxation.3 Industry shows strong interest in the extension of the digital transformation to completely new product and business models, leading to a fourth industrial revolution: Industry 4.0.4 While many pharmaceutical companies strive for competitiveness by adopting Industry 4.0 concepts in decision automation,4,5 many other such companies struggle to implement its precursor, the digital transformation for automation and the digitization of processes.4,5 Furthermore, actual results from digital transformation efforts often fail to live up to their promises.6,7,8
Digitalization is a multi-faceted and diffuse topic.6 Business strategies must therefore include many dimensions3 to ensure successful incorporation and internalization of Industry 4.0 concepts9 whilst establishing digital cultures and new capabilities.2,10 Instead of merely solving unconnected business problems with customized technical and organizational solutions,12 digitally maturing companies should focus on strategy development, mobilization for engagement, and project delivery.3,11 A deep topic understanding is essential to set up an empowered and skilled team in order to build a strategy that focuses on actual, value-creating needs. The organization is mobilized by consistently investing in employee capabilities and by a managed cultural change towards cross-functional collaborations. Successful project delivery can be facilitated by a diversified portfolio and conscious decision-making.3
It is well recognized that a successful DT strategy stands and falls with changing the attitudes and mindsets of employees.2,7,9,12 Especially in conservative companies, the full impact potential of advanced digitalization is often not recognized,13 resulting in resistance to IT change, and decision-making based on wrongly perceived risks.10 To speed up innovation,10 digitally successful companies have accepted higher risks.11 Furthermore, in companies embracing DT, a collaborative culture forms including natural- and data-scientists.3 The mutual understanding between people of different backgrounds facilitates creativity and innovation.11 To achieve the aims above, companies must invest into business structures and processes that accelerate cultural change towards data science driven thinking.
Here, we share the experience and insights gained during the past three years setting up our “Swarm” approach to demonstrate the value and applicability of DT to a community through many small, quick projects.
Gathering Support
Literature best practice
The adoption of “digital” constitutes a major shift from long-standing norms, thus challenging traditional hierarchies, decision-making authority, and workplace social interactions.14 Such a cultural change requires getting people on board, as this change itself is driven by their ideas and engagement. The most critical component is joint project work between digital experts and members of the general community to raise mutual understanding and appreciation of each community’s strengths, weaknesses, needs, and applicability.2,10,15 The resulting exchange builds both a common language and knowledge base in data science, as well as a business and engineering context. Such activities are easier when the experts are embedded in the operational functions.
Additional training programs and educational resources can enhance the offering.15 Additionally, regular digital summits help everyone feel involved and updated, while collaboration awards encourage participation,14 and job rotation programs enable new perspectives.14 Work environments can be set up in a way to foster engagement11 and stimulate innovation through an inspiring and futuristic ambiance.14
Other game-changers in culture transformation include promoting new ways of working, such as autonomous judgment calls, and on-the-spot decisions,14 for instance by setting incentives for their exploration.10 To make risk-taking a cultural norm, business leaders have to embrace failure11 and support employees in developing the necessary self-esteem and judgment skills. Leaders must serve as DT role models and consistently exemplify the novel behaviors so that motivated people follow their lead.14 Throughout the transformation, people’s drivers and resistances must be understood.
Implementation in our department
In the past experience of one author (P.M.P.), one cause for slow acceptance of DT was excessive focus on top-down corporate strategies. At the shop floor, these were perceived as too remote from daily concerns, both in content and accessibility. To increase interest and acceptance of DT in our own department, an intern position was therefore funded in 2020. It was framed as a scientific hypothesis: a test of the value of embedding a data science/IT worker in a physical science environment to implement a variety of digital solutions. The approach was successful and the internships have continued every year since 2020.
The “Swarm” Principle
Organizational context
The Pharmaceutical R&D (PTDC-F) department is part of the small molecules CMC (Chemistry, Manufacturing, Controls) division at F. Hoff mann-La Roche. Specifically, the department is responsible for formulation and process development of solid dosage forms, clinical trial materials manufacture, and internal/external technical transfer to commercial production. The division launched a formal DT initiative in 2019. It includes formally resourced division-scale activities for infrastructure development (such as the setup of a central data lake or data harmonization and integration), as well as various activity streams targeting data use.

For a successful culture change, however, this necessary top-down eff ort must be complemented by quickly helping many people with small requests. Our “Swarm” principle (Figure 1) is a bottom-up approach, where projects are led by internally embedded data scientists. These iteratively develop prototypes through continuous partner engagement with science or business subject matter experts from the department. This principle enables data scientists to deliver a large number, a “swarm,” of small- to medium-scale collaborative projects, with fast response times due to low overhead. As applications mature and grow in complexity, a progressive handover process to permanent staff ensures long-term maintenance. The “Swarm” principle accelerates culture change by demonstrating early yet tangible value delivery to a number of department members, thus raising general awareness and interest.
Historical perspective and strategy development
The first internship focused on the assembly of a portfolio of potential projects, together with its associated project management machinery. It identified sufficient numbers of valuable opportunities even just in our Sciences section. The delivery grew further the following year, raising connections and interest across the department, and producing quite a few useful tools. With the increase of the department maturity, more usage cases and project ideas from other sections appeared. By the third year, these successes had generated a very diverse set of projects in terms of subjects, partners and impact areas. More formal consideration became necessary regarding tool embedding into the data flow, their maintenance, and handover, leading to stronger collaborations with the division’s growing community of data scientists. Further connection of top-down and bottom-up approaches will be crucial in the future to integrate small-scale projects in larger DT visions, and to better tailor division-wide solutions to end-users.
Supporting frameworks
We have developed many useful supporting frameworks to apply our “Swarm” principle effectively (Table 1).
- A simple, 1-slide, project charter16,17 (Figure 2) to set common expectations and defi ne intended outcomes. This is written in collaboration with all project partners after the first few meetings. Dividing projects into work packages simplifi es project scoping and timeline setting. The charters are refined during the project execution.
- A project portfolio table18 to manage each internship. These simple Google Sheets™ or Excel™ lists contain project essential information to track progress, allocate resources, and summarize descriptive project charter information. They facilitate portfolio analyses (see Table 1), including changes over the years, and value demonstration to the department.
- Software solutions which enable real-time visual development during prototyping (e.g. Google Data Studio™). These enable a critical capability: quick, functional, mock-up generation and concept testing, regardless of the final deployment platform.
- Comprehensive project documentation including developer records, handover documents, best practice documents, and user manuals. To facilitate project handover and troubleshooting, these must be started parallel to development and regularly revised.
Project Insights and Examples
This section starts by illustrating our approach with two hands-on detailed examples, one scientific and one business problem. This is followed by the insights from the analysis of the entire portfolio over the past three years.
Scientific example: Punch sticking
Punch sticking is a phenomenon that can pose severe problems in tablet manufacturing. It refers to strong adherence of powder onto the tablet tooling, which can lead to significant tablet surface defects and productivity losses.19,20 This problem is often only identified late in development, when formulation changes carry severe time and money penalties.20 As an early test, Roche utilizes a small-scale removable punch sticking assay to quantify the amount of material adhered to the tablet tooling after a small number of compactions. Prior to our work, the data was collected in various Excel™ sheets on different file-sharing platforms. Risk classifi cations were made based only on the measurement at the highest number of compactions.
Together with our formulators, we developed an R Shiny™ application to enable access to the consolidated data from one communal place, and to classify formulations more robustly in terms of their sticking risk at manufacturing scale. The Shiny application consists of one main sidebar tab for each of these use cases. The Data Viewer tab (Figure 3A) lets the user access the previous data from one data-combining Google Sheet™ via a Google service account and explore various plots quantifying the sticking propensity of selected formulations. In the Data Prediction tab, the user can enter new measurements, and add them to the database. Furthermore, the sticking behavior of the corresponding formulation can be predicted through data fitting to a slightly adapted version of the function by (Paul et al, 2016).21 The mass sticking after a customizable number of compressions is calculated together with bootstrap confidence intervals and a risk classifi cation (Figure 3B). Explanatory text helps the user interpret the prediction outputs, including summary statistics on model fit. This text warns in case of high sticking risk, or insuffi cient model fit, e.g., due to large experimental noise. Finally, to facilitate reporting, a PDF report containing all plots and summary statistics shown in the app can be automatically generated.

Currently, the application is utilized to provide guidance in early development. The prediction and risk classification will be continuously optimized with future validation data as part of the model life-cycle management.
Business example: DT Dashboard
During the past years, increased transparency on several department activities has been requested, so we have worked on various dashboards. In particular, the workstreams, efforts and achievements of the department’s DT initiative itself needed better dissemination to enhance team collaboration. We thus developed a DT dashboard in Google Data Studio™ to make all the information accessible and traceable in an easy and quick way. It automatically synchronizes detailed project information recorded in a Smartsheet™ with the dashboard embedded in the department Google Site™.

The DT dashboard is composed of five main pages that provide an overview of ongoing and planned DT projects within PTDC-F (Figure 4). The pages, easily accessible through the department intranet homepage (Figure 4A), show full-time equivalent (FTE) spending per project, as well as detailed timelines of bigger projects and initiatives like our equipment integration (not shown). The dashboard contains interactive graphs like the percentage of different features (tasks) in individual epics (projects), which in Figure 5B shows us the projects in the initiative data consumption and how big (in terms of tasks) each project is. Furthermore, the graphics are fully interactive, e.g., by clicking on the pie chart slices, links for the relevant DT solutions are displayed in the table below the chart (Figure 4B). One can also examine the status of each task, here equipment connection to the server per piece of equipment (Figure 4C). Similar to Figure 4B, the table in Figure 4C interactively displays timelines for the equipment selected via mouse-clicking on the plot. This dashboard was presented in a departmental meeting to make DT progress accessible to all PTDC-F employees.
Portfolio analysis
Over three years, 40 projects were completed with 20 main project partners. The project content was highly diverse, ranging from website and model development to database management. Two constant needs were process automation (8-44% of projects per year) and data communication through visualizations or spreadsheets (25-37% and 11-33% respectively). Due to this diversity, various software had to be utilized (Figure 5A). We concluded that generalists with strong knowledge in R™ and Python™ programming, but also visualization, data handling and problem-solving skills suited our embedded positions best. In terms of their philosophy,15 the tools developed were mostly used for descriptive analysis (42-67% of projects per year), but query and predictive analysis also constituted many projects every year (17-26% and 11-21%). The focus on intermediate complexity of interpretation reflects that DT is neither at its start nor completely mature in our department. The projects added value in many different ways (Figure 5B). The main benefits21 are productivity, team collaboration and traceability, which together make up 50-67% of the total project efforts each year.
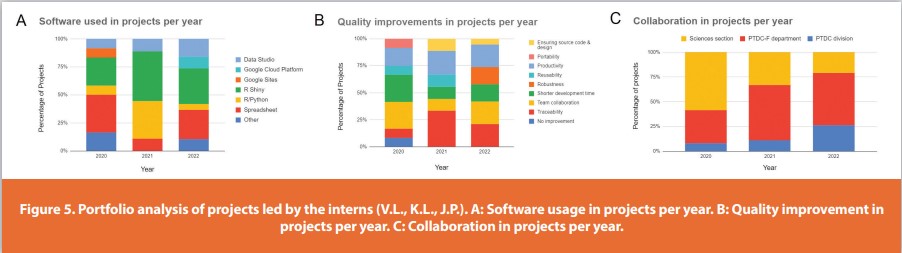
Over the years, the percentage of projects realized specifically for the Sciences section housing the interns strongly decreased (Figure 5C). Correspondingly, there was a continuous increase in the percentage of projects on department (PTDC-F) or division-wide scale (PTDC), showing the success of the activity. Since the tools were developed for a broader community, there were higher user numbers per project in the last year. Where in the first two years all projects were designed for <50 people, in the following year 32% of the tools were intended for 50-99 users and even 15% for >100 people. The time savings per user were quite low for the first year’s projects, since it included much valuable prototyping. These savings increased in the following years since tools for more concrete use cases were developed.
Altogether, the three generations of interns successfully delivered a manifold of value to a broad spectrum of people. The results demonstrate the diversity of opportunities available for DT tools in our Pharmaceutical R&D environment, and the increasing department interest in data science activities.
Learnings
In the following few paragraphs, our key learnings are articulated along the following three dimensions:3 strategy; people; and projects, including their delivery.
Strategy
To explore new areas, calculated risks must be taken: in our case, the funding of the first embedded data science internship. In its context, the creation of a starting portfolio was very important. This assembly showed the needs of the department, as well as the skill sets required; in addition, it secured buy-in from a variety of colleagues. We then patiently focused on collaboratively fulfilling real needs together with the beneficiaries. As the first projects were successfully delivered, the whole approach acquired legitimacy. The expansion to a larger, diversified portfolio with many different project partners must be progressive to avoid spreading the effort and focus too thin. This strategy showed success over time across the whole department.
People
A major focus area was the tight integration of the data scientist in the department to improve bilateral understanding and identification of business needs, as well as to facilitate communication in ongoing projects. Finding a common language between project partners and abstracting the discussions to the level of detail needed was crucial. We managed culture change by designing a variety of communication channels over the last three years. The data science activities thus became well recognized in the department, and interest in the initiation of new projects, as well as tool maintenance, increased a lot. We learned that it is crucial to strengthen also the informal interaction between data and natural scientists, as a key success factor to a successful “Swarm” approach is the presence of open mindsets inside the department that bring in ideas and contribute to the change of the entire organization.
Project/delivery
Agreeing on a clear project scope is a critical step for a successful project delivery. We ensured clarity through project charters and up-front definition of work packages. To provide efficiency, but also robustness, it is important to work in ways consistent with the organization. Input gathering from other data scientists before starting with the exact implementation gives options to adapt or integrate into previously developed solutions, and ensures consistent data formatting. We found scheduling regular check-ins with project partners useful to involve them in the iterative development process and ensured that expectations were met. Furthermore, user-friendly, highly visual tools with pre-interpreted results and interactive features are most easily accepted. In summary, the overall key to success is sufficient planning effort, followed by fast prototyping and iterative, co-creative development with parallel testing.
Conclusion
A successful digital transformation strategy comprises both bigger top-down activities and emerging bottom-up projects. Our experience shows that the latter are essential drivers to culture change. We introduced the “Swarm” principle as a bottom-up approach designed to maximize buy-in, by demonstrating early yet tangible value throughout an organization in an agile manner.
The “Swarm” principle relies on local data scientists embedded in operational functions to increase the bilateral understanding of business needs and thus deliver many small collaborative projects. Project management success factors are simplicity and efficiency, facilitated by 1-slide project charters, good breakdown into work packages, and living project documentation. The assembly and analysis of a varied project portfolio ensured a strategic outlook.
As summarized in the previous section, our experiences have taught us many lessons that will apply to other organizations in their own DT journeys. Culture change requires patience and persistence, as well as the commitment to continually deliver value to numerous partners. Together with a collaborative approach and a focus on user-friendly, interpretable tools, we are confident these elements will be helpful to any DT champions.
The increase in the number of people engaging with the DT over the years in our department demonstrates the high efficacy of the “Swarm” approach in culture change. Our principle has also led to individual personal development for us, thanks to different directions we have sought to foster DT in. It can do so for the readers of this article as well. As they search to identify the best opportunities to harness the power of machines to human and societal questions, the words of Cordwainer Smith still hold true: “There is no all-purpose computer built that weighs as little as a hundred and fifty pounds. You do.”22
References
- Oliver Cann. $100 Trillion by 2025: the Digital Dividend for Society and Business. World Economic Forum. Available at: https://www.weforum.org/press/2016/01/100-trillion-by[1]2025-the-digital-dividend-for-society-and-business/. Accessed October 4, 2022.
- Wee D, Kelly R, Cattel J, Breunig M. Industry 4.0-how to navigate digitization of the manufacturing sector. Available at: https://www.mckinsey.com/capabilities/ operations/our-insights/industry-four-point-o-how-to-navigae-the-digitization-of-the[1]manufacturing-sector. Accessed October 4, 2022.
- Piccione PM. Realistic interplays between data science and chemical engineering in the first quarter of the 21st century, part 2: Dos and don’ts. Chemical Engineering Research and Design. 2021; 169:308-318.
- Steinwandter V, Borchert D, Herwig C. Data science tools and applications on the way to Pharma 4.0. Drug Discovery Today. 2019;24(9):1795-1805.
- Ntamo D, Lopez-Montero E, Mack J, et al. Industry 4.0 in Action: Digitalisation of a Continuous Process Manufacturing for Formulated Products. Digital Chemical Engineering. 2022; 3:100025.
- Davenport T, Westerman G. Why so Many High- Profile Digital Transformations Fail. Harward Business Review. Available at: https://hbr.org/2018/03/why-so-many-high[1]profile-digital-transformations-fail. Accessed Oct 4, 2022.
- ZoBell S. Why Digital Transformations Fail: Closing The $900 Billion Hole in Enterprise Strategy. Forbes. Available at: https://www.forbes.com/sites/ forbestechcouncil/2018/03/13/why-digital-transformations-fail-closing-the-900-billion[1]hole-in-enterprise-strategy/?sh=5e86d8887b8b. Accessed October 4, 2022.
- Libert B, Beck M, Wind YJ. 7 Questions to Ask Before Your Next Digital Transformation. Harward Business Review. Available at: https://hbr.org/2016/07/7-questions-to-ask[1]before-your-next-digital-transformation. Accessed October 5, 2022.
- Agca O, Gibson J, Godsell J, Ignatius J, Davies CW, Xu O. An Industry 4 readiness assessment tool. WMG - The University of Warwick. Available at: https://warwick.ac.uk/fac/sci/wmg/ research/scip/reports/final_version_of_i4_report_for_use_on_websites.pdf. Accessed October 5, 2022. 10.
- Champagne D, Hung A, Leclerc O. How Pharma Can Win in a Digital World. Available at: https://www.mckinsey.com/industries/life-sciences/our-insights/how-pharma-can-win[1]in-a-digital-world. Accessed October 4, 2022.
- Kane G, Palmer D, Phillips A, Kiron D, Buckley N. Strategy, Not Technology, Drives Digital Transformation. MITS Logan Management Review. Available at: https://sloanreview.mit. edu/projects/strategy-drives-digital-transformation/. Accessed October 4, 2022.
- Reche A. Digital transformation: expectations and results. Retain Technologies. Available at: https://retaintechnologies.com/en/digital-transformation-expectations-and-results. Accessed October 4, 2022.
- Vey K, Fandel-Meyer T, Zipp JS, Schneider C. Learning & Development in Times of Digital Transformation: Facilitating a Culture of Change and Innovation. International Journal of Advanced Corporate Learning (iJAC). 2017;10(1):22.
- Hemerling J, Kilmann J, Danoesastro M, Stutts L, Ahern C. IT’S NOT a DIGITAL TRANSFORMATION without a DIGITAL CULTURE. BCG. Available at: https://www.bcg.com/ publications/2018/not-digital-transformation-without-digital-culture. Accessed October 5, 2022.
- Piccione PM. Realistic interplays between data science and chemical engineering in the first quarter of the 21st century: Facts and a vision. Chemical Engineering Research and Design. 2019;147:668-675.
- ExcelSHE. 40+ FREE Project Charter Templates [Doc]. ExcelSHE. Available at: https:// excelshe.com/project-plan-templates/project-charter/. Accessed October 20, 2022.
- Minnesota State. Project Charter. Project Charter Template. Available at: https://www. minnstate.edu/system/hr/training_and_development/documents/Project_Charter_ Template_2.pdf. Accessed October 20, 2022.
- Eby K. Free Project Portfolio Management Templates. Smartsheet. Available at: https:/ www.smartsheet.com/content/project-portfolio-management-templates. Accessed October 24, 2022.
- Simmons DM, Gierer DS. A material sparing test to predict punch sticking during formulation development. Drug Development and Industrial Pharmacy. 2011;38(9):1054-1060.
- Paul S, Taylor LJ, Murphy B, et al. Mechanism and Kinetics of Punch Sticking of Pharmaceuticals. Journal of Pharmaceutical Sciences. 2017;106(1):151-158.
- Akdur D, Garousi V, Demirörs O. A survey on modeling and model-driven engineering practices in the embedded software industry. Journal of Systems Architecture. 2018;91:62-82.
- Smith C. The Lady Who Sailed The Soul. In: Mann JA, ed. The Rediscovery of Man. New England Science Fiction Association Press, 1993:97-117
Author Biographies
Jennifer Probst is a Masters student in Computational Biology and Bioinformatics at ETH Zurich, Switzerland. Alongside her studies, she has contributed as data scientist to several global research projects; including LAMAVE, Archipelagos Institute of Marine Conservation, the University of Zurich and Hawk Mountain Sanctuary Association. The past nine months she has been working as data science intern in the Formulation & Process Sciences section at Roche in support of the Digital Transformation initiative.
Kevin Ly is a bioinformatics Ph.D. student at the Wellcome Sanger Institute affiliated to the University of Cambridge. During two years at Roche, he contributed to the Digital Transformation in the Pharma Technical Development; first as a data science intern in the Formulation & Process Sciences section and subsequently as a data science engineer in the Real-Time Monitoring team. In his roles, he automated manual analytical processes by streamlining data pipelines and incorporating data science tools.
Valentin Legras is a clinical pharmacology data scientist at Roche in Basel, Switzerland. After spending some years with Sanofi and Novartis, he joined Roche in 2020 as the first data science intern in the pharma technical development department. In support of the digital transformation, he mainly worked on databases, data reporting, automation and digitalization of the tools. Currently, he focuses on pharmacokinetic and pharmacodynamics clinical data, data reporting and data preparation.
Avinash Murthy is a senior scientist at Roche in Basel. He joined Roche in 2014 after obtaining a Ph.D. in Chemical Engineering from the University of Texas at Austin. During his almost nine years at Roche, he has worked on various drug development programs in drug product formulation and process development, with a particular focus on late[1]stage development. Recently he has become the process development squad lead within the department.
Ana Filipa Borges is a senior scientist at Roche in Basel. Her background is in Pharmaceutical Sciences but she specialized in Pharmaceutical Technology during her Ph.D. She spent five years at Bluepharma Group’s innovation unit developing new dosage form platforms for oral delivery, followed by two years in PCI Pharma and two years in Novartis as Product Formulation Lead. After 2.5 years as Senior Scientist in Roche, she has had the opportunity to follow product development from the scratch to the market, and become the Digital Transformation lead within the department.
Dr. Patrick M. Piccione is a senior principal scientist at Roche in Basel. He spent seven years in materials development at Arkema, followed by nine years at Syngenta. There he led process engineering science, as well as a “maths & data science” initiative. Over the last 3.5 years, he has acted as the Pharmaceutical R&D department’s sponsor for the Digital Transformation. As such, he oversaw the creation of a variety of IT & data science tools through the internship program described here. He is now setting up a modeling and simulation squad across the entire CMC division.
Subscribe to our e-Newsletters
Stay up to date with the latest news, articles, and events. Plus, get special
offers from American Pharmaceutical Review delivered to your inbox!
Sign up now!