Authors: Michael J. Miller, PhD, Marine Pottier, PhD, Arthur Vivé, Ali Keshavarzi, PhD, Valentina Di Proietto, PhD, Ludovic Boilevin Kayl, PhD, Emilia Humeau, Alexandre Banon, Olivia Traoré, Maiwenn Lefebvre, Maxime Mistretta, PhD. Spore.Bio team, Paris, France.
Advancing Rapid Microbiology to the Next Level
Within the pharmaceutical industry, alternative and rapid microbiological methods (AMM/RMMs) have been implemented for a wide range of applications including sterile and nonsterile finished product testing, in-process and raw material bioburden analyses, environmental monitoring, pharmaceutical grade water testing, endotoxin assays, microbial identification and the detection of Mycoplasma.
Current technologies can detect the presence of diverse types of microorganisms or a specific microbial species (e.g., qualitative or presence/absence methods, such as a sterility test), enumerate the number of microorganisms present in a test sample (e.g., quantitative methods), and/or can identify microbial cultures to the genus, species and sub-species levels (e.g., identification methods). The manner in which microorganisms are detected, quantified or identified will be dependent on the scientific principle(s), workflow, specific technology and instrumentation employed.
Obviously, if an alternative or rapid method can combine multiple benefits into a single platform, the modern microbiology laboratory can realize additional efficiencies, instead of relying on multiple systems to arrive at a GMP decision on microbial quality control.
For example, many modern technologies can provide a microbial count or a presence/absence result, but not necessarily a microbial identification at the same time. In this case, the laboratory is likely to perform follow-up studies, using additional technology platforms, which is time consuming and, in some cases, cost prohibitive. To illustrate this concept, some rapid methods can provide a quantitative result in real-time, such as biofluorescent particle counters for active air and water analyses. Others can report a microbial count within hours or on the same day, such as what may be the case for flow or solid phase cytometry. And growth-based methods or those that require a pre-enrichment or incubation phase, such as ATP bioluminescence and digital imaging and auto-fluorescence of microcolonies, would be expected to provide a count within days. However, to our knowledge, each of these scientific principles would require some type of follow up analysis to identify the recovered microorganisms, but only if they can retain the detected cells for further analysis (e.g., as colony forming units, or CFUs, from growth-based methods). However, many non-growth-based technologies are unable to retain detected cells for this purpose, in which case the end-user would have to rely on alternative strategies to obtain cells from the sample for microbial identification studies.
For these reasons, it would benefit the industry if an alternative microbiological method could concurrently detect, enumerate and identify microorganisms, within minutes, and without requiring a pre-enrichment, viability staining or additional workflow steps.
This paper describes the development of a novel alternative microbiological method based on biophotonics, in which proprietary hardware collects viable microorganism signals in the visible, UV, and near-infrared wavelengths. These signals are gathered as unique spectral fingerprints of the microorganisms at the single-cell level, which are fed into an artificial intelligence (AI)-based, deep machine learning model that was trained on thousands of real-world samples, collected across diverse industrial environments, sampling techniques, and contamination profiles, representing millions of images. The end result is the rapid and simultaneous detection, quantitation and identification of microorganisms.
An Overview of the Spore.Bio Louis Technology
The Spore.Bio Louis System employs a Transformer-based Multimodal Spectral Imaging (TMSI) approach, integrating biophotonic hardware with deep-learning models for microorganism detection. The technology operates without growth enrichment or labeling requirements, demonstrates compatibility across diverse sample matrices, and enables simultaneous detection, quantitation and species-level identification within a unified analytical platform. Figure 1 depicts an overview of the technology.
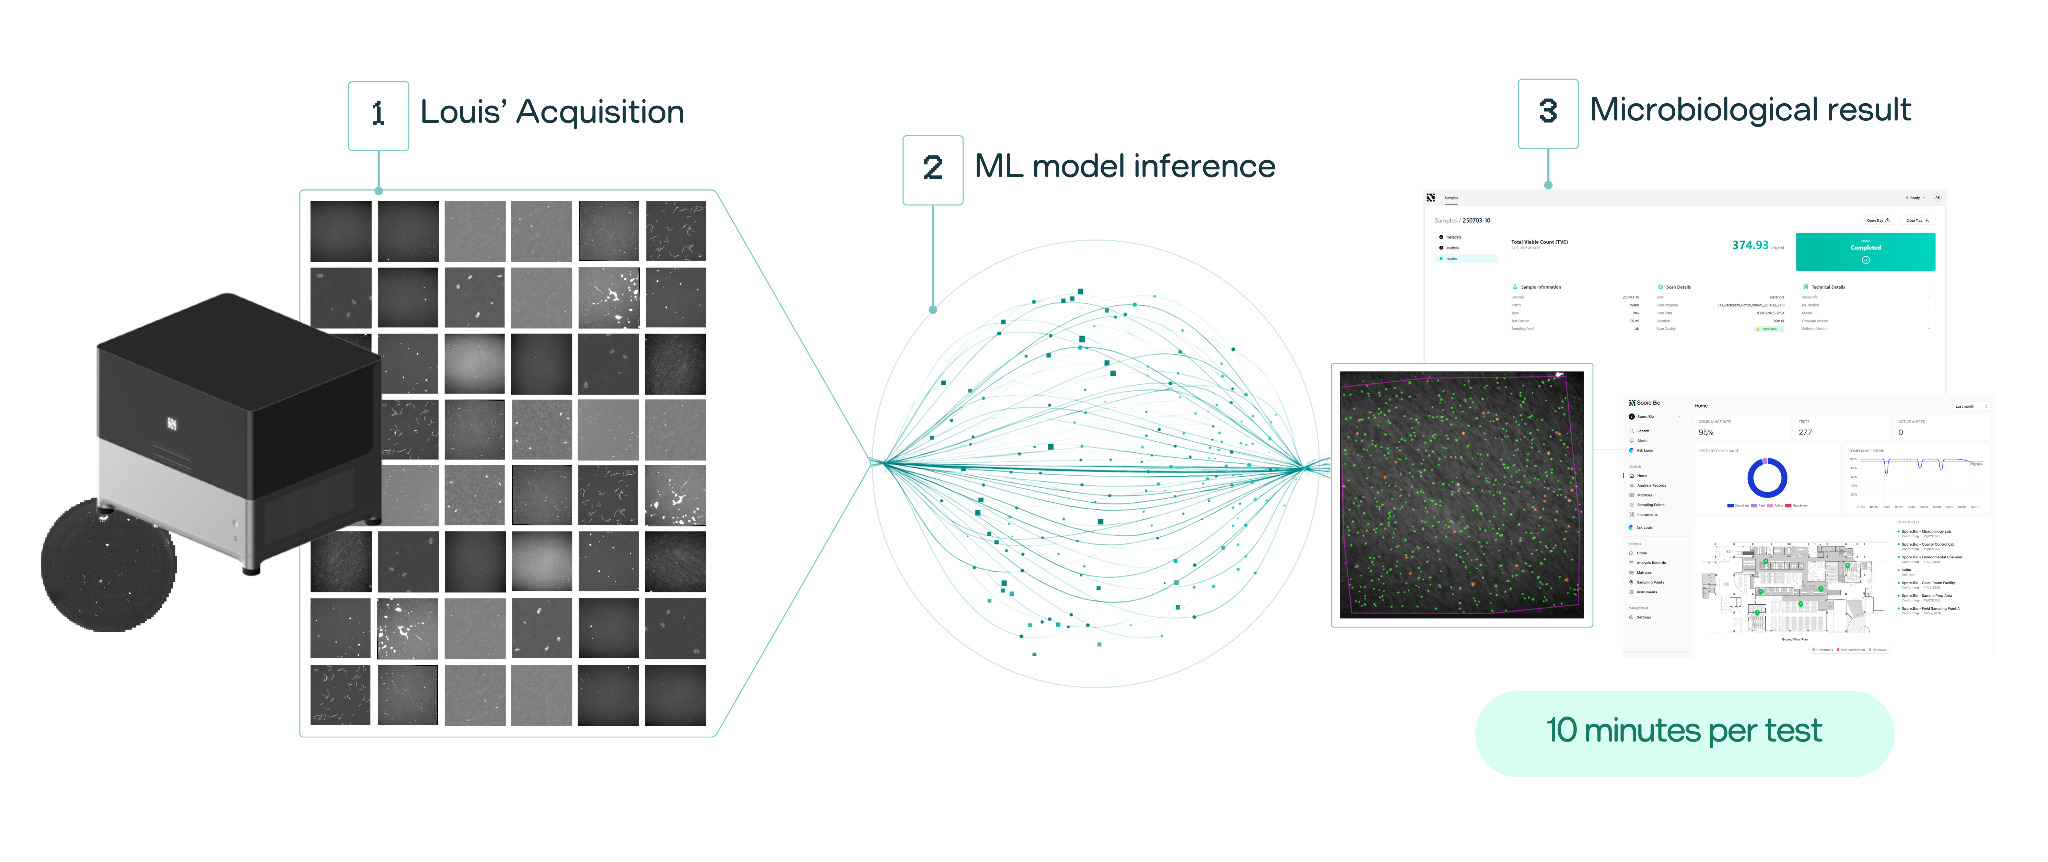 Figure 1. Overview of LOUIS System.
The TMSI technology combines spectroscopic and spatial information to achieve single-cell resolution (400 nm). The multispectral approach captures signals across six wavelengths under dual illumination at 405 nm and 365 nm, enabling the collection of both absorption data and intrinsic fluorescence from metabolic molecules such as NADH, flavins, and proporphyrin.
NADH exhibits fluorescence when excited in the ranges 320–380 nm (near-UV), emitting at 420–480 nm,1 whereas NAD+ shows negligible fluorescence.2 However, the TMSI technology extends beyond NADH detection alone. The system integrates signals from 412 nm to 800 nm across six spectral bands, incorporating fluorescence from flavins, primarily FAD (flavin adenine dinucleotide) and FMN (flavin mononucleotide), which are sensitive to excitation at 360–390 nm.3
The combination of these molecular signatures, coupled with their spatial localization within cells (e.g., a signal stronger at the center versus a diffuse signal within the cell), morphological aspect (e.g., thickness of the membrane and shape of the organism) and their cumulative and relative fluorescence excitation intensities, generates a unique spectral signature that enables differentiation of microorganisms from inert particles or sample matrix components, and, at the same time, microbial identification at the species level.
This spectral data is used to train a transformer-based deep learning model. Transformer-based deep learning models are a form of AI designed to analyze relationships in data by considering context (e.g., spectral signals from nearby pixels within a microorganism, signals from adjacent particles, background pixels, etc.). As such, these models can incorporate numerous variables to account for biological variability. In fact, the models were trained on millions of fields of view (FOV) across diverse matrices, stress conditions, and environmental factors, broadening the spectrum of observed signatures. Among the conditions included in the models, Spore.Bio tested microorganisms artificially inoculated into or onto a variety of matrices, including Tryptone salt diluent, various types of pharmaceutical process and food and beverage waters (e.g., mineral, purified, rinse water), alcoholic beverages, surfaces in which the microorganisms were subsequently collected on swabs, and under stressed conditions (e.g., after three days of inoculating microorganisms into mineral and purified waters). Additionally, the models accounted for dead cells as well as all non-viable particles and matrix components present in the test samples, including waters, beverages, environmental samples (particularly swab samples), and food dyes. The final result is reported as a CFU, as the model was trained to be comparable with the number of microorganisms recovered from the same inoculated samples using traditional methods. To our knowledge, this is the very first time a non-growth-based AMM/RMM has been trained to produce results as a CFU instead of a non-CFU signal. We further describe this strategy in a subsequent section of this whitepaper, supported by comparative microbiological data.
The general workflow begins with an initial filtration step of the test sample that captures all viable and non-viable particles larger than 0.4 μm onto a single-use consumable composed of a Polyethylene terephthalate (PET) membrane. An 8 mm diameter membrane is used for simple matrices, while a 20 mm diameter consumable is designed for more complex matrices, if needed (e.g., when the sample contains higher concentrations of particles, such as 1–2 million particles/sample), to minimize clogging of the membrane which could compromise the technology's ability to detect microorganisms.
Without the need for any growth enrichment or incubation step, the sample is immediately and directly scanned using the TMSI hardware, which acquires the spatial and spectral data that will be used to detect, enumerate and identify microorganisms present in the test sample. This data is processed on-site by a model embedded in the hardware, providing CFU results per sample with a time-to-result (TTR) of 7 minutes for the 8 mm membrane and 45 minutes for the 20 mm membrane.
To CFU, or Not to CFU. That is the Question
It is well understood that many non-growth-based alternative and rapid microbiological methods can report superior results when compared with conventional, growth-based methods. In this case, the number of cell counts or the number of detection events in the non-growth-based method may be greater than in the traditional assay. This phenomenon may be attributable to the detection of stressed, injured, dormant and/or viable but non-culturable (VBNC) cells that may not necessarily grow in or on conventional media. For this reason, a direct correlation between the CFU and a non-CFU numerical recoveries may not be possible.4–6
Furthermore, some non-CFU methods where microbial viability is measured not by growth but by the detection of other cellular viability targets, may have an increased propensity for reporting false positives, where non-viable particles, interfering materials and/or background noise are misidentified as viable cells. This may result in inappropriately concluding a non-contaminated test sample is contaminated, where acceptable batches of drug product could be rejected.
To overcome these challenges, the Louis System has learned to discriminate false positives from non-viable particles and only reports the presence of viable microorganisms, comparable to what would normally be detected and enumerated as a CFU. But because the technology was initially trained to be comparable to the CFU, the current design is optimized to exclude the detection of organisms that would not grow on an agar plate (e.g., VBNC). However, Spore.Bio is conducting extensive studies on VBNC, stressed and dormant microorganisms to determine the extent of VBNCs and if the existing model needs to be enhanced to detect these types of viable microorganisms.
A similar issue for some non-growth-based methods is the potential to identify dead cells as viable microorganisms. Spore.Bio has demonstrated that the signal from dead cells are not reported as false positives, even in the presence of viable microorganisms. The results of these studies are also presented in this white paper.
Introductory Validation Studies
Although three (3) rapid and alternative microbiological method validation guidance documents currently exist, USP chapter <1223>,7 Ph. Eur. chapter 5.1.68 and PDA Technical Report #33 (TR33),9 we understand a revision of TR33 is being finalized and that a summary of the new recommendations on the use of statistical analyses has been shared with the scientific community.10–12 Accordingly, some of these recommendations were employed when evaluating the data disclosed in this white paper. However, Spore.Bio did perform validation studies for its early adopters according to the existing PDA TR33, USP and Ph. Eur. guidance.
When reviewing the data in the subsequent sections, it should be noted that the studies present preliminary results from in-process design experiments using instrumentation and transformer-based deep learning models that continue to be optimized. As such, the data predict long-term system performance, although it is expected the additional optimization work will further enhance the system's capabilities.
Accuracy
Accuracy was initially evaluated using a pure culture of Bacillus subtilis ATCC 6633 suspended in sterile Tryptone Salt broth. The suspension was diluted to provide a predicted challenge inoculum between 5 and 300 CFU. Aliquots of the suspensions were challenged in the LOUIS System (using the filtration workflow described above) and on Tryptic Soy Agar (TSA), the latter incubated for two (2) days at 30–35°C. The same comparative approach was also performed using a mixed microbial suspension containing both a bacterium and a yeast, specifically B. subtilis and Candida albicans ATCC 10231.
The resulting CFU data from each method was (1) compared against the predicted challenge inoculum levels and (2) between the methods. Both of these options are recommended in the upcoming revision to PDA TR33. When comparing the counts against the predicted challenge levels, the mean recovery per concentration together with its confidence intervals was established using a normal distribution (at each concentration separately) while making use of the logarithmic transformation of the recoveries. Non-inferiority was determined when the lower 95% confidence limit (LCL) for each spiked concentration level was above the non-inferiority margin of 70%.
The formula for the mean recovery at one concentration is as follows:
θA = exp{μlog} ≡ exp{ ∑i=1n [log(ri) / n] }
with μlog the mean of the logarithmically transformed recoveries, ri the recovery (i.e., the count divided by the spiked concentration level), log the natural logarithm, and n the number of counts for the specific concentration. The lower 95% confidence limit is obtained by:
LCL = θA • exp{ −tn−1−1(0.95) • slog }
with
slog2 = ∑i=1n [(log(ri) − μlog)2 / (n − 1)]
the variance of the logarithmically transformed recoveries and with tn−1−1(0.95) the 95% upper quantile of the t-distribution with n − 1 degrees of freedom.
All calculations were performed in Excel. The results from this study are presented in Table 1.
Table 1. B. subtilis compared against the predicted challenge inoculum levels.
| Inoculum Concentration (CFU/sample) | LOUIS System | Conventional Method |
|---|
| Mean % Recovery | 95% LCL | Mean % Recovery | 95% LCL |
|---|
| 5 |
191.8 |
132.7 |
175.7 |
147.8 |
| 25 |
155.5 |
134.3 |
202.3 |
185.8 |
| 50 |
154.9 |
136.9 |
176.1 |
164.4 |
| 100 |
142.2 |
117.8 |
181.8 |
173.9 |
| 300 |
136.5 |
126.3 |
122.8 |
116.5 |
Both the LOUIS System and the conventional method demonstrated non-inferiority when the recoveries were compared with the predicted challenge levels (i.e., the 95% LCL was above 70%).
Separately, the recoveries from both methods were used to assess non-inferiority of the LOUIS System to the conventional method by using a Poisson distribution and calculating the ratios of the two means and the lower confidence limits at each spiked concentration. The same 70% non-inferiority margin was used in these analyses.
The calculation of the lower confidence limit for each spiked concentration is calculated by the following expression:
(x̄L / x̄C) • exp{ −1.645 × √[1/(nL • x̄L) + 1/(nC • x̄C)] }
with x̄L / x̄C = the ratio of the LOUIS/conventional method CFU × 100, nL = # LOUIS replicates, x̄L = LOUIS mean recovery, nC = # conventional method replicates, and x̄C = conventional method mean recovery. The data from this study is presented in Table 2.
Table 2. B. subtilis comparing both methods.
| Inoculum Concentration (CFU/sample) | Mean counts (CFU/sample) | Ratio LOUIS/Conventional Method × 100 | 95% LCL |
|---|
| Louis System | Conventional Method | | |
|---|
| 5 |
10.6 |
9.0 |
117.5 |
88.6 |
| 25 |
40.0 |
50.9 |
77.8 |
68.2 |
| 50 |
78.2 |
88.3 |
88.5 |
79.7 |
| 100 |
145.5 |
182.0 |
79.9 |
74.2 |
| 300 |
411.2 |
369.1 |
111.5 |
106.6 |
The recovery of B. subtilis in the LOUIS System was non-inferior to the recovery in the conventional method at all spiked concentrations except for the 25 CFU level, where the 95% LCL was just under the 70% non-inferiority margin. This discrepancy is not significant since the two (2) challenge concentrations on either side of this data point (i.e., 5 and 50 concentrations) exceeded the 70% acceptance criterion.
To demonstrate Accuracy with mixed cultures, the same studies were repeated with suspensions composed of B. subtilis and Candida albicans. Tables 3 and 4 summarize the results.
Table 3. B. subtilis and C. albicans compared against the predicted challenge inoculum levels.
| Inoculum Concentration (CFU/sample) | LOUIS System | Conventional Method |
|---|
| Mean % Recovery | 95% LCL | Mean % Recovery | 95% LCL |
|---|
| 5 |
248.2 |
160.7 |
137.7 |
99.0 |
| 25 |
167.2 |
129.5 |
147.0 |
128.2 |
| 50 |
126.0 |
107.9 |
131.7 |
114.5 |
| 100 |
112.5 |
101.2 |
117.0 |
104.4 |
| 300 |
108.5 |
97.8 |
106.9 |
98.6 |
Table 4. B. subtilis and C. albicans comparing both methods.
| Inoculum Concentration (CFU/sample) | Mean counts (CFU/sample) | Ratio LOUIS/Conventional Method × 100 | 95% LCL |
|---|
| Louis System | Conventional Method | | |
|---|
| 5 |
14.6 |
7.4 |
196.2 |
148.2 |
| 25 |
44.3 |
37.3 |
118.8 |
103.4 |
| 50 |
64.3 |
66.9 |
96.2 |
86.3 |
| 100 |
113.6 |
118.1 |
96.1 |
88.6 |
| 300 |
328.4 |
322.3 |
101.9 |
97.1 |
The recovery of a mixture of B. subtilis and C. albicans in the LOUIS System was non-inferior to the recovery in the conventional method at all spiked concentrations.
Limit of Quantitation (LOQ)
The same recovery data used in the Accuracy studies were utilized to determine the limit of quantitation (LOQ) in the LOUIS System. Here, we ran a weighted regression analysis in a Minitab statistical software program using the predicted spike concentrations between 5 and 300 CFU. The weights were calculated from the variance in the recovered counts at each concentration level (weight = 1/variance). Then we performed the analysis as follows: in Minitab, the recovered counts were used as the Responses, the predicted spike concentrations were used as the Continuous Predictors, and the calculated weights were identified in the Options menu. The coefficients for the linear concentration-response curves were estimated (the intercept or the predicted mean count at blank sample α, and the slope β), the standard error of the intercept (SEα) was determined, and the residual variance (σ2) was calculated by squaring the standard error of the regression.
Because we did not include blank samples in our data set, we predicted the variance at a spike level of zero. This was done by conducting a (standard) linear regression analysis on the sample standard deviations calculated for the spike levels.
A new regression analysis was performed (not weighted, using SDEV as the Responses and the predicted spike concentrations as the Continuous Predictors), which provided the intercept for the SDEV of blank samples. Then, the variance of blank samples was determined as follows: the intercept for the SDEV of blank samples was squared, and this value was multiplied by the residual variance σ2 from the prior weighted regression line to obtain the variance at blank samples. We also calculated the total variability at blank samples as follows: we addressed the uncertainty in estimating the mean count of the original regression intercept at blank samples by squaring the standard error of the intercept (SEα), calculating the total variance (SEα2 + σ̂02), and determining the SDEV by taking the square root of the total variance.
Finally, the upper quantile was determined at three (3) times the SDEV, which is approximately at the significance level of 0.1% away (upwards) from the intercept from the original weighted regression analysis (i.e., the predicted mean count at blank sample, α). Translating this to a concentration level using the original weighted regression line (α (intercept) + β (slope) × spike), we calculated the LOQ using the following equation:
LOQ = [upper quantile − α] / β
Using the analysis described above, and the data from the Accuracy studies, the LOQ for B. subtilis was estimated to be 3.5 CFU. This was based on a weighted regression analyses where α = 4.31 and β = 1.3907. Similarly, the LOQ for the B. subtilis and C. albicans mixture was estimated to be 9.0 CFU. This was based on a weighted regression analyses where α = 10.99 and β = 1.0509. Overall, these initial studies demonstrated LOQ's in the viable single cell range.
Linearity
Linearity can be defined as the ability to produce results that are proportional to the concentration of microorganisms present in the sample within a given range. An R2 value is an indirect measure of Linearity and generally speaking, an R2 larger than 90% indicates a good prediction of linearity. Although the larger the R2 value, the less likely Linearity is violated, but it is no guarantee that Linearity is true since it also depends on the range of spike levels being tested. As such, additional tests for linearity are recommended. One such assessment is to apply a goodness-of-fit test to evaluate the appropriateness of Linearity by comparing the regression line with a more extensive model. For instance, one can add a quadratic term to the regression analysis. In this instance, the goodness-of-fit test should not be statistically significant (i.e., the p-value should be ≥ 0.05).
Linearity across the range of the test was determined using the data from the Accuracy studies. From the weighted regression analysis described for LOQ, the estimated regression line (4.31 + 1.3907 × spike) for B. subtilis gave an estimated R2 = 96.50%, and the estimated regression line (10.99 + 1.0509 × spike) for the B. subtilis and C. albicans mixture gave an estimated R2 = 93.14%.
To determine if linearity was appropriate for the full range of the spiked concentrations, the same weighted regression analysis for LOQ was performed as above, but this assessment included a quadratic term in the calculations. The resulting p-value for B. subtilis was 0.958, which was not statistically significant (the p-value was > 0.05), demonstrating linearity was appropriate for the full range of the spiked concentrations. Similarly, the p-value for the B. subtilis and C. albicans mixture was 0.958, which also demonstrated linearity across the full range of the spiked concentrations.
Alive, Alive, It's Alive!
The LOUIS System was trained to differentiate live cells from dead cells. Figure 2 illustrates the analysis and spectral signal of live versus dead cell discrimination across seven distinct species. The multidimensional data was subjected to Principal Component Analysis (PCA), an unsupervised statistical method, to generate a two-dimensional representation. The resulting clusters from the analysis are distinctly separated based on whether the organism is alive or dead (dead microorganisms are represented in blue, and viable microorganisms are represented in black). This clear separation confirms the effectiveness of the spectral signatures in differentiating between the two groups.
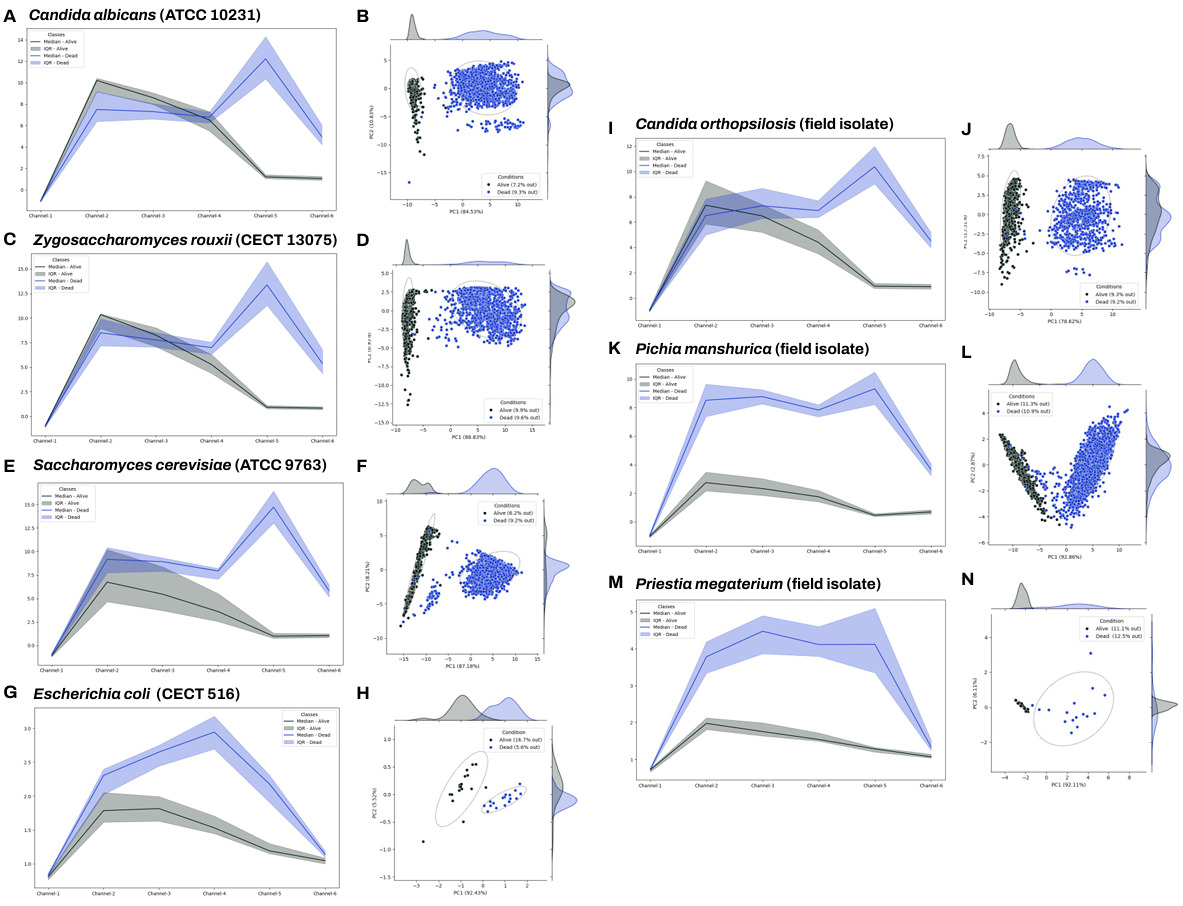 Figure 2. Viable versus dead cell modelling. Principal Component Analyses (PCA) and spectral signatures illustrating live/dead cell discrimination across seven distinct yeast and bacteria species in vermouth wine. Seven different microorganisms were spiked in vermouth wine sourced from a partner company. Cells were killed by incubating four days in the matrix. For each strain, two samples with live cells and two with dead cells were prepared using our TMSI method. Spectral signatures were acquired for approximately 60 individual cells for bacteria (Escherichia coli and Priestia megaterium), 10000 for yeasts. Dead microorganisms are represented in blue, live ones are represented in black. A–B. Signal-to-Background Ratios (SBR) and PCA obtained for Candida albicans (ATCC 10231). C–D. SBR and PCA obtained for Zygosaccharomyces rouxii (CECT 13075). E–F. SBR and PCA obtained for Saccharomyces cerevisiae (ATCC 9763). G–H. SBR and PCA obtained for Escherichia coli (CECT 516). I–J. SBR and PCA obtained for Candida orthopsilosis (isolated from our partner factory). K–L. SBR and PCA obtained for Pichia manshurica (isolated from our partner factory). M–N. SBR and PCA obtained for Priestia megaterium(isolated from our partner factory).
Spore.Bio initially assessed the likelihood for the LOUIS System to detect dead cells by analyzing the products from one of its early adopters in the alcoholic beverage industry. The products evaluated were two types of vermouth, which is an aromatized, fortified wine flavored with botanicals that generally has an alcohol content between 15% and 18%. While vermouth starts with a wine base produced by yeast fermentation, the production process ensures no active yeast remains in the final, bottled product. In the case of Spore.Bio's early adopter, Saccharomyces cerevisiae was the yeast used to manufacture the two types of vermouth, and no viable yeast cells were expected to be present in the final products.
To test these assumptions, the entire contents of duplicate 500 mL bottles of vermouth were separately filtered and processed in the LOUIS System. Similarly, the entire contents of duplicate 500 mL bottles were filtered and plated onto Malt Extract Agar (MEA) and incubated for 48 hours at 30°C. This was repeated with the second type of vermouth, resulting in two (2) replicates per type of test sample in both methods. Table 5 provides the results of this study.
Table 5. Vermouth study.
| Inoculum Concentration | Sample | TYMC (CFU) | Total of cells (dead + viable) |
|---|
| | | Louis System | Conventional Method | |
|---|
| 0 |
Vermouth A1 |
0 |
0 |
180 |
| 0 |
Vermouth A2 |
0 |
0 |
148 |
| 20 |
Vermouth A3 |
17 |
17 |
1,957 |
| 20 |
Vermouth A4 |
37 |
16 |
27,324 |
| 0 |
Vermouth B1 |
0 |
0 |
78 |
| 0 |
Vermouth B2 |
0 |
0 |
1,307 |
| 20 |
Vermouth B3 |
50 |
26 |
521 |
| 20 |
Vermouth B4 |
43 |
12 |
1,276 |
Zero (0) CFU was detected in both the LOUIS System and the conventional agar plate methods. However, the total of dead cells was detected (but not enumerated) in the LOUIS System, specifically, 180 and 148 dead cells in one product, and 78 and 1307 dead cells in the second product. The discrepancy in the number of dead cells in the second product may be due to lot to lot or bottle to bottle variability, although this could not be confirmed. The dead cells were verified by manually examining the processed images and confirming the morphologies appears to be non-viable, large yeast cells.
A follow-up study was conducted to demonstrate that viable yeast cells, if present, would be detected and enumerated by both methods, and would be differentiated by the dead yeast cells that would be expected to be present in the product. The same procedure as described above was repeated, but low levels of Saccharomyces cerevisiae ATCC 9763 were inoculated into the products just prior to filtration and processing in the LOUIS System or plated on agar. The LOUIS System enumerated 17 and 37 CFU, and the conventional method enumerated 17 and 16 CFU, in the first vermouth product. The number of dead plus viable cells in this experiment was confirmed to be 1,957 and 27,324. Similarly, the LOUIS System enumerated 50 and 43 CFU, and the conventional method enumerated 26 and 12 CFU, in the second vermouth product. The number of dead plus viable cells in this experiment was 521 and 1,276.
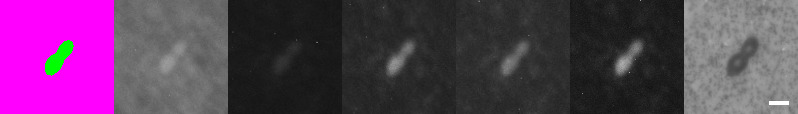
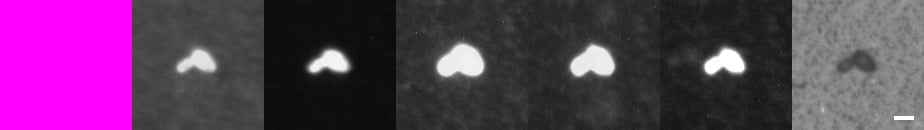 Figure 3. Multimodal Spectral Imaging and Predictive Modeling of Saccharomyces cerevisiae. The top image of Figure 3 shows viable cells of Saccharomyces cerevisiaeATCC 9763, while the bottom image shows dead cells of the same species naturally present in the vermouth sample. The seven images display the model's detection results alongside the corresponding camera captures. From left to right, the first image shows the bicolor detection mask generated by the model, followed by the camera images presented sequentially from Camera 5 to Camera 0, each focusing on a distinct segment of the spectrum. In the bicolor view, live microorganisms (MO) are shown in green, while dead cells, particles, or background are shown in purple. Each pixel is classified into one of these two categories. The white scale bar, 20 pixels long, corresponds to 5 μm.
Overall, microorganisms exhibit a higher signal than dead cells, as illustrated in Figure 3. However, a deeper analysis reveals that dead yeast cells are identified using Camera 4 (centered at 550 nm). On this specific camera, dead microorganisms show an elevated Signal-to-Background Ratio compared to live cells. This is likely due to the increased membrane porosity of dead cells, which facilitates a greater accumulation of matrix material within them.
These results clearly demonstrate that under the conditions of the test, the LOUIS System was able to differentiate and discriminate viable signals from non-viable or dead cell signals, eliminating the potential for false positives in the sample matrices evaluated. Regarding the observed wide range of dead cells in this experiment, we understand there can exist variability in the number of dead yeast cells in the finished product, which can vary from batch to batch and even from bottle to bottle.
Verifying Your Identity
Although there are numerous AMM/RMMs that can enumerate microorganisms, we are unaware that any of them can simultaneously identify these organisms to the Genus and species level, without additional workflows and/or preparation steps. Similarly, AMM/RMMs that can detect the presence of certain types of microorganisms (e.g., such as PCR or other nucleic acid amplification techniques) would not normally have the ability to quantify how many organisms are present in the test sample. As an example, growth-based methods will produce CFUs or growth in liquid media, which can then be subcultured for subsequent analyses, including microbial identification using a different test method, such as biochemical characterization, 16S rDNA and next generation sequencing, fatty acid analysis, MALDI-TOF mass spectrometry or Raman spectroscopy. However, most commercially available, non-growth-based AMM/RMMs either do not have the direct capability to identify microorganisms or are considered destructive by design, i.e., there is no process by which detected microorganisms can be used for further testing, including microbial identification.
The LOUIS System is capable of generating spectral fingerprints of previously analyzed microorganisms that allow for microbial identification if the system "sees" the same spectral fingerprint in subsequent analyses. Accordingly, the LOUIS System can operate as a stand-alone microbial identification platform, in which pure cultures of microorganisms, such as those obtained from isolated colonies, can be introduced into the technology and a microbial identification to the species level acquired, as long as that same microorganism has been previously analyzed and added to the system's spectral fingerprint library.
To assess the discriminative capabilities of the machine learning model across a diverse range of microorganisms, Gram-positive and Gram-negative bacteria, yeasts, and molds were evaluated in the system based on their spectral signatures. Figure 4 illustrates the class-specific spectral signatures extracted across the six acquisition channels ("cameras") and summarizes the distribution of responses for each class over 796 fields of view. For each microorganism, the mean spectrum is shown together with an interval band (shaded area) reflecting within-class variability.
Despite partial overlap between some organisms, the profiles exhibit distinct multi-channel patterns (differences in relative intensity and curvature across channels), providing discriminative information beyond overall amplitude. Importantly, non-biological classes (e.g., dust and membrane) display different response patterns, supporting the model's ability to distinguish microorganisms from inert particles and matrix elements. Overall, the figure highlights that the machine-learning model leverages reproducible, class-dependent spectral fingerprints to enable microorganism discrimination at the single-object level.
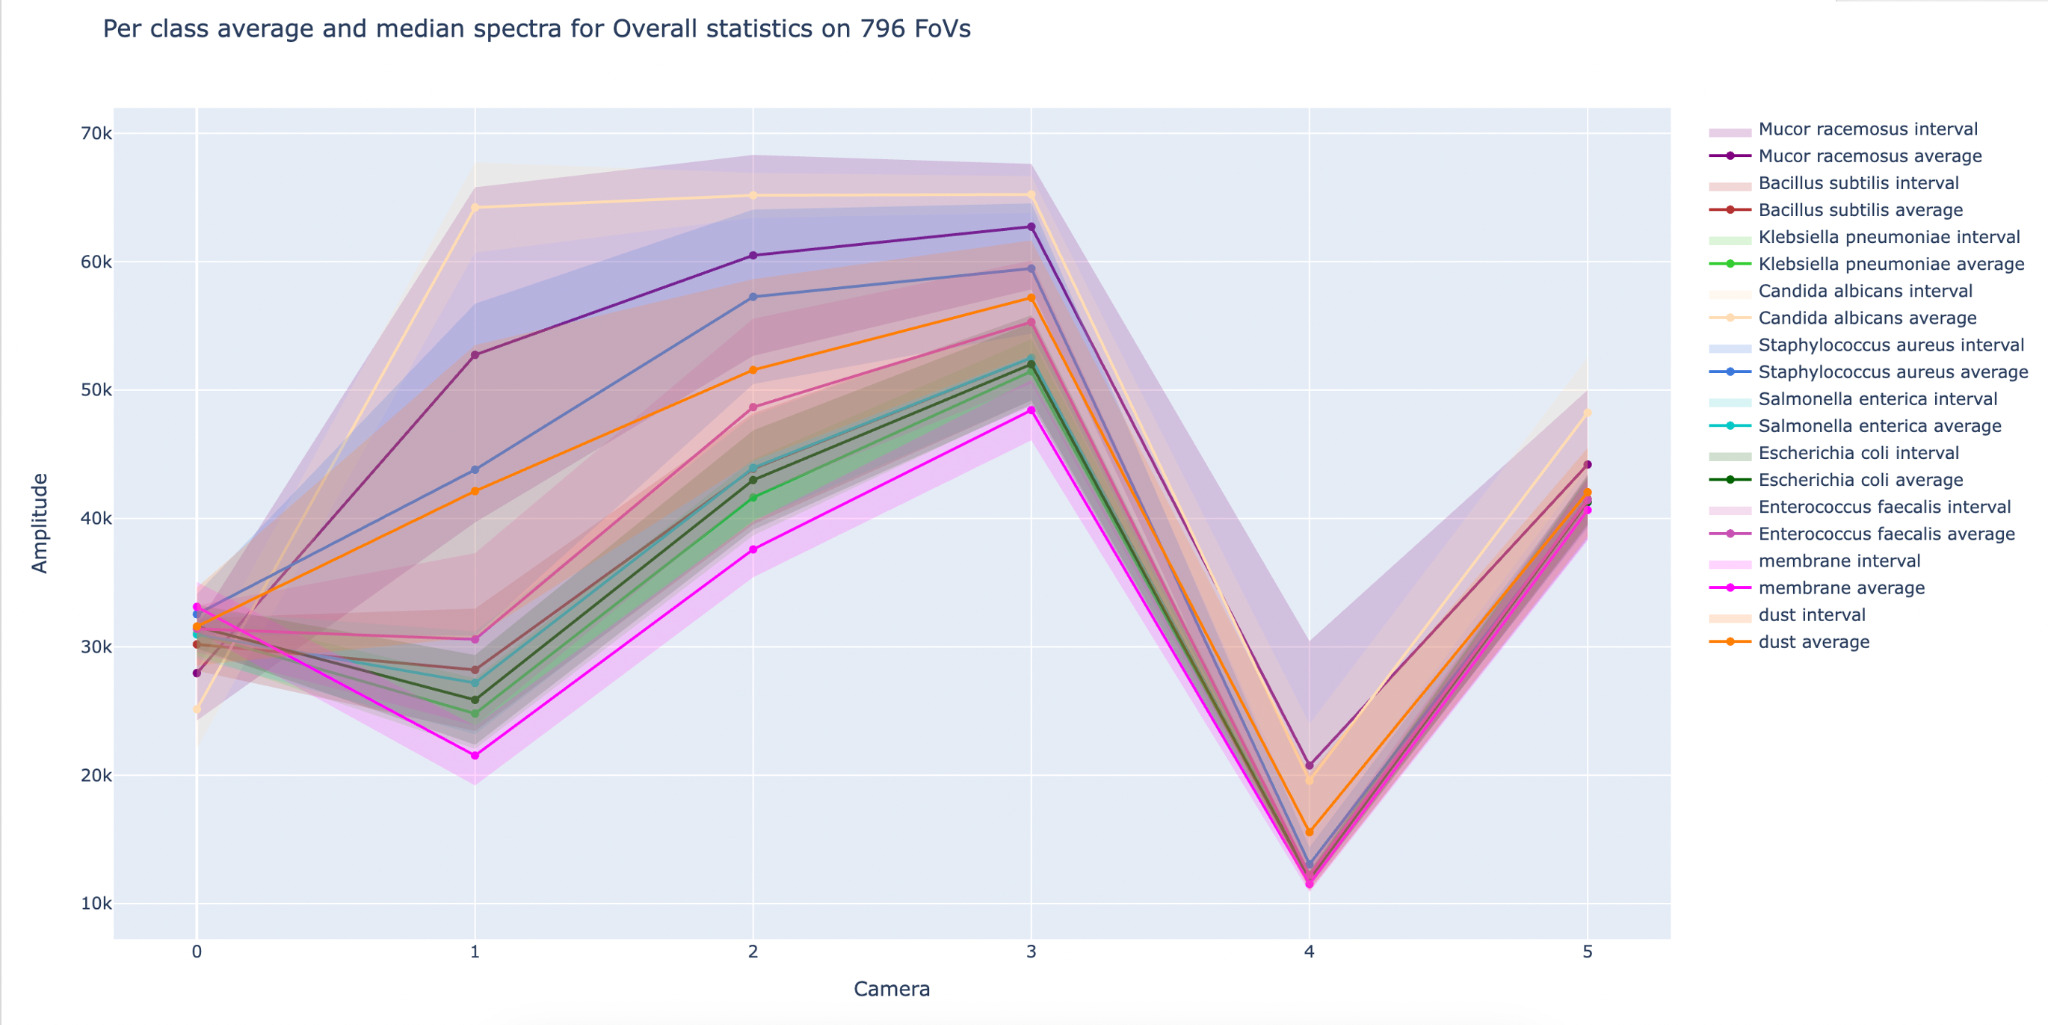 Figure 4. Illustration of machine learning model capabilities for the discrimination of microorganisms.
To demonstrate this capability, a panel of microorganisms was selected based on their inclusion in the USP as growth promotion and method suitability organisms, as well as additional species requested to be tested by Spore.Bio's early adopters, were cultivated using conventional techniques, isolated on solid media and resuspended in a Tryptone salt solution. A 50 μL aliquot of the suspension was deposited onto the LOUIS System membrane consumable, filtered and introduced into the technology workflow. In addition to the panel of microorganisms used for inclusivity testing, non-target strains were incorporated for exclusivity testing. When the confidence level of the spectral fingerprint is above an internally specified acceptance criterion, a microbial identification is reported. Conversely, if the confidence level of the spectral fingerprint is below the acceptance criterion, the system indicates that the microorganism is not recognized by the model and no microbial identification is reported. The latter would be the case for a microorganism that has not been previously analyzed and added to the system's identification library. Table 7 provides a summary of the microorganisms used and the results of the study.
Table 7. Microorganism identification testing.
| Microorganisms | Strain | # Replicates | Correct Identification | Incorrect Identification | No Identification |
|---|
| Bacillus subtilis |
ATCC 6633 |
3 |
100.0% |
0.0% |
0.0% |
| Staphylococcus aureus |
ATCC 6538 |
3 |
100.0% |
0.0% |
0.0% |
| ATCC 25923 |
3 |
66.7% |
0.0% |
33.3% |
| CECT 59 |
3 |
100.0% |
0.0% |
0.0% |
| |
|
|
|
|
| Burkholderia cepacia |
CECT 322 |
3 |
100.0% |
0.0% |
0.0% |
| CECT 4091 |
3 |
100.0% |
0.0% |
0.0% |
| CECT 4137 |
3 |
66.7% |
0.0% |
33.3% |
| Pseudomonas aeruginosa |
ATCC 10145 |
3 |
100.0% |
0.0% |
0.0% |
| CECT 108 |
3 |
66.7% |
0.0% |
33.3% |
| CECT 116 |
3 |
100.0% |
0.0% |
0.0% |
| Pseudomonas fluorescens |
ATCC 13525 |
3 |
100.0% |
0.0% |
0.0% |
| Escherichia coli |
CECT 99 |
3 |
100.0% |
0.0% |
0.0% |
| CECT 434 |
3 |
100.0% |
0.0% |
0.0% |
| CECT 516 |
3 |
100.0% |
0.0% |
0.0% |
| Klebsiella pneumoniae |
ATCC 13883 |
3 |
100.0% |
0.0% |
0.0% |
| Pluralibacter gergoviae |
CECT 857 |
4 |
100.0% |
0.0% |
0.0% |
| Salmonella enterica |
ATCC 14028 |
3 |
66.7% |
0.0% |
33.3% |
| CECT 722 |
3 |
100.0% |
0.0% |
0.0% |
| CECT 4155 |
3 |
100.0% |
0.0% |
0.0% |
| Candida albicans |
ATCC 10231 |
3 |
100.0% |
0.0% |
0.0% |
| CECT 1392 |
3 |
66.7% |
0.0% |
33.3% |
| CECT 13118 |
3 |
66.7% |
0.0% |
33.3% |
| Aspergillus brasiliensis |
CECT 2574 |
3 |
100.0% |
0.0% |
0.0% |
| Overall |
— |
70 |
91.5% |
0.0% |
8.5% |
A total of 70 samples were analyzed, involving multiple microorganisms. Six primary organisms were tested: Staphylococcus aureus, Burkholderia cepacia, Pseudomonas aeruginosa, Escherichia coli, Salmonella enterica, and Candida albicans. For each of these microorganisms, three distinct strains were used, with three replicates per strain. Due to limited accessibility to a wider diversity of strains, only a single strain was tested for Pluralibacter gergoviae, Bacillus subtilis, Pseudomonas fluorescens, Klebsiella pneumoniae, and Aspergillus brasiliensis. While most single-strain tests were conducted in triplicate, Pluralibacter gergoviae was tested with four replicates. Each replicate at the strain level was produced on the same day, on the same machine, and by the same operator.
Across the 70 samples tested, the model provided an identification in 91.5% of cases, with all these identifications being 100% correct identification to the species level. Strains that were not identified provided a response to the model that was below the internal threshold for an accurate identification. This was observed for only six (6) replicates out of the 70 replicates examined.
We plan to address the model and improve confidence by significantly expanding our current training dataset over the coming months, with more species, strains, and replicates per strain. We are confident the model can be improved, as multiple replicates provide correct identification in this study. The dataset size is expected to increase significantly in the near future.
The study demonstrates the LOUIS System is capable of providing a correct microbial identification from pure cultures when the strain's spectral fingerprint is in the system's microbial identification library. The next phase involves expanding the training library to enhance performance and broaden the panel of microorganism tests, including the integration of exclusion studies, in which strains absent from the database will not result in incorrect identifications.
Spore.Bio is in the process of further enhancing LOUIS' capabilities to provide microbial identifications directly from detected and enumerated viable particles in addition to what was described above for pure cultures. This advancement will enable simultaneous detection, enumeration, and microbial identification to the species level, directly from the sample matrix. This will be accomplished within minutes of processing, eliminating the need for isolating colonies, pre-enrichment, or viability staining. This capability, appropriately named "QuantID," will be available later this year.
Generally, these studies confirm that the microbial identification model can reliably differentiate a broad range of organisms and provides a clear path to further refinement for the identification of never-before-detected microorganisms through additional training and expanded strain diversity. Moreover, the model has already been successfully implemented in a production facility to rapidly identify objectionable species from environmental monitoring samples.
Separating Total Aerobic Microbial Count from Total Combined Yeasts & Molds Count
Our initial step towards QuantID has been the development of a multi-quantification test for bioburden, which simultaneously measures total aerobic microbial counts (TAMC) and total combined yeasts and molds counts (TYMC).
USP chapter <61> provides the requirements for the quantitative enumeration of mesophilic bacteria and fungi that may grow under aerobic conditions. The tests described are designed primarily to determine whether a substance or preparation complies with an established specification for microbiological quality. Because many substances that would be evaluated according to USP <61> have individual specifications for TAMC and for TYMC, it is expected to perform two (2) tests and obtain two (2) separate counts: one using Soybean-Casein Digest Agar for TAMC, and one using Sabouraud Dextrose Agar for TYMC.
When interpreting the results from the USP <61> tests, the TAMC is considered to be equal to the number of CFU found using Soybean-Casein Digest Agar; if colonies of fungi are detected on this medium, they are counted as part of TAMC. The TYMC is considered to be equal to the number of CFU found using Sabouraud Dextrose Agar; if colonies of bacteria are detected on this medium, they are counted as part of TYMC. However, when the TYMC is expected to exceed the acceptance criterion due to the bacterial growth, Sabouraud Dextrose Agar containing antibiotics may be used. This can be interpreted to mean one can use antibiotics to diminish the growth of bacteria on the yeast and mold medium to obtain a more accurate estimation of the number of yeast and mold in the test sample.
One way the pharmaceutical microbiology laboratory can realize efficiencies when performing USP <61> is to condense the TAMC and TYMC tests into a single workflow. Spore.Bio has enhanced the LOUIS System to accomplish this goal by training the system to separately report TAMC and TYMC results.
Working with its early adopters in the beverage industry, samples of commercially available mineral water were inoculated with Acinetobacter johnsonii (i.e., a bacterial species that was previously isolated from the same mineral water used in this study), Candida albicans ATCC 10231, and Aspergillus brasiliensis ATCC 16404. The inoculated samples were processed in the LOUIS System and in the TAMC and TYMC conventional methods (i.e., Plate Count Agar; PCA, and MEA, respectively). A conventional plating on MEA was not performed for the yeast and mold. Table 8 shows the reported number of CFU/mL for both TAMC and TYMC.
Table 8. Bacteria and yeast testing in mineral water. ND = not done.
| Challenge Organism | Inoculum Concentration (CFU/mL) | LOUIS System | Conventional Method |
|---|
| TAMC (CFU/mL) | TYMC (CFU/mL) | TAMC (CFU/mL) | TYMC (CFU/mL) |
|---|
| Acinetobacter johnsonii |
50 |
54 |
0 |
68 |
0 |
| 50 |
77 |
0 |
69 |
0 |
| 150 |
151 |
0 |
113 |
0 |
| 150 |
96 |
0 |
145 |
0 |
| 150 |
108 |
0 |
100 |
0 |
| 150 |
83 |
0 |
182 |
0 |
| 250 |
352 |
0 |
251 |
0 |
| 250 |
339 |
0 |
276 |
0 |
| 500 |
536 |
0 |
500 |
0 |
| 500 |
872 |
0 |
675 |
0 |
| Candida albicans ATCC 10231 |
100 |
88 |
90 |
115 |
ND |
| 250 |
288 |
258 |
309 |
ND |
| 1,000 |
998 |
1,170 |
950 |
ND |
| Aspergillus brasiliensis ATCC 16404 |
50 |
43 |
36 |
33 |
ND |
It was expected that the bacterial challenge would only be detected by the TAMC methods and not the TYMC methods (i.e., in the LOUIS System and the conventional method). This is what was observed: both the LOUIS System and the conventional plate count methods recovered bacterial TAMC CFUs in the range of the inoculum concentrations. No bacterial CFUs were recovered on the TYMC agar and no CFUs were reported as TYMC in the LOUIS System. This demonstrated the LOUIS System was able to differentiate the bacterial signal from a yeast and mold signal and report the counts in the appropriate model.
Likewise, it was expected that the yeast and mold challenges would be detected in both the TAMC and in the TYMC methods, as the TYMC would be a component of the TAMC. Both the LOUIS System and the conventional plate count methods recovered fungal TAMC CFUs in the range of the inoculum concentrations. In fact, similar recoveries were observed for the LOUIS TAMC and TYMC, which we would expect based on the manner in which the models were designed. These data clearly demonstrate the ability of the LOUIS System to provide both a TAMC and a TYMC, similar to what is required in the compendia when testing non-sterile pharmaceutical dosage forms. The difference is that the LOUIS System can do this in a single rapid assay, where the compendia test requires two (2) types of growth media to arrive at the same conclusion, but with a time to result up to five (5) days later for a TAMC result, and up to seven (7) days later for a TYMC.
Additional studies are planned to use a mixture of bacteria and yeast/mold and using the agar media specified in USP <61>, to demonstrate TAMC will be reported for both types of microorganisms, but only the yeast/mold will be reported as TYMC.
Summary
The pharmaceutical industry would benefit from an alternative microbiological method that delivers a rapid time to result while providing simultaneous viable quantitation and microbial identification directly from sample matrices. The Spore.Bio LOUIS System is a novel AI-driven, high-resolution optical microbiology technology that delivers each of these features for multiple applications, including, but not limited to, bioburden tests for nonsterile finished product, raw materials and in-process samples, environmental monitoring, pharmaceutical-grade process water analyses, and later this year, finished product sterility testing.
The company's future deliverables include performing a comprehensive primary validation and the assessment of a broader selection of strains, including Viable But Non-Culturable (VBNC) and stressed cells. These studies are expected to be completed this year. Additionally, comparability will be demonstrated for bioburden and sterility testing across multiple pharmaceutical dosage forms, including filtrable and non-filtrable substances, such as powders, vaccines, small and large molecules. As the LOUIS System is already in place with several early adopters for finished product and environmental testing, deployment within the pharmaceutical industry is expected to accelerate throughout 2026.
Acknowledgements
The authors would like to acknowledge the following individuals for their support in developing the data and writing this manuscript: multiplex data on water: Apolline Vedrenne, Thomas Bui, Hady El Hajj; Identification: Victor Moin, Marius Diguat, Pierre-Baptiste Dupire; Data production: Lauriane Rainard, Amal Ouanes, Samuel Fidahoussen, Vincent Selosse, Ana Caroline Barros Lopes, Cerine Hazmani; Overall: Alois de La Comble, Marie Fournier, PhD., Massilia Hamdani PhD., Dmytro Snisarenko PhD., Marine Daou, Rebecca Dievart, Amine Raji.
References
- Taylor M. Cannon, Joao L. Lagarto, Benjamin T. Dyer, Edwin Garcia, Douglas J. Kelly, Nicholas S. Peters, Alexander R. Lyon, Paul M. W. French, and Chris Dunsby, "Characterization of NADH fluorescence properties under one-photon excitation with respect to temperature, pH, and binding to lactate dehydrogenase," OSA Continuum 4, 1610–1625 (2021)
- 2014. Blacker, T., Mann, Z., Gale, J. et al. Separating NADH and NADPH fluorescence in live cells and tissues using FLIM. Nat Commun 5, 3936. https://doi.org/10.1038/ncomms4936
- 2022. Müllerová, L.; Marková, K.; Obruča, S.; Mravec, F. Use of Flavin-Related Cellular Autofluorescence to Monitor Processes in Microbial Biotechnology. Microorganisms. 10, 1179. https://doi.org/10.3390/microorganisms10061179
- 2025. Mads Lichtenberg, PhD, Fujifilm Biotechnologies, et. al., Equivalence Testing of BFPCs in Grade A Environments, PDA Letter.
- 2023. Salvas J, Merker P, Dingle M, et al. Understanding the Non-Equivalency of Bio-Fluorescent Particle Counts versus the Colony-Forming Unit. PDA J Pharm Sci Technol, Vol. 77(6).
- 2024. An Alternative Microbiological Validation for an Online Water Bioburden Analyzer. Olivia L Venhuizen, Cynthia E Martindale, Feng Jin Liew, James Cannon, Arundhati Samanta, Mike J Scaramozzino. Journal of AOAC INTERNATIONAL, Volume 107 (6): 997–1017. https://doi.org/10.1093/jaoacint/qsae050
- United States Pharmacopeia (USP). Chapter <1223>. Validation of alternative microbiological methods. U.S. Pharmacopeial Convention, Rockville, Maryland.
- European Pharmacopoeia. Chapter 5.1.6. Alternative methods for control of microbiological quality. European Directorate for the Quality of Medicines (EDQM), Strasbourg, France.
- PDA Technical Report #33. Evaluation, Validation and Implementation of Alternative and Rapid Microbiological Methods. Under revision; expected publication 2026.
- 2025. Hands-On Learning: Performing Statistical Calculations for Quantitative Rapid Method Validation Criteria. Pharmalab Congress and Exhibition. ECA, Düsseldorf, Germany.
- 2025. Revision of PDA Technical Report 33. Evaluation, Validation and Implementation of Alternative Microbiological Methods. PDA Annual Global Conference on Pharmaceutical Microbiology. PDA, Washington, DC.
- 2025. Hands-On Learning: Performing Statistical Calculations for Qualitative Rapid Method Validation Criteria. European Microbiology Conference. ECA, Vienna, Austria.
Subscribe to our e-Newsletters
Stay up to date with the latest news, articles, and events. Plus, get special
offers from American Pharmaceutical Review delivered to your inbox!
Sign up now!