By: Dr. Ajay Pazhayattil, President, cGMP World, Dr. A. Ram Mohan Rao, President Quality and Chief Quality Officer, Aurobindo Pharma Ltd., Sanjay Sharma, Senior VP & Head Manufacturing Science and Technology, Zydus Group, Marzena Ingram, Senior Consultant, ELIQUENT Life Sciences
Over the past decade, process validation1 has evolved from a predominantly standalone activity to a lifecycle-based, ongoing discipline that emphasizes process understanding, control, and continuous improvement. The ICH Q12 tool, Post-Approval Change Management Protocol2, enables continuous improvement by primarily using datasets and signals from Stage 3 (Continued Process Verification) of the process validation lifecycle. Stage 3, along with the ICH tools, enables the introduction of enhanced processes into product manufacturing as soon as possible, benefiting patients. Despite this intent, industry adoption of structured Stage 3b signal-based process optimization remains limited. One of the principal barriers is the absence of clear, standardized approaches for determining how to respond when Stage 3b data signals are detected. As a result, organizations frequently struggle to distinguish between normal process variability and true process drift, leading to inconsistent, sometimes regulatory vulnerable decision making.
This article highlights fresh perspectives on science and risk-based approaches, with tailored statistical analysis, in commercial manufacturing (Stage 3b). The level of effort and assessment must be proportional to the identified risk. Thus, it helps focus on intensive monitoring of parameters/attributes with greater risks. A successful Stage 3b program demands interdisciplinary collaboration, greater internal technical capability in statistics, and calculated risk-taking.
Stage 3b CPV data signals are typically generated by applying Nelson rules, Western Electric rules, or other Statistical Process Control (SPC) criteria to trended Critical Material Attributes (CMAs), Critical Process Parameters (CPPs), and Critical Quality Attributes (CQAs). Importantly, such signals, in isolation, do not represent product failures, specification breaches, or confirmed process deviations. Out-of-Specification (OOS) or process deviations are “Red Flag” events and are subject to formal investigation under the Quality Management System (QMS). In contrast, Stage 3b CPV signals are early indicators of potential variability that require structured scientific and statistical evaluation before determining whether a formal investigation is warranted. These may be appropriately characterized as “Yellow Flag” signals.
Table 1: Examples of a Risk Proportional Statistical Assessment Guidance |
|---|
Quality Attribute | Recommended Statistical Assessment | Guidance for Responding to Stage 3b Data Signals |
|---|
LOD | Compute one-sided tolerance interval (TI). [Note: For products with potential compressibility issues, a lower limit may be required.] | Residual moisture can compromise product stability, shelf life, and efficacy. It can lead to degradation and physical changes. In typical cases, LOD is either within the tight limit or significantly higher; hence, it does not follow a normal distribution. The spec is one-sided and typically monitored throughout the manufacturing process. Reaction Recommendation: If TI is found to be outside, recommend Stage 1 review of manufacturing control strategy; otherwise, continue monitoring. |
Physical Attribute (BD) | Calculate Carr’s Index (CI) and Hausner’s Ratio (HR) for NLT 30 blend batches and determine the mean value. | Adequate control of physical attributes supports manufacturability, material handling, flow, and compressibility, and helps ensure that blend uniformity, dosage uniformity, and weight variation CQAs are consistently met. Reaction Recommendation: If the mean CI and HR (flow property) across 30 batches differ significantly from PDR and there is a high product loss, tablet rejection, and BU/CU OOS trend, then recommend a continuous improvement CAPA; otherwise, continue monitoring. |
Blend Uniformity (BU) | Perform VCA to determine % of the total observed variation (for information only). Compute SD (NMT 5%). Compute a two-sided tolerance interval (TI). Correlation analysis (BU vs CU) (if risk-based stratified CU is added/part of control strategy) | Blend uniformity depends on mixing efficiency, raw material properties, and sampling accuracy. If it is true blend variability/segregation, then it directly affects dose accuracy. Results often show a normal distribution. Shifts typically arise from segregation, inadequate mixing, particle size differences, or sampling bias. It needs to be noted that BU results are normally inherent to a batch. Reaction Recommendation: If BU SD is >5%, and TI are found to be outside, then introduce risk-based stratified CU sampling for NLT 30 commercial batches (heightened sampling at the beginning, throughout, stoppages, at any significant event and end of the compression run). The number of samples should be decided based on the compression run time, but not less than 20 intervals. If signals persist and a positive correlation with CU is observed, permanently add risk-based stratified CU sampling and testing to the commercial batch record (enhanced control strategy). If both BU and CU exhibit variability, the process should be considered for remediation. |
Dosage Uniformity (DU) | Verify if AV for the first 10 units is >15. | Dosage uniformity variability can arise from compression, encapsulation, or filling operations, reflecting the manufacturing equipment controls. It may also result from inadequate mixing/blend uniformity or variability in input raw materials. Acceptance criteria for DU are defined by pharmacopeial requirements, ex, USP <905>. Uniformity of dosage criterion – Acceptance Value (AV) primarily assesses the variability from the analysis of no less than ten tablets. The performance of a single unit, while important, is largely unrelated to the ability to meet the AV requirements. AV incorporates two-stage acceptance criteria (L1, L2). Also, there is an additional requirement that individual results are within a limit. Reaction Recommendation: If the AV of the first 10 units is >15, introduce stratified CU sampling for NLT 30 commercial batches (stratified sampling of the compression run). If data signals persist, then continue stratified CU sampling and testing as part of the commercial batch record (enhanced control strategy). |
Assay | Perform VCA to determine % of the total observed variation. Compute a two-sided tolerance interval (TI) | Assay is a critical label quality attribute. An assay is a quantitative test and, hence, typically follows a normal distribution. Variability in components, process parameters, degradation, or process loss can impact assay results. There is typically only one assay sample (i.e., a composite of at least ten dosage units) analyzed per batch. Thus, the impact of intra-batch variation on the assay is considered less significant in assessing the overall variation. Because the assay has a two-sided specification (e.g., 95 to 105%), both the upper and lower TI limits are expected to fall within the specification limits. Reaction Recommendation: If between-batch variability contributes to >40% of the total variability (VCA), and TI is found to be outside, and no process loss is identified for the associated batch/s, recommend unit operation-based heightened sampling and reporting for NLT 30 batches to determine degradation or process loss potential (enhanced control strategy). If variability sources remain unidentified, initiate a continuous improvement CAPA for Stage 1 process remediation, or continue with heightened Assay sampling and testing. If inter and intra batch variability is low but results consistently fall on the high or low side of the specification (e.g., triggering Nelson Rule 2), process remediation is warranted. |
Impurities | Compute one-sided tolerance
interval (TI). | Process parameters, raw material, environmental conditions, and other factors can cause degradation. Formulation design typically ensures the API is protected. Impurity % is a quantitative test with a lower value result (e.g., NMT 0.2%) and a one-sided specification. Reaction Recommendation: If TI is found to be outside, recommend Stage 1 review of manufacturing control strategy; otherwise, continue monitoring. Under QMS, an OOT is generally triggered when a result exceeds 50% of the impurity specification limit (e.g., >0.1 for an NMT 0.2% criterion). |
Dissolution | Verify if there are S2 results. Then, determine the number of tablets resulting in S2. Compute the tolerance interval (TI). | Dissolution is a patient critical quality attribute. For the immediate-release product, a dosage release per claim is required for therapeutic efficacy. Acceptance criteria for dissolution testing are defined by pharmacopeial requirements, USP General Chapter <711>. Dissolution limits are inherently statistical in nature, and the stage-wise acceptance framework is more complex than typical single-value specifications. The immediate release product follows a three-stage Q-based acceptance scheme evaluated at a single time point, allowing testing of as few (N=6 units) when tighter pharmacopeial limits can be met. N=12 and N=24 testing is permitted by the pharmacopeia. Response Recommendation: If the product went to S2 and all tablets from the initial N=6 result are NLT Q, then continue monitoring. If not, heighten dissolution testing with N=12 for NLT 30 batches. If the N=12 TI is within the specification, continue with monitoring. |
The assessments should consider not only the batches that triggered the signal but also the associated batches that contributed |
The 2011 FDA Process Validation Guidance explicitly states that CPV procedures must “guard against overreaction to individual events, as well as against failure to detect unintended process variability”. Overreaction, despite having no impact on the product or process, can drive unsubstantiated root cause analyses, ineffective CAPAs, inflated quality system metrics, and increased regulatory risks. Recognizing this industry wide inconsistency, the PDA Process Validation Interest Group (PVIG) published an early position paper highlighting the need for rational3, science-based reaction mechanisms to Stage 3b signals. The present article operationalizes this intent through a structured decision-making framework that applies manufacturing science, data sufficiency rules, and statistical assessment requirements by CMA/CPP/CQA type, enabling a risk-based response. The approach specifically avoids disproportionate reactions to data signals and minimizes interpretational inconsistency, ultimately avoiding regulatory vulnerabilities.
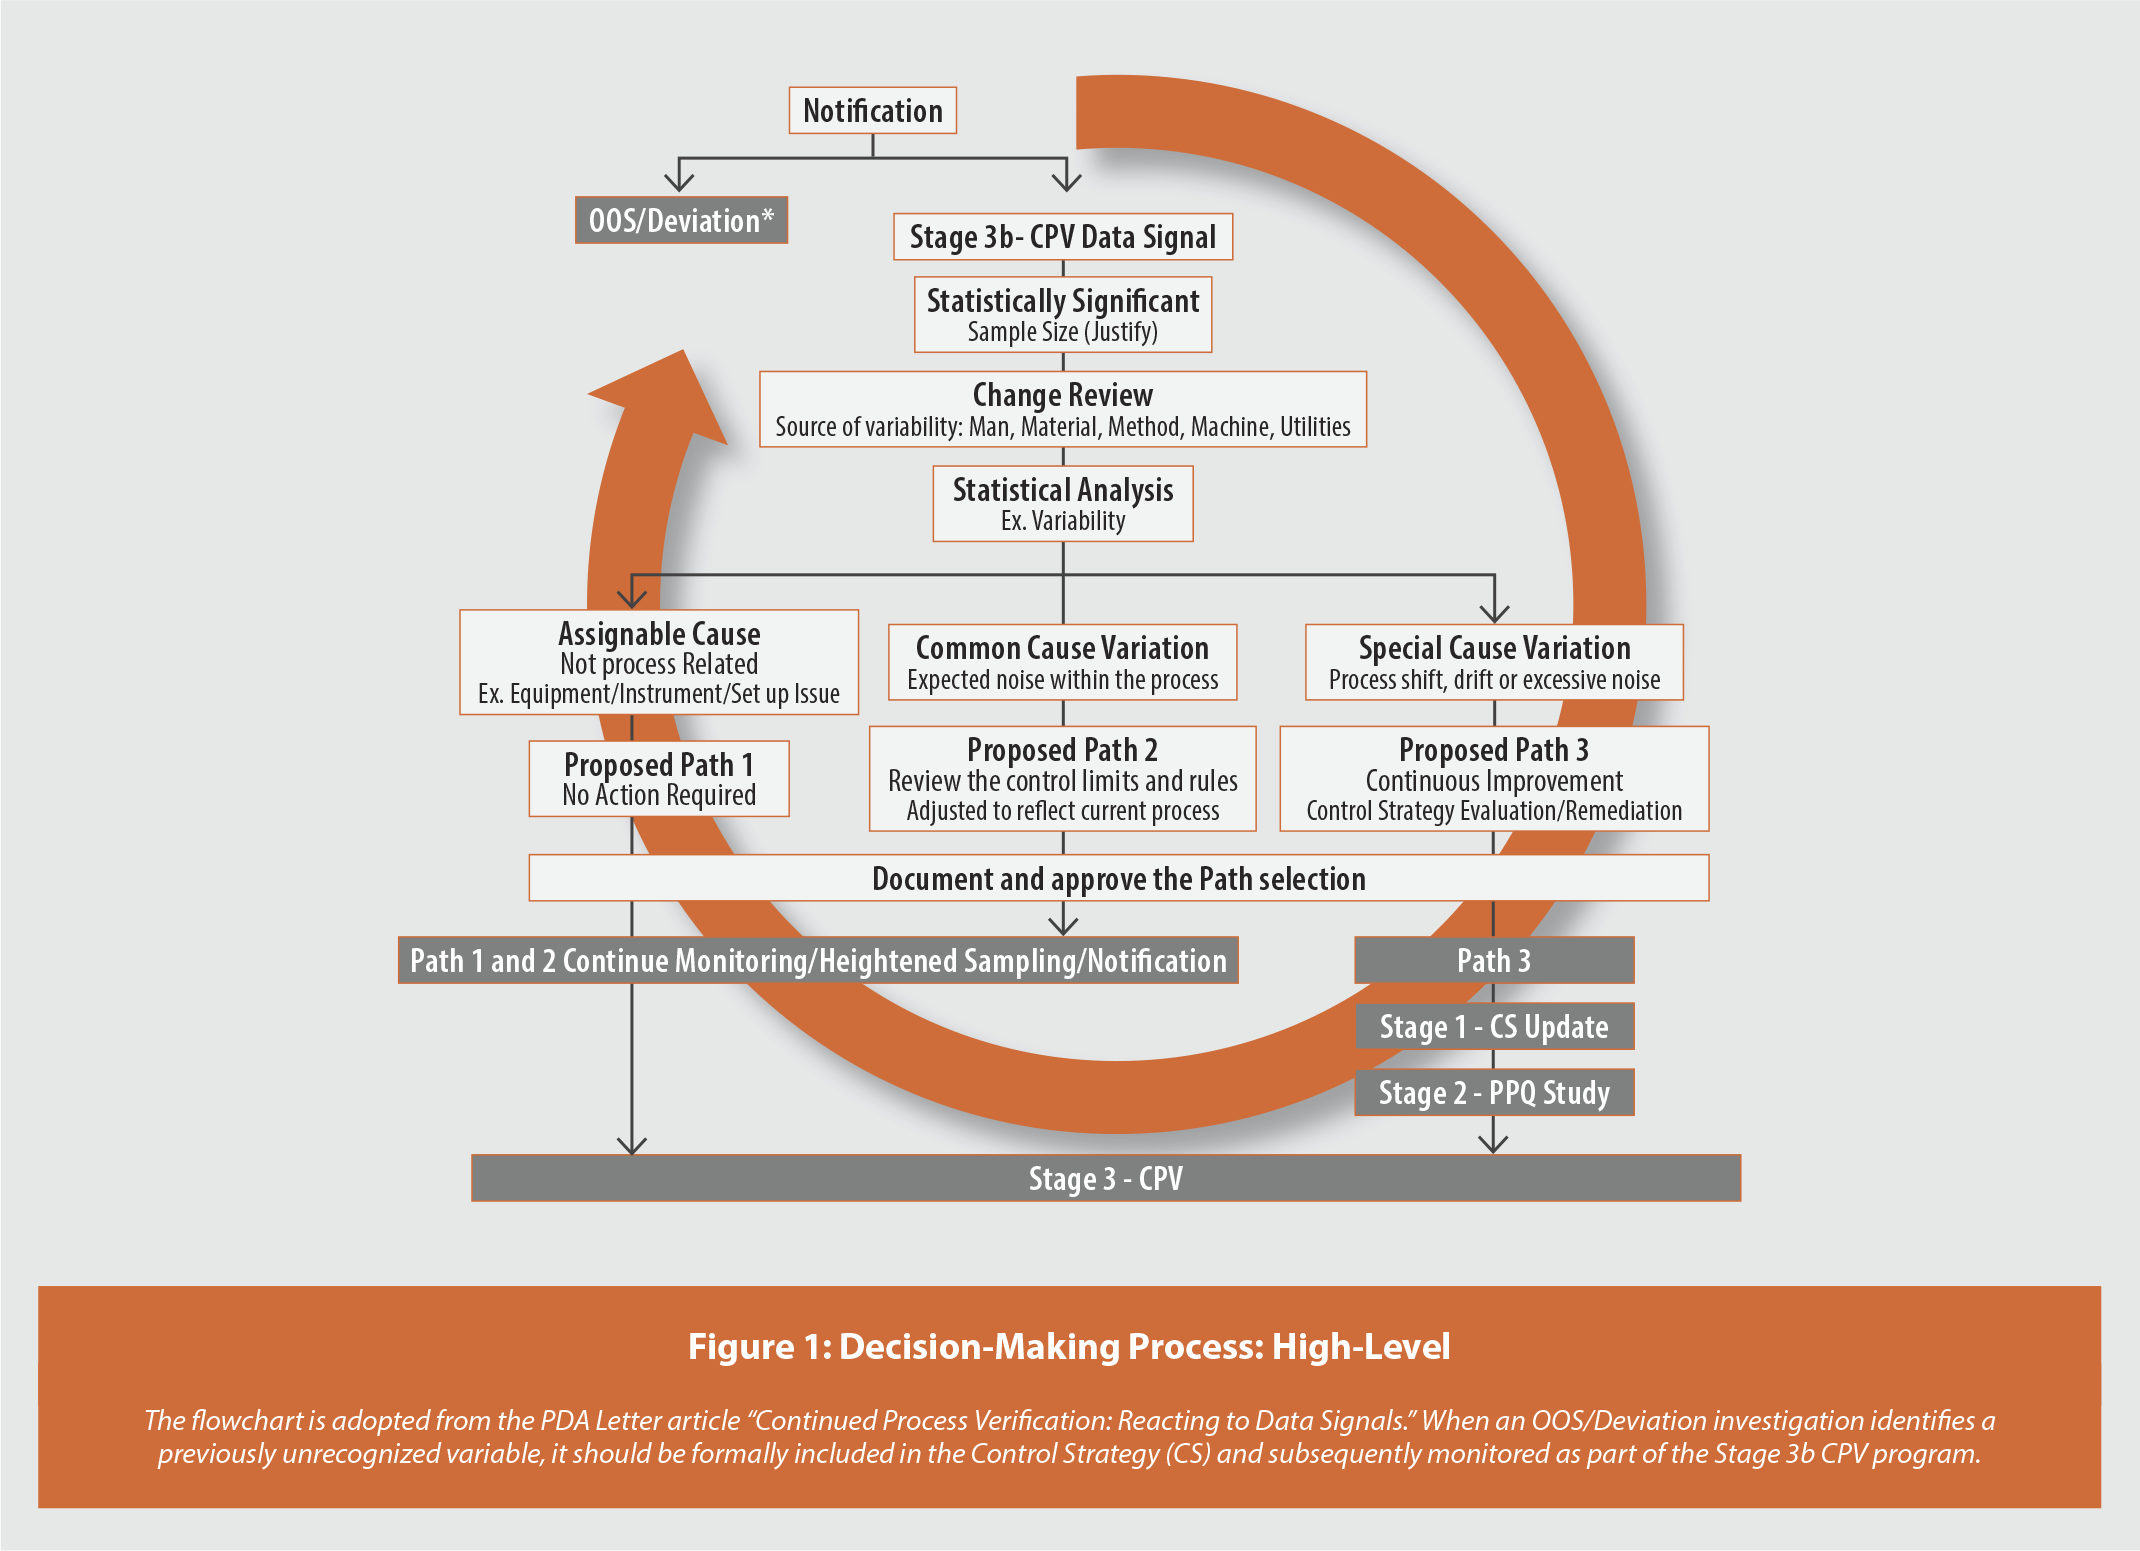
The Stage 3b signal response process is governed by a structured decision tree (Figure 1) that enforces a consistent, defensible evaluation sequence before any conclusions are made. The signal is first evaluated to determine whether it is linked to an OOS result or a deviation. If not, the data population is reviewed to confirm whether sufficient data are available and manufactured under the same conditions; if data is insufficient, monitoring continues. Next, the signal is examined for any attributable or documented causes, such as changes in materials, equipment, or process parameters; when such causes exist, they are addressed through change control. Only signals that pass the above gates proceed to a product specific CMA/CPP/CQA statistical and scientific evaluation. Actions taken in response to a Stage 3b signal should always be commensurate with the criticality of the CMA/CPP/CQA, the strength of statistical evidence of a shift, the overall product risk, and the potential impact on patients.
Not all CMAs, CPPs and CQAs are the same. For example, in the case of CQAs in pharmaceutical manufacturing, there are stage wise criteria (dosage uniformity, dissolution), manual operator driven criteria (hardness, thickness, weight variation), one-sided limits, and non-normal data, having low values (impurities, solvents). Hence, standard capability indices (Cpk, Ppk), such as those used in the engineering industry for direct measurement attributes (e.g., length, breadth, width, weight), do not always apply to pharmaceutical CQAs. Because of the intricately crafted acceptance criteria for pharmaceutical CQAs, traditional SPC strategies and capability measures may yield erroneous indications and fail to provide a suitable assessment of product risk. Therefore, an appropriate statistical analysis method is required for each of such instances.
Stage wise criteria are prevalent in many USP monographs4,5. If a traditional capability index is directly applied to dosage uniformity data, it provides an indication of the probability that a single future unit will meet the desired specification limits. However, the USP <905> uniformity of dosage criterion for acceptance value (AV) primarily assesses variability based on analyses of not less than 10 tablets. The performance of a single unit, while important, is largely unrelated to the product’s ability to meet the AV requirements. Therefore, traditional process capability (e.g., Cpk) measures fall short of providing a reliable assessment, as the probability of passing AV criteria cannot be properly represented by capability indices6. A similar limitation applies to the application of the capability indices for USP <711> dissolution, which uses a three-stage acceptance criterion. Traditional capability computations based on individual unit dissolution data indicate that a single unit will meet the entered specification. However, the stage wise criteria are based on both single-unit and average multiple-unit requirements. Therefore, the proposed framework mandates the use of tailored statistical tools aligned with the nature of each CMA/CPP/CQA monitored. Table 1 provides an example of a manufacturing science based, product-specific CQA specific assessment and reaction plan.
The assessments should consider not only the batches that triggered the signal but also the associated batches that contributed to the Nelson Rule violation, all of which must be evaluated. If additional rationale or factors are identified during the assessment, they should be documented. If process, equipment, or material changes occur that impact the manufacturing process, the sample size should be determined based on batches manufactured following the implementation of the most recent change. If within-batch or analytical variability is suspected, an assessment of the test method is required. All evaluations and decisions are to be documented in a standardized Stage 3b signal assessment record for each signal generated. This record can capture signal details and statistical assessment results, determine the identified cause (assignable, common, or special), and scientifically justify the actions taken (e.g., continue monitoring, implement enhanced sampling, initiate a continuous improvement CAPA). It is important to note that Stage 3a assessment (the stage of continued monitoring and sampling performed until sufficient data are available to generate significant variability estimates) is pivotal in establishing the specific CMA/CPP/CQA Stage 3b reaction guidelines7 for each product/process.
The framework presented in this article provides a pragmatic and scientifically defensible solution to a well recognized challenge, i.e. controlling overreaction to Stage 3b signals. The decision-making framework, including the structured decision tree [Figure 1] and the specific assessment guidelines [Table 1], provides manufacturers with the tools to shift from a reactive decision-making approach to a proactive, science-based Stage 3b signal reaction practice. By moving beyond a one-size-fits-all statistical approach, the industry can more effectively harness Stage 3b data to truly enable continuous improvement and advance manufacturing science. The successful implementation of this methodology reinforces the pharmaceutical quality system, supports a robust supply chain, and provides valuable insights for addressing similar signal scenarios.
References
- FDA (2011). Guidance for Industry, Process Validation: General Principles and Practices, US Food and Drug Administration.
- ICH (2019). Q12: Technical and Regulatory Considerations for Pharmaceutical Product Lifecycle Management, International Council for Harmonisation of technical requirements for pharmaceuticals for human use.
- Pazhayattil, A.B., Ingram, M., Khadilkar, A., Schneider, B.K., Vriezen, N., Bar, R., Giusti, M., Manzano, T. (2020). Continued Process Verification: Reacting to Data Signals, PDA Letter,
- US Pharmacopeia (USP) (2025). <905> Uniformity of dosage units, USP.
- US Pharmacopeia (USP) (2025. <711> Dissolution, USP.
- Alsmeyer, D., Pazhayattil, A., Chen, S., Munaretto, F., Hye, M., Sanghvi, P. (2015). Acceptance Probability (Pa) Analysis for Process Validation Lifecycle Stages, AAPS PharmSciTech, Vol. 17, No. 2.
- Sayeed, N., Pazhayattil, A. B, Collins, J., Chen, S., Ingram, M., Spes, J. (2017). Assessment Methodology for Process Validation Lifecycle Stage 3a, AAPS PharmSciTech, 18(5):1881-1886.
- Disclaimer: This article reflects the views and opinions of the authors and should not be construed to represent any company’s or organization’s views or policies.
Subscribe to our e-Newsletters
Stay up to date with the latest news, articles, and events. Plus, get special
offers from American Pharmaceutical Review delivered to your inbox!
Sign up now!