Abstract
Near infrared spectroscopy (NIRS) is a rapid analytical technique that is capable of assessing uniformity of a blend in a non-destructive, non-invasive manner [1,2]. These attributes of NIRS make it an effective tool for on-line, at-line or off-line analysis of pharmaceutical products. During the manufacture of a powder for oral suspension (POS), obtaining blend uniformity can present challenges due to factors such as particle size, material cohesiveness and flow ability [3,4]. Segregation may occur during the mixing and filling process which could impact the final quality of the product. The scope of this work was to develop and apply a semi-quantitative method that is capable of trending blend uniformity within a manufacture to troubleshoot the mixing and filling operations during scale-up manufacturing runs.
Introduction
A POS formulation was under development and a rapid test was needed to evaluate blend uniformity during powder filling into amber glass bottles due to observed powder segregation issues. POS formulations are powders that are constituted with water by the pharmacist or caregiver to produce a fluid containing undissolved drug. These formulations are developed for pediatric patients as well as patients who experience difficulty swallowing tablets. Drugs in solution are more susceptible to chemical degradation than drugs in the solid state, thus a POS formulation can have greater stability than a ready to use formulation [5]. POS formulations are a mixture of the active pharmaceutical ingredient (API) along with sweeteners, flavors, suspending agents, buffers, glidants, preservatives and coloring agents [6]. Because of the characteristic differences of each of the components of the formulation, there is a good possibility that they may have very different properties (particle size, composition, density, etc.) which could result in a greater risk of separation of the components during the manufacturing process.
Manufacturing a POS formulation typically involves several powder handling steps from blending to the final step of bottling. These include the initial blending of the product, transferring the mixture to a bottling apparatus and adding the powder to each individual bottle. During each of these steps, there is the potential for powder segregation. Segregation occurs when particles of similar properties concentrate different locations within the equipment or process. Common segregation mechanisms in pharmaceutical powder blending processes include sifting and fluidization [7]. Because of multiple steps in the manufacturing process of a POS, a good understanding of powder blending and segregation is needed to avoid a process that is not capable of providing the required blend uniformity. A uniform finished product is required to ensure that the proper amount of the drug is delivered per unit dose.
NIRS is a commonly used technique for monitoring pharmaceutical product processes. Examples of process monitoring using NIRS to obtain qualitative and quantitative results have been widely reported [8,9,10]. Because of the rapid, non-invasive and non-destructive nature of NIRS testing, this technique was evaluated for scale-up monitoring to increase process understanding. Spectral measurements may be complicated when analysis is performed through packaging, but acquisition and data processing steps can be modified to meet this challenge.
The manufacturing process for the POS is blend-mill-blend followed by bottling. During initial scale-up activities, segregation was observed at the beginning and end of manufacturing runs resulting in super/ sub potent results as measured by an HPLC assay (Figure 1) [11]. Varying drug levels at the beginning and end of the run are not uncommon; however, it is optimal to minimize the variation at these locations.
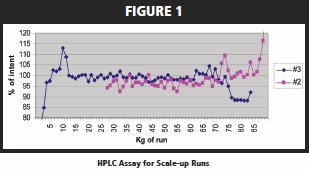
Unfortunately, trending the potency during manufacturing with an HPLC assay is less effective due to the relatively long time delay between sample collection and the assay result. This time lag is due to a sample preparation that necessitates complete wetting of the excipients during reconstitution, which requires approximately 1 hour; followed by an HPLC analysis that takes 5 minutes. Hence, there is a time lag between the manufacturing processes to the assay results of approximately 80 minutes in which time the process may drift outside of specifications. Consequently, a faster NIR technique was sought that could minimize or eliminate sample preparation and reduce measurement time while providing quantitative or semi-quantitative potency trending.
NIR Feasibility
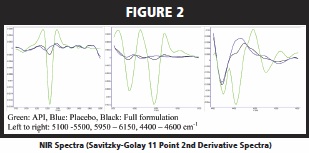
During initial studies, spectra were obtained for the API, placebo and full formulation to define peaks characteristic of the API and determine the feasibility of detecting active content in the full formulation which contains approximately 5% (wt./wt.) drug load. Three regions were identified as unique to the API (Figure 2).
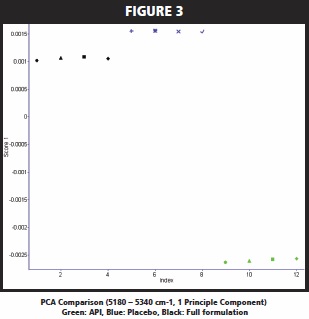
Initial spectra were collected through clear glass vials and results indicated a high probability of success for monitoring blend uniformity by NIRS (Figure 3).
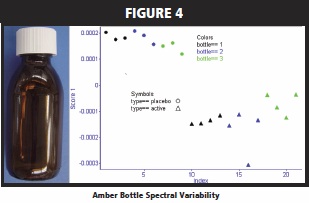
For stability control purposes, the commercial packing for the POS is an amber glass bottle which presented a challenge in developing a non-invasive NIRS method. Bottle characteristics were a large source of spectral variability, but desire was for analysis without sample manipulation (Figure 4). By analyzing the sample in the final bottle, potential segregation due to transfer is avoided and analysis time is reduced.
Experimental Section NIRS
Near infrared absorption measurements were performed on a bench top FT-NIR spectrometer. Spectra were manually collected through the bottom of the amber bottles by placing the bottles directly over the source window. Sixty scans over a spectral range of 12000 cm-1 to 4000 cm-1 at an 8 cm-1 resolution were averaged, which gave a total measurement time of approximately two minutes. Both the number of scans and replicates were optimized to balance acquisition time with spectral quality. The diffuse reflectance absorption spectra were scaled against a 99% reflectance standard and exported to a chemometrics software package for preprocessing.
HPLC
Reference values for calibration/ validation samples were provided by HPLC analysis. An ultra high performance LC (UHPLC) system was used equipped with a 2.1 x 30 mm, 1.8 μm, C18 column controlled at 30 °C. Elution was obtained within 5 minutes using an isocratic system at 0.2 mL/min with UV detection at 290 nm. Sample preparation for LC analysis included reconstitution of the powder to make the aqueous suspension followed by serial dilution to the nominal concentration of the method. Samples were filtered prior to analysis.
Calibration/Validation
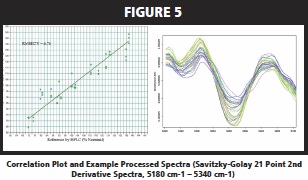
A set of 44 samples equally spaced from approximately 70% to 130% of the nominal concentration (10 mgA/mL) were prepared to investigate the precision and accuracy of the NIRS measurements and to optimize the measurement and processing parameters. In addition, multiple lots of API and excipients were incorporated into the sample set in order to evaluate the measurement and model robustness. Analysis of the data indicated that applying a 21 point Savitzky-Golay 2nd derivative over the API spectral range of 5180 cm-1 – 5340 cm-1 provided reasonable separation in the sample set spectra as a function of concentration. Furthermore, it was determined that a two latent variable PLS model applied to the processed spectra achieved a minimum RMSECV of about 6.76%. A correlation plot of predicted concentration by NIRS versus reference by HPLC is illustrated in Figure 5.
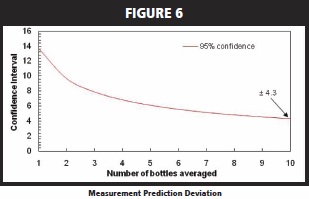
As the optimized measurement and processing was not able to achieve the desired precision from a single measurement (x ± 14% confidence interval at a 95% confidence level), it was necessary toaverage several measurements. Figure 6 illustrates the decrease in the measurement prediction deviation with increasing sample set size. Balancing the prediction deviation against the total measurement time, suggested a sample set size of 10 bottles, which results in a confident interval of ± 4.3% at a 95% confidence level and a measurement time of 20 minutes. This error was acceptable as the intent of the method was to provide trending data that would alert issues where the assay falls outside of the target ranges.
Results and Discussion
A series of experiments were performed to identify the locations where segregation of the product could take place in the bottling process. A systematic decision tree analysis was designed to isolate the various areas in the processing equipment where segregation could occur and provide guidance on how to correct the segregation if it occurs (Figure 7). Each experiment result would feed into the design of the next experiment therefore, near real-time analysis was required. Two 200 kg development batches were divided into subbatches. These sub-batches were used to evaluate the intermediate bulk container (IBC), horizontal feed screw and feed hopper. During each sub-batch manufacture, a corrective action was executed based on the findings of the previous batch. Analytical testing of the final blend showed that the material in the IBC was uniform prior to the filling process.
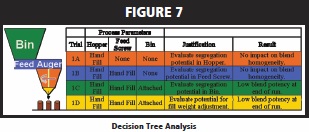
The first experiment (1A) focused on the feed hopper. During the bottle filling operation the feed hopper is initially charged by the blend being released from the horizontal feed screw. The blend drops approximately 1 meter before making contact with the side of the hopper. This drop distance may cause fluidization of the small particles and the impact angle at which the blend hits the hopper surface would cause the large particles to roll towards the center of the feed hopper resulting in the low potency found in bottlesfilled during the beginning of the bottling run. NIRS and HPLC results indicate that by initially hand filling the feed hopper the fluidization and sifting segregation was eliminated.
The next experiment (1B) focused on whether the horizontal feed screw caused a separation of particles during the transport of powder to the feed hopper. Both the feed hopper and the horizontal feed screw were charged by hand prior to bottle filling. Although it was observed that the horizontal feed screw would draw material only from the first few flights of the screw, NIRS and HPLC confirmed that in and of itself, the feed screw did not cause segregation.
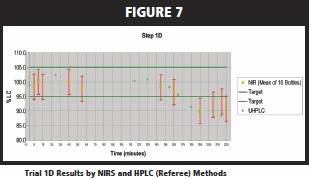
The final experiments (1C and 1D) looked at if the IBC contributed to powder segregation. Again, both the feed hopper and the horizontal feed screw were charged by hand prior to bottle filling. It was observed that the asymmetric design of the IBC, although not adversely effecting the mixing of the blend, did produce a nonuniform flow of blended material from the IBC into the horizontal feed screw. NIRS testing of filled bottles found higher potencies in the bottles being filled at the end of the batch. The non-uniform flow of material from the IBC was augmented by the design of the horizontal feed screw. As noticed in the previous experiments, the feed screw only used the few end flights to draw material from the IBC. This created a preferential draw of material from the bin increasing the segregation already occurring within the IBC.
NIRS provided rapid results for each of the experiments above which allowed changes to experimental plan and equipment changes to be made prior to the next set of experiments. Throughout these experiments HPLC was used as a referee method (Figure 8).
Conclusion
Based on the data collected, drug concentration measurements (Drug load ~ 5% by weight) in amber glass bottles are feasible with a RMSECV of approximately 7%. The precision of the estimate is further increased by averaging 10 replicate measurements to achieve a ± 4.3% confidence interval at a 95% confidence level. This method is sufficient for trending of uniformity across a manufacturing run. HPLC served as a referee method and showed good correlation to the NIR results. This technique can be applied as an off-line test and would provide non-destructive, rapid blend uniformity results which would limit the burden of HPLC testing that would be required and allow for a larger number of samples to be analyzed during a manufacture. In this situation, testing by NIRS versus HPLC resulted in a 90% reduction in analysis time.
Acknowledgements
The authors would like to thank our colleagues Kimber Barnett, Michael Pelletier, Alex Opio, Frank Moore, Marc Robert, Delphine Barthelemy, Marie Simon and Sylvie Darreau for their contributions to this project.
References
1. Effects of particle size and cohesive properties on mixing studies by non-contact near-IR spectrometry. Int. J. Phar., (2008), 361 (1-2), 87-91. L.J. Bellamy, A. Nordon, D. Littlejohn.
2. Real-time on-line blend uniformity monitoring using near-infrared reflectance spectrometry. J. Pharm. Biomed. Analysis, (2009), 49 (1), 48-54. Y. Sulub, B. Wabuyele, P. Gargiulo, J. Pazdan, J. Cheney, J. Berry, A. Gupta, R. Shah, H. Wu, M. Khan.
3. The segregation of particulate materials. Powder Technol., (1976), 15, 245-251. J.C. Williams.
4. Mixing of pharmaceutical solids. I. Effect of particle size on mixing in cylindrical shear and V-shaped tumbling mixers. Powder Technol., (1979), 24, 237-244. Z.T. Chowhan and E.E Linn.
5. Chemical Stability of Pharmaceuticals. New York: John Wiley 1986: 345-350. M.A. Longer, K.A. Conners, G.L. Amidon, V. J.Stella.
6. Pediatric Drug Formulations, Cincinnati Havery Whitney 1990. M.C. Nahata and T.F. Hipple.
7. Preventive medicine: Keys to avoiding powder flow problems. Tablet & Capsules, (2007), 36-43. T. Baxter.
8. Monitoring of blending uniformity; Form conversion and fluid bed drying by near infrared and Raman spectroscopy. Pharm. Rev. (2010), 13 (1), 66-72. C.C. Correder, D. Jayawickrama, G. McGeorge and D. Both.
9. On-line monitoring of powder blend homogeneity by near-infrared spectroscopy. Analytical Chem. (1996), 68, 509-513. S.S. Sekulic, H.W. Ward, D.R. Brannegan, E.D. Stanley, C.L. Evans, S.T. Sciavolino, P.A. Hailey and P.K. Aldridge.
10. A process analytical technology approach to near-infrared process control of pharmaceutical powder blending. Quantitiative near-infrared calibration for prediction of homogeneity and characterization of powder mixing kinetics. J. Pharm. Sci., (2006), 95 (2), 422-434. A.S. El-Hagrasy and J.K. Drennen III.
11. Expanding the application of the tablet processing workstation to support the sample preparation of powders for oral suspension. Manuscript in preparation. A.M. Opio, et. al.
Matt Santangelo is a Senior Associate Scientist at Pfizer, Groton CT. He has 7 years of experience in the pharmaceutical industry. In his current position, Matt provides analytical support to drug product development throughout all stages. He received his B.S. degree in Forensic Science from University of New Haven in 2003 and is currently undergoing graduate studies in Chemistry at Saint Joseph College. His current research interests include the application of rapid spectroscopic techniques to increase process understanding during formulation development. Matthew.santangelo@pfizer.com
Kenneth Norris is a Principal Scientist in the Analytical Development department at Pfizer in Groton Connecticut. He has over 25 years of experience in the pharmaceutical industry. His work in Analytical Development concentrates on analytical method development and establishing specifications for late stage drug formulations and APIs. He has been a major contributor to several marketing applications. Kenneth.j.norris@pfizer.com