Department of Drug Product Development
Introduction
Raman spectroscopic technique has made tremendous progress in the past decade with respect to its sensitivity, functionality and versatility. Its applications in pharmaceutical industry have been expanded markedly [1,2]. Particularly in recent years, the importance and unique advantages of utilizing Raman technique in the biopharmaceutical industry have been recognized and demonstrated in a number of applications [2- 8]. Raman technique belongs to one of the two primary branches of vibrational spectroscopy and is complementary to infrared technique. Both of the techniques can be used for particle identification and material characterization based on the ‘fingerprint’ of a substance – its vibrational spectrum. Raman spectroscopy is inherently a light scattering technique and thus its applications require minimal or no sample preparation and can be carried out in a non-invasive mode [5], which makes it ideal for in situ detection. Particularly, Raman is able to detect the substances that are behind glass walls or other thin transparent films when visible laser is used for excitation. In our recent studies [5,7-10], we have demonstrated that Raman microscopy is particularly suitable for in situ identification of foreign micro-particles or drug-related substances that are inside glass containers (syringes, test tubes or vials). In addition, Raman technique can be used in combination with other microspectroscopic techniques to solve challenging problem of identifying the particles containing composite components [8], to differentiate the protein drug products [4,11] and to characterize the media precipitates that occurred during the viral deactivation treatment [12].
In this brief review, we present three representative case studies that exemplify the current Raman applications in the biopharmaceutical industry. These include the confirmation of the protein particles observed in the formulated solution during stability study; the determination of the spherical particles on the inner surface of glass syringe barrel; and the root-cause analysis (RCA) of the clumped phosphate salt used as raw material for media preparation.
Experimental
Raman spectra were obtained with a dispersive Raman microscope which is the combination of a dual laser Raman spectrometer and a confocal microscope module equipped with multiple objectives. For measurements, the samples were placed on a 3D-motorized stage and a green laser (532nm) was focused on the area of interest through a selected objective with appropriate magnification. Raman signals from samples were checked in real-time mode and optimized prior to collection with a thermoelectrically (TE) cooled CCD detector. The Raman spectra were recorded at the resolution of approximately 9 cm-1 in a typical mid-IR spectral region. Upon necessary, the raw spectra were processed with baseline correction and/or cosmic ray removal prior to spectral display and comparison.
Micrographs of the samples were obtained with an optical stereomicroscope connected to a digital camera or the video camera integrated with the Raman microscope. For rod-like particles discussed in the first example, their scanning electron microscopic (SEM) image and energy dispersive x-ray spectroscopic (EDS) map were also obtained for improved image clarity and elementary information. The SEM/EDS images of the particles were taken at a variable pressure mode with the electron beam accelerating voltage set at 20 kV.
Results and Discussion
Confirmation of Protein Rod-like Particle Formed in Stability Studies
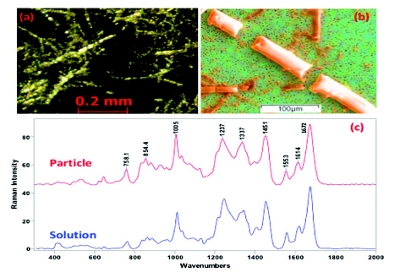
Figure 1. Micrograph of fi ltered particles on a gold-coated fi lter (a); the SEM image overlaid with EDS map of the rod-like particles (b); and the Raman spectra of the rod-like particles and protein solution (c).
Formulation study is an important task in the drug development to ensure the stability and quality of the products. Robust formulation has to be designed to safeguard the required product efficacy and safety. In one of our formulation stability studies for a monoclonal antibody (mAb), rod-like micro-particles were observed in the formulated solution at a specific time point after the selected stresses were applied. To understand the contributing factors that facilitate the particle formation, it is first needed to identify the observed particles, which were speculated as proteinaceous (mAb) in nature. For further confirmation, the particles were transferred to a gold-coated filter (0.8 μm pore size) via filtration, as shown in Figure 1a. The optical micrograph (Figure 1a) shows the particles had a thin and elongated morphology. For enhanced imaging contrast and clarity, a SEM micrograph was also taken on a representative area on the filter and is shown in Figure 1b, overlaid with its EDS mapping using elements carbon and oxygen. The SEM/EDS micrographs clearly show that the micro-particles have the morphology of rod-like crystals. The representative Raman spectrum of the particles is shown in Figure 1c, along with a reference spectrum of the same protein solution (buffer subtracted).
By comparison in Figure 1c, the Raman spectrum from the rod-like particles matches very well with the protein solution spectrum in terms of both band positions and intensities. First, both Raman spectra exhibit typical protein band features, including the amide I band at 1672 cm-1 and its shoulder at 1614 cm-1 from aromatic side chains, amide II at 1553 cm-1, and the sharp phenylalanine ring stretching at 1005 cm-1. The amide I and II bands are characteristic bands from protein amide groups, also called peptide linkages that formed by carboxyl and amino groups from two adjacent amino acids residues. In addition, other medium to strong bands at 758, 1237, 1337 and 1451 cm-1 also demonstrate good agreement between the two spectra. Based on the Raman spectral comparison, the particle morphology and the excipients used in the formulation, the observed particles were confi rmed as the same protein drug substance in the form of rod-like crystals. Based on this identity confirmation, formulation modifications may be carried out to either prevent or promote the formation of protein crystals to facilitate the final delivery form of the drug product.
Identification of Droplet-like Particles inside Prefilled Glass Syringe
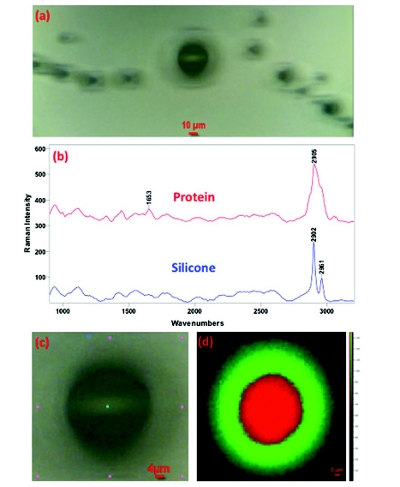
Pre-filled glass syringes (PFS) have been used as one of the primary containers for parenteral drug delivery in biotech industry. Prior to clinical and commercial use, the PFSs have to be characterized and evaluated to ensure the stability and quality of the filled drug product. These include profi ling extractables and leachables, counting visible and sub-visible particles, inspecting silicone oil distribution and evaluating their interactions with the drug product. In one of our simulated studies, the glass syringe was filled with a protein (albumin) solution mixed with a small amount of silicone oil and stressed with multiple shaking and inverting and then stored under room temperature. At a selected time point, the syringe was examined before and after the fi lled solution was expelled. It was observed that the syringe contained many spherical particles on the inner surface of the syringe barrel, shown in Figure 2a. Based on the morphology, it was speculated that these spherical particles might be silicone oil droplets that retained on the barrel inner surface. For confirmation, the droplets were examined with in situ Raman detections. Interestingly, two components were detected on some droplets at different spots by two types of spectra: protein and silicone oil, as shown in Figure 2b. The two have distinct differences: the spectrum of protein in Figure 2b exhibits typical protein bands that are already discussed in the first example. In contrast, the spectrum of silicone oil is dominated by two strong C-H stretching bands at 2902 and 2961 cm-1, which is confirmed by comparison with a silicone oil spectral reference.
For further understanding of the detailed distribution of the two compositions, Raman imaging was performed on a representative droplet and its surrounding area, as shown in Figure 2c. The Raman map is shown in Figure 2d, which was constructed using the direct classical least squares algorithm based on the most pronounced C-H stretching bands. The color intensities of the two compositions are proportional to their relative concentrations on the mapped area. The Raman map clearly reveals the distribution of the two components: the protein (red) component is concentrated in the central area on the droplet and its boundary is encircled with silicone oil (green). This identification might provide some insight about the distribution propensity of the protein and silicone oil on the inner surface of syringe barrel.
Root Cause Analysis of the Clumped Phosphate Salt Raw Material
Media preparation using a number of raw materials is the starting point in the biomanufacturing process, and monitoring the qualification of raw materials is needed to safeguard an uninterrupted production process and the quality of final products. In our inspection of phosphate salts raw material, disodium phosphate heptahydrate, it was found that some of them were clumped granules, as shown in Figure 3a, in contrast to the normal free-flow (un-clumped) granules, as shown in Figure 3b. In some instances it was needed to physically crash them before the material can be used in the feed lines. Based on the well known hydration phenomena of hygroscopic salts from atmospheric moisture, it was assumed that the exposure to excessive atmospheric moisture is the root-cause for the clumped salts. However it is necessary to confirm this assumption to exclude other root-causes so that appropriate measure is taken to prevent its reoccurrence. Disodium phosphate heptahydrate (Na2HPO4•7H2O) are crystallized granules in the sizes of hundreds of microns, which makes Raman in-situ detection ideal for this root-cause analysis.

Figure 3. Micrographs of disodium phosphate heptahydrate salts as clumped (a) and free-fl ow (b) granules; and two types of Raman spectra classifi ed from multiple measurements on the clumped and free-fl ow salt granules (c).
In this analysis, the Raman spectra of both clumped and free-flow phosphate salts were collected directly on a number of clumped and free-flow granules, as well as at the multiple spots on a specific granule. By comparing all the spectra obtained, they can be classified into two types, as shown in Figure 3c, the upper (type II) and lower (type I) traces. The differences between the two types of spectra can be characterized in the two spectral regions. Firstly, in the O-H stretching region (Figure 3c), Type II spectrum presents broad and overlapped features with one resolved band at 3464 cm-1, while in Type I spectrum, three resolved bands at 3442 cm-1, 3372 cm-1 and 3133 cm-1 are present. Secondly, in the lower frequency region from 1500 to 100 cm-1, the Raman bands associated with groups of PO43- and P-O(H) also have significant differences between the two spectra. According to the comparison of dehydration and condensation processes of Na2HPO4•12H2O in a previously reported thermo-Raman study [13], the observed differences between the two types of spectra are attributed to the presence of different numbers of crystal water molecules, and not due to other components or impurities.
In detail, type II spectrum reveals that the salt contains more than seven water molecules on the salt crystals, while type I spectrum shows only two crystal water molecules combined to the salt [13]. The overadsorbed water molecules were most likely due to the high humidity and were responsible for the clumped salt crystals. On the other hand, low humidity such as normal lab conditions (humidity 30%) may lead to water releasing from the salt crystals during Raman measurements. Therefore, keeping the hygroscopic salts from exposing to excessive atmospheric moisture can avoid the occurrences of salt clumping.
Conclusion
In this brief review, we have presented several current Raman applications in the particle identification and material characterization in the biotech industry. In these applications, Raman has demonstrated its capability in non-invasive and in situ detections. For all the examples discussed here, Raman was the most or the only applicable technique that can be used to provide the analytical power to solve these demanding problems. It is expected that Raman applications may be expanded to many other types of applications encountered in biomanufacturing process, provided that there are negligible fluorescence interferences.
Acknowledgements
My colleagues Zai-qing Wen, Gary Li, Peter Masatani, Hong Shen, Aylin Vance and Dan Zhou are thanked for assistances and helpful discussions in the Raman applications. I am also grateful to Drs. Ping Yeh, Joseph Phillips and Linda Narhi for their continuing support and sponsorship in our Raman technical developments.
Author Biography
Dr. Xiaolin Cao is currently a principal scientist in the department of drug product development, Amgen Inc, where he employs a number of analytical techniques to support formulation study, drug product development and pilot plant manufacturing. Prior to joining Amgen, he had worked as a manager of chiroptical spectroscopy in BioTools Inc. in the development and applications of chiral spectroscopic techniques for the structural elucidation of pharmaceutical molecules. Xiaolin Cao received his Ph.D. in Chemistry from the Australian National University and has authored some 60 refereed research papers.
References
- McCreery, L. R. (2000). Raman spectroscopy for chemical analysis (Winefordner, J. D., ed.), Vol. 157, pp. 15-21. John Wiley & Sons, Inc.
- Vankeirsbilck, T., Vercauteren, A., Baeyens, W., Van der Weken, G., Verpoort, F., Vergote, G. & Remon, J. P. (2002). Applications of raman spectroscopy in pharmaceutical analysis. TrAC, Trends Anal. Chem. 21, 869-877.
- Fini, G. (2004). Applications of raman spectroscopy to pharmacy. J. Raman Spectrosc. 35, 335-337.
- Wen, Z.-Q., Cao, X. & Vance, A. (2008). Conformation and side chains environments of recombinant human interleukin-1 receptor antagonist (rh-il-1ra) probed by raman, raman optical activity, and uv-resonance raman spectroscopy. J. Pharm. Sci. 97, 2228-2241.
- Cao, X., Wen, Z.-Q., Vance, A. & Torraca, G. (2009). Raman microscopic applications in the biopharmaceutical industry: In situ identification of foreign particulates inside glass containers with aqueous formulated solutions. Appl. Spectrosc. 63, 830-834.
- de Veij, M., Vandenabeele, P., De Beer, T., Remon, J. P. & Moens, L. (2009). Reference database of raman spectra of pharmaceutical excipients. J. Raman Spectrosc. 40, 297-307.
- Wen, Z.-Q., Vance, A., Vega, F., Cao, X., Eu, B. & Schulthesis, R. (2009). Distribution of silicone oil in prefilled glass syringes probed with optical and spectroscopic methods. PDA J. Pharm. Sci. Technol. 63, 149-158.
- Cao, X., Masatani, P., Torraca, G. & Wen, Z.-Q. (2010). Identification of a mixed microparticle by combined microspectroscopic techniques: A real forensic case study in the biopharmaceutical industry. Appl. Spectrosc. 64, 895-900.
- Eu, B., Cairns, A., Ding, G., Cao, X. & Wen, Z.-Q. (2011). Direct visualization of protein adsorption to primary containers by gold nanoparticles. Journal of Pharmaceutical Sciences 100, 1663-1670.
- Wen, Z.-Q., Cao, X. & Phillips, J. (2010). Application of raman spectroscopy in biopharmaceutical manufacturing. American Pharmaceutical Review 13, 46, 48, 50-53.
- Sane, S. U., Wong, R. & Hsu, C. C. (2004). Raman spectroscopic characterization of drying-induced structural changes in a therapeutic antibody: Correlating structural changes with long-term stability. J. Pharm. Sci. 93, 1005-1018.
- Cao, X., Stimpfl, G., Wen, Z.-Q., Frank, G. & Hunter, G. (2012). Identification and root cause analysis of cell culture media precipitates in the viral deactivation treatment with high temperature short time method. PDA J. Pharm. Sci. Technol. In press.
- Ghule, A., Bhongale, C. & Chang, H. (2003). Monitoring dehydration and condensation processes of Na2HPO4.12H2O using thermo-raman spectroscopy. Spectrochimica Acta, Part A Molecular and Biomolecular Spectroscopy 59A, 1529-1539.