Introduction
Cleaning can generally be defined as the removal of unwanted contaminants to ensure safety, efficacy and quality of the product subsequently manufactured using the same equipment [1]. Cleaning validation is the documented evidence demonstrating the effectiveness of a cleaning procedure based on pre-determined acceptance criteria. Current cleaning procedures are typically validated by swabbing the product-contact surfaces following the clean, with swabs subsequently analyzed, predominantly using High-performance liquid chromatography (HPLC) [1]. This swabbing and analytical activity is time consuming. In addition to plant downtime, additional limitations with current techniques include the need for trained personnel to develop cleaning validation protocols and reports, as well as the risk of cross contamination as a result of not conducting continuous verification of the cleaning process following each clean, which is manifested in the number of product recalls originating from cross contamination of products. Moreover, swab sampling is an indirect method and does not cover the entire equipment surface area, rather swab sites are selected based on worst case locations on the equipment and the results are then extrapolated to account for the total product contact surface area. Such techniques tend to be supplemented with a visual inspection that relies on operator expertise and training, and are thus limited by human subjectivity.
The industry is in need of rapid detection techniques for the realtime detection of low concentrations of API and detergent residues on the commonly used surfaces in the pharmaceutical industry. Rapid technologies could support the transition away from once-off cleaning validation towards continued cleaning process verification. This would be in-line with regulatory expectations and pharmaceutical manufacturing needs [2]. The increased frequency of equipment cleaning process verification will reduce the risk of active and detergent cross-contamination and thereby enable higher acceptance criteria for active and detergent carryover.
Vibrational spectroscopy techniques have been studied for their application in continued cleaning process verification due to their direct nature as well as allowing the simultaneous analysis of low concentrations of organic compounds [3, 4]. Furthermore, chemical or hyperspectral imaging (CI) integrating spectroscopy and conventional imaging has a number of advantages over traditional spectroscopy techniques. Since it provides both spatial and spectral information from a specimen CI offers a more comprehensive description of component concentration and distribution in heterogeneous samples [5]. In addition, CI affords increased sensitivity to minor components [5]. In single point spectroscopy, the contribution of minor compounds to the fi nal averaged signal may not be detectable. However in CI, sensitivity may be increased since the number of spectrum obtained is equal to the number of pixels of the CI system. Thus the limit of detection in CI is dependent on instrumental factors such as the spatial resolution of the imaging system as well as application-dependent factors such as particle size of minor components and their homogeneity/ heterogeneity in the specimen studied.
The authors are partners in an ongoing OPTI-CLEAN project funded by the European Commission, which has a principal objective to develop a mobile NIR-CI system for the continued cleaning verifi cation of pharmaceutical manufacture equipment. Recent developments in CI platform technology have facilitated the design of rapid, high resolution NIR-CI systems which off er potential for low-cost portable systems. In the study presented here, the feasibility of NIR-CI for pharmaceutical cleaning verifi cation is evaluated. A schematic representation of the application of NIR-CI for the detection of pharmaceutical residues on surfaces is represented in Figure 1. The NIR-CI systems employed in the current study is a bench top prototype. However, work is currently ongoing within the Opticlean project to adapt the current design into a mobile system, (www.opticlean-fp7.eu).
 Figure 1. Schematic representation of the application of NIR-CI for continued cleaning verification in pharmaceutical manufacturing plants.
Experimental
Soils of 100, 75, 50, 25, 10 and 1 μg were prepared by transferring 10 μL aliquots corresponding to serial dilutions of sufacetamide sodium salt and sulfadimidine sodium salt in water to stainless steel coupons.
A total of 24 soils were prepared per active pharmaceutical ingredient (API) corresponding to four replicates per concentration level.
Samples were scanned using a prototype NIR-CI system comprising of a mercury-cadmium-telluride (MCT) detector with a detection range of 1260 - 2500 nm and spectral resolution of 10 nm. The pixel size was 30 × 30 μm and the optical sensitive area 9.2 x 6.9 mm2. Data acquisition time to capture a single 384 ×288 × 125 datacube was 5 seconds. The illumination source consisted of four 12V, 20W halogen lamps. This prototype NIR-CI system was designed utilizing components which off er the potential for portable systems with fast acquisition times. To this end, the main benefi t of this system is the fact that the spectrograph employed is a Fabry-Pérot fi lter (Rikola, Oulu, Finland). The benefi ts of Fabry-Pérot fi lters compared to tunable fi lters such as Acousto-Optic Tunable Filters and Liquid Crystal Tunable Filters are their small size and weight, speed of wavelength tuning and high optical throughput [8].
The NIR hyperspectral datacubes obtained were calibrated to correct for the instrument response by measuring a white standard (I0) and the dark current (d) and using equation (1) to convert sample measurement intensity (I) from counts to spectroscopic units [9]. The NIR refl ectance data (R) obtained was then converted into absorbance (A) data by equation (2).
R = (I − d) ∕ (I0 − d) (1)
A = log10 (1 ∕ R) (2)
Analysis of the NIR, hyperspectral datacubes was conducted using both existing and in-house R software routines (R 2.11.1, R Foundation for Statistical Computing, Vienna, Austria).
The wavelength range employed in the analysis was 1260-2170 nm. The NIR datacubes were processed by means of a median fi lter based on a 3 × 3 square neighborhood to remove speckle noise brought about by defective pixels. The NIR datacubes were then auto-scaled to remove baseline shifts and to standardize the variance. A classifi cation function was then employed to diff erentiate stainless steel pixels from residue containing pixels. The classifi cation function was based on the histograms (intensity in the x-axis and the number of pixels per intensity value in the y-axis) of the blank and API soiled stainless steel coupons. Whereas the blank coupons followed a standard normal distribution in the NIR range understudy, soiled coupons with API residues showed a bimodal density. Also, stainless steel coupons had higher absorption values across the NIR range studied (1260 – 2170 nm). The cut-off point in the classifi cation function for detecting residue pixels was the value corresponding to the lower one percentile (P < 0.01) of the standard normal distribution (z = -2.326). Since the secondary peak corresponding to residue pixels causes the corresponding auto-scaled stainless steel pixels to bias away from mean zero, an estimate of the bias was obtained (distance between the primary peak and zero) and subsequently removed to center the density of the stainless steel pixels on zero.
This classifi cation technique was based on two wavelengths for each API. The selected wavelengths corresponded to those wavelengths that resulted in the lowest standard error associated with a linear regression of number of API classifi ed pixels and applied soil concentration. Quantifi cation of API residues on stainless steel coupons was then conducted by building a calibration model based on linear regression of number of pixels identifi ed as residue by the classifi cation function versus concentration (μg residue 50 mm-2). The 95% Confi dence Interval (CI) and 95% Prediction Interval of the linear models were also calculated [10]. The Limit of Detection was also calculated according to the International Cooperation on Harmonisation (ICH) [11] using the equation:
Limit of Detection (LOD) = y + 3.3 × σ
Where y is the residue pixel count for a blank sample and σ is the standard error.
Results and Discussion
Classifi cation of API Residues and Stainless Steel Background
The auto-scaled hyperspectral datacubes corresponding to the diff erent API soils were masked using a classifi cation function to discriminate pixels as API residue or stainless steel background. The thresholded masked images of stainless steel coupons soiled with diff erent concentrations of sulfadimidine sodium salt and sulfacetamide sodium salt are displayed in Figure 2. In these masked images, at any given wavelength, pixels classifi ed as API residue pixels are displayed using their raw absorbance values whereas stainless steel pixels are set to the minimum raw absorbance value of the API classifi ed pixels. It can be observed in Figure 2 that the API soils were correctly extracted from the stainless steel background by the classifi cation function. The two wavebands selected for use in the classifi cation function were 1580 and 2140 nm in the case of sulfadimidine sodium salt, and 1480 and 2140 nm for sulfacetamide sodium salt. It is important to note that this selection was conducted by assessing which combination of two wavelengths from the studied range resulted in linear models of API classifi ed pixels versus applied residue concentration with a minimum standard error associated.
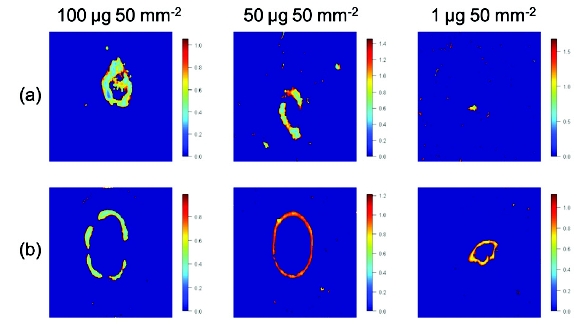 Figure 2. Masked Chemical Images of API residues on stainless steel coupons. Row (a) sulfadimidine sodium salt displayed at 1580 nm (b) sulfacetamide sodium salt displayed at 1480 nm.
The images presented in Figure 2 suggest that the drying pattern of the API soils was not homogeneous for both APIs under study. The dried API soils showed a ring-like structure with the API solids concentrating on the ring with only thin deposits of API observed inside the ring. Previous studies on cleaning verification of manufacturing equipment have also reported similar drying patterns for API soils [12] and dairy residues [4].
Linear Models Based on NIR Hyperspectral Datacubes for the Quantification of API Residue on Stainless Steel
Following the masking classification function, the resultant numbers of API classified pixels per applied soil concentration were fitted with a linear regression model. The obtained linear models for sulfadimidine sodium salt and sulfacetamide sodium salt are displayed in Figure 3. For sulfadimidine sodium salt and sulfacetamide sodium salt soils on stainless steel coupons the R2 values obtained were 0.96 and 0.99 respectively, which indicate a linear relationship between numbers of API classified pixels and applied API soil concentration. In Figure 3, it can also be observed that the number of API classified pixels varied noticeably between replicate soils of the same concentration, especially in the case of sulfadimidine sodium salt. The detected variability in replicate precision may be attributed to the drying of API water-based soils on stainless steel surfaces, as previously discussed which results in a non-homogenous soil with a ring-like appearance.
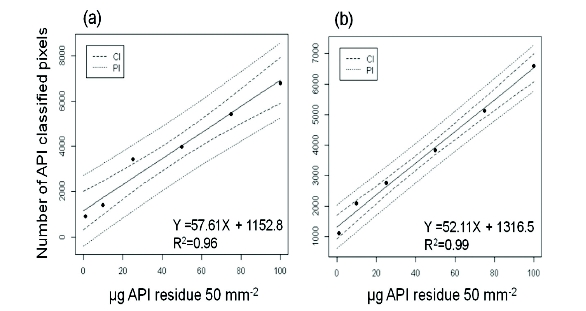 Figure 3. Fitted linear models of number of API classified pixels and applied soil concentration (μg 50 mm-2) for (a) sulfadimidine sodium salt and (b) sulfacetamide sodium salt. CI represents 95% Confidence Interval and PI is 95% Prediction Interval.
The limits of detection (LOD) for sulfadimidine sodium salt and sulfacetamide sodium salt soils on stainless steel coupons calculated according to the International Conference on Harmonisation (ICH) [11] were 27.10 and 13.68 μg / 50 mm2 respectively.
However, visual examination of the images presented in Figure 2 indicate that there is potential to lower the limit of detection of API residues to values circa 1 μg 50 mm- 2. The calculated limits of detection reflect the residual standard error (RSE) of the linear model fitted to the experimental data (number of API classified pixels versus applied soil concentration). The RSE is in turn affected by the variability in the number of pixels classified as API between replicate API residues at the same concentration level. The use of different protocols to simulate the soiling process in industrial manufacturing equipment may result in improved soil uniformity and improved replicate precision, contributing to lowering of the LOD in cleaning verification by NIR-CI.
In addition, further analysis of the NIR hyperspectral datacubes may be conducted to develop robust and accurate models with possibly lower limits of detection for the quantification of API residues. In the present feasibility study, the quantification of API soils was based on regression models developed using solely the number of API pixels identified by the classification function. More elaborated classification functions may be developed and tested, as well as algorithms to extract information related to soil thickness that may result in an improved quantification of API soils in cleaning verification using NIR-CI.
Conclusions
The results presented indicate that NIR-CI combined with simple and fast data analysis is a feasible method for the sensitive detection and quantifi cation of API residues on manufacturing equipment. The analysis of the NIR hyperspectral datacubes via a classifi cation function allowed the development of a quantifi cation model based on the number of API classifi ed pixels per soil. The linear models obtained had R2 values of 0.96 and 0.99 for sulfadimidine sodium salt and sulfacetamide sodium salt soils respectively. Limits of detection were also calculated for the quantifi cation models with values for sulfadimidine sodium salt and sulfacetamide sodium salt soils respectively of 27.10 and 13.68 μg 50 mm2. Diff erent soiling simulation protocols to improve replicate precision as well as further data analysis of the hypercubes to extract additional quantitative information may result in improved quantifi cation models with possibly lower LODs. This research points to the potential future use of portable NIR-CI systems for continued cleaning verifi cation of pharmaceutical manufacturing equipment.
Acknowledgements
The research leading to these results has received funding from the European Community´s Seventh Framework Program (FP7/2207- 2013) under grant agreement number 285836.
References
- I. Jones, P.J. Cullen, A. Greene, Using PAT to Support the Transition from Cleaning Process Validation to Continued Cleaning Process Verifi cation, Journal of Validation Technology. Winter (2012)
- FDA. Guidance for Industry. Process Validation general Principles and Practices. Current Good Manufacturing Practices. 2011.
- M. Jamrógiewicz, Application of the near-infrared spectroscopy in the pharmaceutical technology, J. Pharm. Biomed. Anal. 66 (2012) 1-10.
- M.P. Lang, N.A. Kocaoglu-Vurma, W.J. Harper, L.E. Rodriguez-Saona, Multicomponent Cleaning Verifi cation of Stainless Steel Surfaces for the Removal of Dairy Residues Using Infrared Microspectroscopy, J. Food Sci. 76 (2011) C303-C308.
- A.A. Gowen, C.P. O’Donnell, P.J. Cullen, S.E.J. Bell, Recent applications of Chemical Imaging to pharmaceutical process monitoring and quality control, Eur. J. Pharm. Biopharm. 69 (2008) 10-22.
- C. De Bleye, P.F. Chavez, J. Mantanus, R. Marini, P. Hubert, E. Rozet, E. Ziemons, Critical review of near-infrared spectroscopic methods validations in pharmaceutical applications, J. Pharm. Biomed. Anal. 69 (2012) 125-132.
- G. Reich, Near-infrared spectroscopy and imaging: Basic principles and pharmaceutical applications, Adv. Drug Delivery. Rev. 57 (2005) 1109-1143.
- G.J. Edelman, E. Gaston, T.G. van Leeuwen, P.J. Cullen, M.C.G. Aalders, Hyperspectral imaging for non-contact analysis of forensic traces, Forensic Sci. Int.
- B. Boldrini, W. Kessler, K. Rebner, R.W. Kessler, Hyperspectral imaging: a review of best practice, performance and pitfalls for in-line and on-line applications, Journal of Near Infrared Spectroscopy. 20 (2012) 483-508.
- J. Neter, W. Wasserman, G. Whitmore, Applied statistics. 4th ed. 1993: Allyn & Bacon, Inc.
- International Conference on Harmonisation (ICH) Q2b, 62, 1997, 27463-27467.
- D.K. Corrigan, N.A. Salton, C. Preston, S. Piletsky, Towards the development of a rapid, portable, surface enhanced Raman spectroscopy based cleaning verifi cation system for the drug nelarabine, J. Pharm. Pharmacol. 62 (2010) 1195-1200.
Author Biographies
Patrick J. Cullen, Ph.D., coordinates pharmaceutical technology research at the Dublin Institute of Technology, Ireland. He has a background in both pharmaceutical manufacturing and optical measurement. His current research interests include the development of chemical and 3D imaging systems for pharmaceutical control.
Ian Jones has 10 years’ experience in the pharmaceutical manufacturing sector with expertise in process technology and product robustness in addition to pharmaceutical characterization. He was the Technology Manager for Manufacturing and Packaging Operations within Wyeth, Ireland. He lectures at the European College of Validation in Brighton and the Dublin Institute of Technology. He has studied Strategy, Leadership and Innovation within the Pharmaceutical Industry at the Harvard Business School, Boston.
Carl Sullivan, Ph.D., is a lecturer in mathematics at the Dublin Institute of Technology, Ireland. He completed a Ph.D. in statistics in the area of outlier detection using Kalman fi lters and a BA in Mathematics. His current research involves the use mathematical tools for image analysis, in particular the use of marginal and conditional residuals to detect outlying data relative to neighbouring observations. He also has a keen interest in the use of Group Theory with regard to molecular vibration.
Laura Alvarez-Jubete, Ph.D., is a Post-Doctoral Researcher at the Dublin Institute of Technology, Ireland. She has previous experience in projects dealing with diff erent aspects of analytical chemistry in the food and pharmaceutical sector. Her current research topic includes the application of chemical imaging and chemometrics in pharmaceutical technology and process control.
Jaya Mishra is a Post-Graduate Research scholar at the Dublin Institute of Technology, Ireland. She has a degree in Electrical Engineering and her area of interests includes chemometrics, multivariate statistical analysis, Imaging (color and spectral).